The laboratory information system (LIS) market is growing consistently, driven by the digital transformation of healthcare and the increasing demand for efficient data management in laboratories. The integration of LIS with electronic health records and diagnostic instruments has enhanced workflow efficiency and result accuracy. Rising test volumes in clinical laboratories and the push toward personalized medicine are further fueling system adoption.
The market benefits from the expansion of cloud-based platforms that enable remote data access, interoperability, and scalability. Growing regulatory requirements for data traceability and patient safety are encouraging healthcare providers to adopt advanced LIS solutions.
Continuous innovation in analytics and automation modules is improving operational transparency and turnaround time. As healthcare systems continue to prioritize digital infrastructure modernization, the LIS market is positioned for sustained expansion globally.
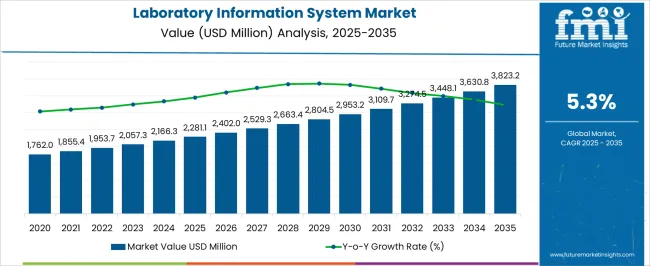
| Metric | Value |
|---|---|
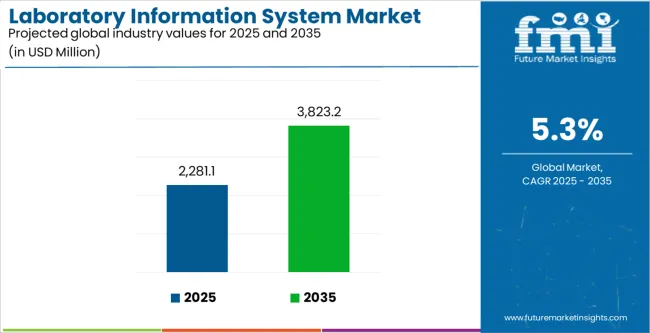
| Laboratory Information System Market Estimated Value in (2025 E) | USD 2281.1 million |
| Laboratory Information System Market Forecast Value in (2035 F) | USD 3823.2 million |
| Forecast CAGR (2025 to 2035) | 5.3% |
The market is segmented by Component, Delivery Mode, and End User and region. By Component, the market is divided into Services, Software, and Hardware. In terms of Delivery Mode, the market is classified into Cloud-Based and On-Premise. Based on End User, the market is segmented into Clinics, Hospitals, Independent Laboratories, and Others. Regionally, the market is classified into North America, Latin America, Western Europe, Eastern Europe, Balkan & Baltic Countries, Russia & Belarus, Central Asia, East Asia, South Asia & Pacific, and the Middle East & Africa.
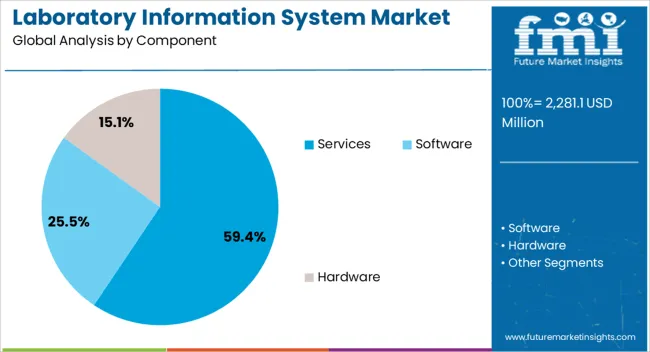
The services segment dominates the component category with approximately 59.4% share, reflecting its critical role in system implementation, customization, and maintenance. Hospitals and laboratories rely on specialized service providers for integrating LIS with existing diagnostic workflows and data management systems.
The segment’s growth is supported by the increasing complexity of laboratory operations, which require ongoing technical support and system optimization. Managed services have gained popularity as healthcare organizations seek cost-effective ways to maintain regulatory compliance and ensure uptime.
Continuous training and periodic system upgrades are also driving revenue within this segment. With the growing need for interoperability and performance optimization, the services segment is expected to maintain its leadership through the forecast period.
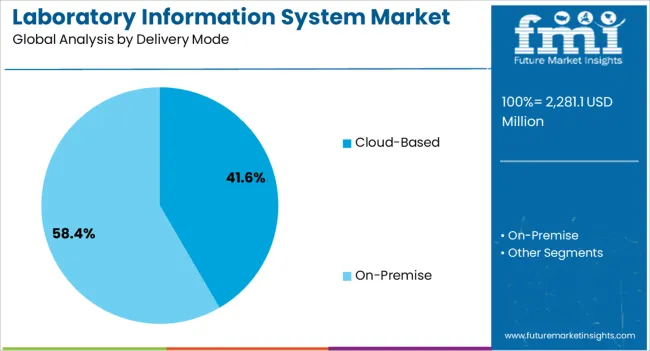
The cloud-based segment leads the delivery mode category, accounting for approximately 41.6% share. This dominance is attributed to its scalability, cost-effectiveness, and ability to facilitate remote accessibility across multiple laboratory networks. Cloud deployment enables real-time data sharing, streamlined updates, and enhanced security through centralized monitoring.
Smaller laboratories benefit from reduced upfront investment, while larger institutions utilize cloud solutions for multi-location coordination. The segment also aligns with the broader healthcare shift toward digital transformation and flexible IT infrastructure.
Continuous improvements in data encryption and cybersecurity are strengthening user confidence. With healthcare providers prioritizing digital efficiency and interoperability, the cloud-based delivery model is set to remain the preferred choice for LIS implementation.
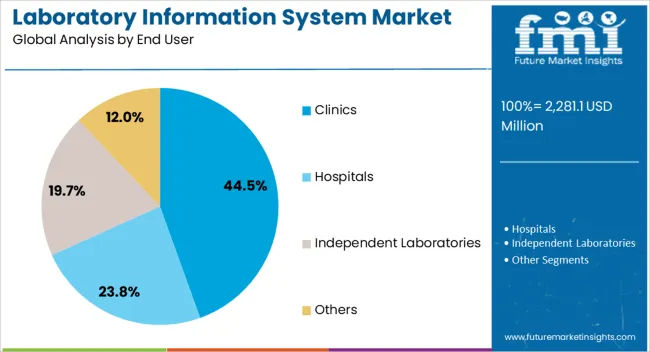
The clinics segment holds approximately 44.5% share of the end-user category, driven by the growing demand for efficient diagnostic workflows and patient data integration at point-of-care facilities. Clinics require streamlined information systems to manage high test volumes, automate reporting, and ensure compliance with quality standards.
The adoption of LIS in clinics has been supported by the increasing prevalence of chronic diseases and the rising need for timely test results to support treatment decisions. Cost-effective cloud-based models have made these solutions accessible to small and mid-sized healthcare centers.
With the continued decentralization of healthcare delivery and emphasis on operational efficiency, the clinics segment is projected to retain its leading position in the LIS market.
The section below shows the services segment dominating the laboratory information system industry. It is projected to account for a revenue share of 59.4% in 2025. Based on delivery mode, the cloud-based segment will likely expand at a high CAGR of 6.0% through 2035. By end-user, the clinics segment is set to account for a revenue share of 44.5% in 2025.
Market Growth Outlook by Component
| Component | Value CAGR |
|---|---|
| Software | 6.3% |
| Hardware | 7.3% |
| Services | 4.4% |
Based on components, the services segment is projected to generate significant revenue in the market through 2035. As per the latest analysis, the target segment will likely exhibit a CAGR of 4.4% during the assessment period, totaling a valuation of USD 1,899.2 million by 2035.
Demand for services in the laboratory information market is growing steadily, which is expected to continue through 2035. This is due to their ability to add value, reduce complexity, improve efficiency, and ensure regulatory compliance.
Market Growth Outlook by Delivery Mode
| Delivery Mode | Value CAGR |
|---|---|
| On-premise | 4.5% |
| Cloud-based | 6.0% |
Demand is expected to remain high for cloud-based laboratory information systems during the forecast period. This is because they offer several benefits over traditional on-premises systems, including increased accessibility, improved scalability, and reduced costs.
As per the latest report, the cloud-based LIS segment is projected to rise at a CAGR of 6.0% over the assessment period. It will likely attain a market valuation of USD 2,121.8 million by 2035.
Market Growth Outlook by End-user
| End-user | Value CAGR |
|---|---|
| Hospitals | 6.2% |
| Clinics | 4.0% |
| Independent Laboratories | 7.6% |
| Others | 3.1% |
Adoption of laboratory information systems remains high in clinics. The target segment is estimated to account for a market share of 44.5% in 2025 and further expand at 4.0% CAGR during the forecast period. This is due to the growing adoption of clinical laboratory information systems in clinics for different purposes.
Rising Popularity of Cloud-based Solutions Emerging a Key Market-shaping Trend
The global market for laboratory information systems recorded a CAGR of 4.4% from 2020 to 2025. It reached a total valuation of around USD 2,043.6 million in 2025. Over the assessment period, demand for laboratory information systems is poised to rise at 5.3% CAGR.
Growing Adoption of Cloud-based Laboratory Information Systems
The adoption of cloud-based laboratory information systems (LIS) represents a transformative opportunity for healthcare providers, introducing a paradigm shift in data management and system infrastructure. Cloud-based LIS solutions leverage remote servers to store, manage, and process laboratory data, offering healthcare organizations increased accessibility, scalability, and cost-effectiveness.
One of the key advantages is enhanced accessibility. Cloud-based LIS allows authorized users to access laboratory information securely from anywhere with an internet connection. This flexibility promotes collaborative and remote work scenarios, enabling healthcare professionals to review results, make informed decisions, and coordinate care more efficiently.
Scalability is another notable benefit of cloud-based LIS. Cloud solutions offer the ability to scale resources up or down based on demand, accommodating the dynamic needs of healthcare organizations. This scalability ensures that laboratories can handle varying workloads without the need for substantial infrastructure investments or the risk of underutilized resources.
Cost-effectiveness is a compelling aspect of cloud-based LIS adoption. It eliminates the need for on-premises hardware maintenance and upgrades, reducing capital expenditures. Cloud solutions typically operate on a subscription or pay-as-you-go model, allowing healthcare providers to allocate resources more efficiently and manage costs effectively.
Overall, the adoption of cloud-based LIS solutions empowers healthcare organizations to modernize their infrastructure, streamline operations, and focus resources on delivering high-quality patient care. As technology advances, cloud-based solutions continue to offer innovative ways to enhance the efficiency and accessibility of laboratory information management.
The integration of laboratory information systems (LIS) with Mobile Health (mHealth) technologies signifies a dynamic convergence that opens new vistas in healthcare delivery. This integration facilitates a seamless connection between laboratory data and mobile health applications, unlocking opportunities for remote monitoring, enhanced data access, and heightened patient engagement.
mHealth integration with LIS enables healthcare professionals to monitor and access laboratory results remotely and in real-time through mobile devices. This is particularly valuable for situations requiring rapid decision-making or when healthcare providers need to stay informed about critical diagnostic information outside traditional healthcare settings.
Patients also benefit from mHealth integration as they gain convenient access to their laboratory results and health data through mobile applications. This accessibility fosters increased patient engagement, empowering individuals to actively participate in managing their health. Patients can receive timely alerts, track their health metrics, and collaborate more effectively with healthcare providers.
mHealth integration also enhances communication between patients and healthcare professionals, fostering a continuous and connected care experience. Remote monitoring and instant access to laboratory results through mobile applications contribute to more proactive healthcare interventions, ultimately improving patient outcomes.
As technology continues to advance, the synergy between LIS and mHealth holds promise for revolutionizing healthcare delivery. It will create a more patient-centric and interconnected ecosystem that leverages the convenience and ubiquity of mobile technologies.
High Cost and Interoperability Issues
The integration of laboratory information systems is negatively impacted by the high implementation costs. The initial financial outlay required for adopting LIS solutions poses a considerable challenge, particularly for smaller laboratories and healthcare facilities operating within constrained budgets.
The comprehensive nature of LIS implementation involves expenses related to software licensing, hardware infrastructure, staff training, and potential customization to align with specific organizational needs. This limits its adoption in several regions.
Smaller laboratories, clinics, and healthcare facilities, often grappling with limited financial resources, find it challenging to allocate the necessary funds for a robust LIS deployment. The capital-intensive nature of LIS implementation exacerbates the financial burden, potentially hindering these entities from harnessing the efficiency and technological advancements offered by modern laboratory information systems.
Ongoing operational costs, including maintenance, updates, and support services, can compound the economic strain on smaller healthcare organizations. This financial barrier may result in delayed or compromised adoption of LIS, impacting the efficiency of laboratory processes and potentially limiting the facility's ability to provide optimal patient care.
To overcome this obstacle, stakeholders in the healthcare sector, including governments, regulatory bodies, and technology providers, will have to take several steps. For instance, they need to explore cost-effective models, subsidies, or incentives to facilitate broader access to LIS solutions, ensuring that financial constraints do not impede the progress toward more efficient and integrated laboratory management systems.
Interoperability issues can manifest in compatibility issues between LIS and EHR platforms, hindering the smooth flow of information. Misaligned data formats, varying coding schemes, and divergent data standards across systems can impede the accurate and coherent exchange of laboratory data. Differing technical architectures and communication protocols may further exacerbate integration complexities.
The above-mentioned challenges not only affect the efficiency of healthcare workflows but also have implications for patient care. Incomplete or delayed access to laboratory results within EHRs can compromise the timely and comprehensive decision-making processes of healthcare providers.
The table below highlights the growth projections of the top nations. The United States is expected to dominate the global laboratory information system industry throughout the forecast period.
This can be attributed to rising cancer prevalence, growing need for personalized medicine, increasing healthcare spending, and easy availability of LIS products & services.
The East Asia laboratory information system market, spearheaded by China and South Korea, is poised to register strong growth during the assessment period. This growth will likely be propelled by factors like the increasing incidence of chronic diseases and the growing need for efficient and streamlined laboratory operations and laboratory automation.
Market Growth Outlook by Key Countries
| Countries | Value CAGR |
|---|---|
| United States | 3.6% |
| China | 11.5% |
| Japan | 5.3% |
| Germany | 2.8% |
| Spain | 4.6% |
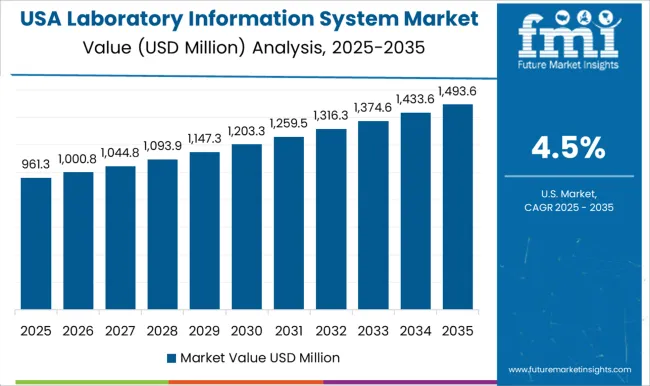
The United States dominated the global market with a 51.1% market share in 2025. Over the assessment period, demand for laboratory automation systems in the United States is expected to grow at a CAGR of 3.6%.
By 2035, the United States LIMS market size is projected to reach USD 1,496.8 million. Some of the key drivers/trends include:
The United States has a well-established and advanced healthcare infrastructure, including numerous laboratories and healthcare facilities. This is making it a highly lucrative market for sophisticated information systems, such as LIS.
The United States has a large number of healthcare providers, including hospitals, clinics, and diagnostic laboratories. The high demand for information management systems in these facilities contributes to the growth of the laboratory information system market in the nation.
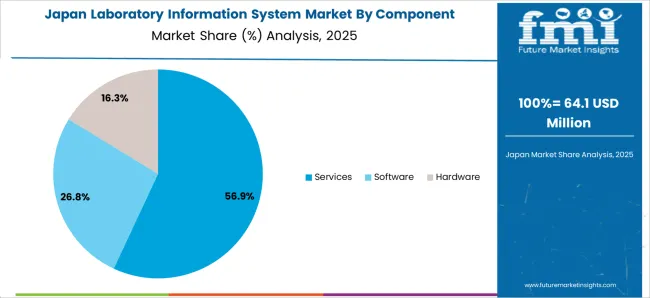
Japan’s laboratory information system market is poised to exhibit a CAGR of 5.3% during the forecast period. Total valuation in the country will likely increase from USD 2281.1 million in 2025 to USD 3823.2 million by 2035, driven by factors like:
The presence of competitive companies and a thriving market ecosystem can contribute to Japan's leadership in the LIS market across East Asia. A competitive environment often fosters innovation and the development of high-quality solutions, including LIS systems.
Supportive regulatory frameworks and policies are encouraging the adoption of healthcare information systems, including laboratory information management systems (LIMS). Similarly, the growing need for advanced research laboratories equipped with sophisticated LIS to manage complex experiments and data will likely improve Japan’s laboratory information system market share.
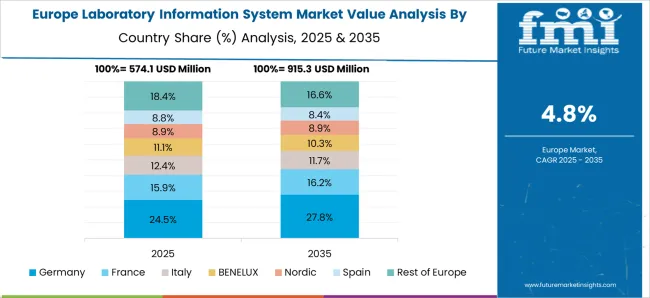
Germany accounted for a value share of 3.8% in the global laboratory information system market in 2025. For the assessment period, sales of laboratory information systems in Germany are projected to rise at a CAGR of 2.8%. This is attributable to factors like:
Germany is a leader in research and development, which extends to healthcare technologies. This, in turn, is driving the need for advanced LIS solutions that can manage complex research workflows and large datasets, thereby fostering sales growth.
Germany has strict healthcare regulations and standards. Compliance with these regulations often necessitates the use of advanced information systems for managing laboratory data, contributing to the demand for LIS. Companies investing in the development of innovative LIS solutions will likely contribute to the growth of the market.
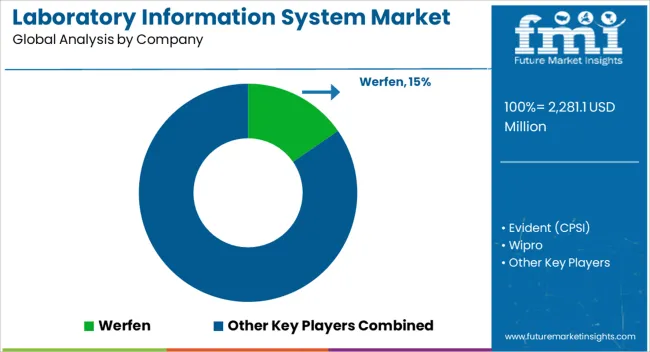
The competitive landscape in the laboratory information system (LIS) market is dynamic, with several companies offering a range of solutions to meet the diverse needs of healthcare providers and laboratories.
Several companies are also inclined towards adopting strategies like partnerships, collaborations, acquisitions, and agreements to stay ahead of the competition.
Recent Developments in the Laboratory Information System Market
| Report Attributes | Details |
|---|---|
| Current Total Market Size (2025) | USD 2,166.3 million |
| Projected Market Size (2035) | USD 3,620.3 million |
| CAGR (2025 to 2035) | 5.3% |
| Base Year for Estimation | 2025 |
| Historical Period | 2020 to 2025 |
| Projections Period | 2025 to 2035 |
| Quantitative Units | USD million for value and thousand units for volume |
| Components Analyzed (Segment 1) | Software, Hardware, Services |
| Delivery Modes Analyzed (Segment 2) | On-premise, Cloud-based |
| End Users Analyzed (Segment 3) | Hospitals, Clinics, Independent Laboratories, Others |
| Regions Covered | North America; Latin America; Western Europe; Eastern Europe; South Asia and Pacific; East Asia; Middle East & Africa |
| Countries Covered | United States, Canada, Mexico, Brazil, Argentina, Germany, France, United Kingdom, Italy, Spain, Netherlands, China, India, Japan, South Korea, ANZ, GCC Countries, South Africa |
| Key Players influencing the Laboratory Information System Market | Werfen, Evident (CPSI), Wipro, CompuGroup Medical, LabWare, Roper Technologies Inc. (Sunquest), Medical Information Technology, Inc., Xifin Inc., Epic Systems Corporation, Cerner Corp., Soft Computer Consultants, Allscripts Lab (Veradigm), LigoLab, Sysmex Corporation, Ilex Medical, LabVantage Medical Suite, Mckesson Corporation (Orchard Software) |
| Additional Attributes | Revenue share by component (software, hardware, services), Delivery mode trends (cloud vs on-premise), End-user adoption by clinics and independent labs, Impact of regulatory digital transformation in lab operations, LIS integrations with EHRs and healthcare analytics platforms |
| Customization and Pricing | Customization and Pricing Available on Request |
The global laboratory information system market is estimated to be valued at USD 2,281.1 million in 2025.
The market size for the laboratory information system market is projected to reach USD 3,823.2 million by 2035.
The laboratory information system market is expected to grow at a 5.3% CAGR between 2025 and 2035.
The key product types in laboratory information system market are services, software and hardware.
In terms of delivery mode, cloud-based segment to command 41.6% share in the laboratory information system market in 2025.


Full Research Suite comprises of:
Market outlook & trends analysis
Interviews & case studies
Strategic recommendations
Vendor profiles & capabilities analysis
5-year forecasts
8 regions and 60+ country-level data splits
Market segment data splits
12 months of continuous data updates
DELIVERED AS:
PDF EXCEL ONLINE
Laboratory Centrifuge & Accessories Market Size and Share Forecast Outlook 2025 to 2035
Laboratory Shakers Market Size and Share Forecast Outlook 2025 to 2035
Laboratory Washers Market Size and Share Forecast Outlook 2025 to 2035
Laboratory Rockers and Shakers Market Size and Share Forecast Outlook 2025 to 2035
Laboratory Filtration Devices Market Size and Share Forecast Outlook 2025 to 2035
Laboratory and Medical Scale Ozone Generator Market Size and Share Forecast Outlook 2025 to 2035
Laboratory Furnaces Market Analysis - Size, Share, and Forecast 2025 to 2035
Laboratory Supplies Market Size and Share Forecast Outlook 2025 to 2035
Laboratory Benchtop Automation Market Growth – Trends & Forecast 2025 to 2035
Laboratory Balances and Scales Market Growth - Industry Forecast 2025 to 2035
Global Laboratory Filter Paper Market Growth – Trends & Forecast 2024-2034
Laboratory Sample Container Market
Laboratory Filtration Equipment Market Growth – Trends & Forecast 2019-2027
Laboratory Glassware and Plasticware Market
Laboratory Ovens Market Analysis by Mechanical Convection and Vacuum Ovens Type through 2035
AI in Laboratory Solution Market Size and Share Forecast Outlook 2025 to 2035
Dental Laboratory Market Size and Share Forecast Outlook 2025 to 2035
Laboratory Grinders Market Size and Share Forecast Outlook 2025 to 2035
Service Laboratory Market Analysis by Service Type, Deployment, Channel, End-user, and Region Through 2035
Analytical Laboratory Service Market Size and Share Forecast Outlook 2025 to 2035

Thank you!
You will receive an email from our Business Development Manager. Please be sure to check your SPAM/JUNK folder too.
Chat With
MaRIA