IV Infusion Bottle Seals & Caps Market Size and Share Forecast Outlook 2025 to 2035

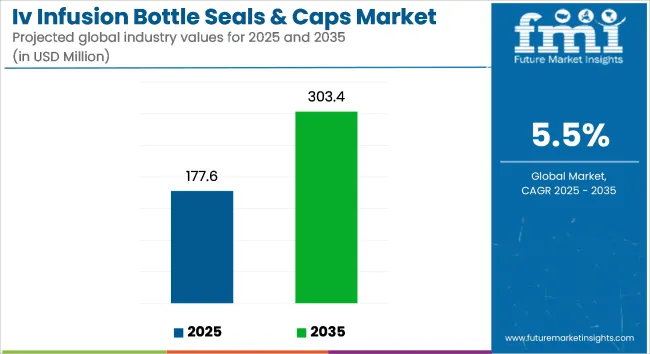
The IV infusion bottle seals & caps market is projected to grow from USD 177.6 million in 2025 to USD 303.4 million by 2035, registering a CAGR of 5.5% during the forecast period. Sales in 2024 reached USD 168.3 million. Growth is being driven by rising demand for sterile, tamper-proof packaging in the pharmaceutical and clinical nutrition sectors, particularly across Asia-Pacific and Europe.
Quick Stats of IV Infusion Bottle Seals & Caps Market

  • Market Value (2025): USD 177.6 million
  • Forecast Value (2035): USD 303.4 million
  • Forecast CAGR: 5.5%
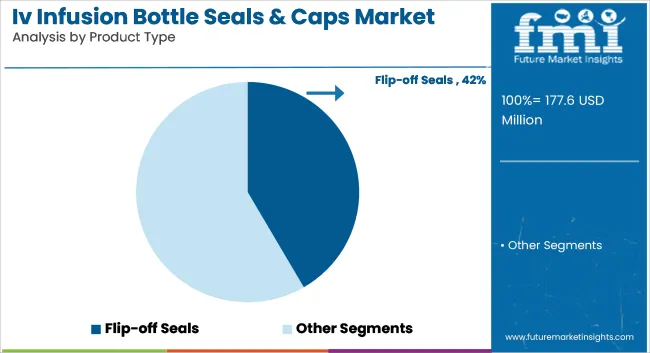
  • Product Leader in 2025: Flip-off Seals (41.6% market share)
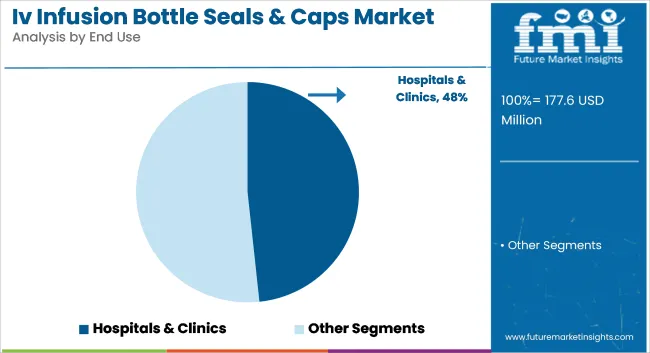
  • Top End Use: Hospitals & Clinics (48.3% share)
  • Key Growth Country: Europe (Germany is growth market with 5.6% CAGR)

Iv Infusion Bottle Seals & Caps Market Industry Value Analysis

Metric Value
Industry Size (2025E) USD 177.6 Million
Industry Value (2035F) USD 303.4 Million
CAGR (2025 to 2035) 5.5%

Hospitals and contract manufacturing organizations are emphasizing drug integrity and patient safety, further boosting demand for advanced closure systems. The rising penetration of biologics and parenteral formulations has also supported the adoption of high-barrier cap and seal technologies that reduce contamination risks.

Recyclability, alongside regulatory compliance with USP Class VI and ISO 15378, has been emphasized to minimize environmental impact while maintaining sterility. In addition, automation-driven innovations in sealing machines have enhanced precision in component fit and minimized leakage. Smart traceability features such as RFID tagging for infusion bottles are being trialed in hospitals.

These enhancements reflect growing interest in digital integration and lifecycle transparency. Strategic partnerships with pharma suppliers are also being cultivated to accelerate rollout of compliant, sustainable solutions that support both bulk and unit-dose parenteral formats. Sustainability efforts have been reinforced through the shift toward recyclable aluminum seals and medical-grade polypropylene caps.

Future growth is expected to be fueled by increased adoption of advanced infusion therapies in oncology and critical care, requiring robust primary sealing solutions. The industry is projected to benefit from strong regulatory push around traceability, authentication, and user safety. Custom-designed caps and color-coded seal systems for drug differentiation are forecast to become more mainstream as hospitals demand operational ease.

Competitive focus is likely to intensify around compliant, automation-ready closure designs. In addition, the growing prevalence of home infusion treatments may prompt further miniaturization and safety-lock features, enhancing market scope globally. Strategic R&D in polymer blends and high-integrity sealing profiles will remain a key differentiator.

Analyzing IV Infusion Bottle Seals & Caps Market by Top Investment Segment

The market is segmented based on product type, material type, end-use application, and region. By product type, the market includes flip-off seals, tear-off seals, euro cap seals, aluminum seals, plastic caps, and combination seals. In terms of material type, the market is categorized into aluminum, polypropylene (PP), polyethylene (PE), rubber, and elastomeric composites.

By end-use application, the market comprises hospitals & clinics, ambulatory surgical centers, home healthcare settings, emergency medical services, and veterinary healthcare. Regionally, the market is analyzed across North America, Latin America, East Asia, South Asia & Pacific, Eastern Europe, Western Europe, Oceania, and the Middle East & Africa.
Flip-Off Seals Preferred for Secure Closure and Ease of Access

Iv Infusion Bottle Seals & Caps Market Analysis By Product Type

Flip-off seals have been projected to lead the market with an estimated 41.6% share in 2025, driven by their combination of tamper evidence and easy vial access. These seals have been favored for compatibility with automated sealing lines and various IV container formats. Hospitals and pharmaceutical firms have prioritized them for sterility and reliability in liquid drug administration.

Widespread regulatory compliance has supported their adoption globally. Durability and uniform crimping capabilities have made flip-off seals suitable for high-speed fill-and-finish operations. Their color-coded caps have facilitated identification, aiding inventory control and clinical efficiency. Pharmaceutical packaging standards have endorsed flip-off designs for single-use and parenteral applications. Compatibility with glass and plastic infusion bottles has ensured product flexibility across medical formats.

Technological upgrades have improved seal coating materials and cap ergonomics. Barrier properties and tamper-evident band integrity have been strengthened through design optimization. Flip-off systems have minimized particulate contamination during removal, ensuring sterility upon opening.

Manufacturers have integrated FDA and USP-compliant materials to meet stringent hygiene mandates. Demand has been bolstered by expanding biologics and injectable drug markets, where secure sealing remains critical. Cost-effective manufacturing and recyclability have further increased appeal in value-driven healthcare segments. Local sourcing and regional production strategies have helped maintain supply chain resilience. With hospitals scaling up procedural volumes, demand for these closures has remained robust.
Hospitals and Clinics Drive Demand Through High Procedure Volume

Iv Infusion Bottle Seals & Caps Market Analysis By End Use

Hospitals & clinics have been expected to dominate the end-use segment with 48.3% of the market share in 2025, due to their centralized role in intravenous drug administration. A high concentration of surgical procedures, emergency treatments, and critical care units has fueled packaging volume requirements.

Daily operations have necessitated reliable and sterile seal formats to support patient safety. Consistent consumption patterns have provided stable demand across developed and developing regions. Large-scale procurement programs and standardization across hospital networks have favored products like flip-off and tear-off seals.

Central pharmacies within hospitals have relied on high-quality seal integrity for drug reconstitution and storage. Accreditation bodies have enforced packaging safety norms, driving investment in compliant sealing technologies. Integration with automated IV filling lines has enhanced operational efficiency.

Hospitals have prioritized closures that prevent microbial ingress while enabling rapid clinical access. Reusable devices and multi-dose vials have also used these seals for resealing capabilities. Training protocols and staff familiarity with flip-off systems have ensured adherence to safe administration practices.

Clinical trials and in-house compounding units have further stimulated seal consumption. As healthcare infrastructure expands, especially in Asia and Latin America, hospital-based packaging needs have been forecast to rise significantly. Public-private partnerships have promoted localized seal manufacturing aligned with national health goals.

Product traceability, batch identification, and anti-counterfeit features have been incorporated in institutional procurement specifications. The hospital segment is therefore expected to maintain its leadership in the global IV infusion bottle seals and caps market.

Challenges and Opportunities

Challenge

Stringent Regulatory Compliance and Material Safety

The most profound challenge for the IV infusion bottle caps and seals market is compliance with stringent regulatory guidelines for medical packaging. Biocompatible, non-reactive with intravenous pharma drugs, and serializable are just some of the myriad material testing that has to accompany any innovative device with an international regulatory stamp (such as the FDA, EMA, and other health agencies worldwide).

This leads the manufacturers to use medical-grade polymers, aluminum, and rubber materials that are very costly and have a set standard safety requirement statements and a very delicate and tedious supply chain.

Opportunity

Advancements in Sustainable and Smart Packaging

The growing need for sustainable healthcare packaging is presenting high growth opportunities to the IV Infusion Bottle Seals & Caps market. Companies are adopting green solutions such as recyclable and degradable materials to reduce medical packaging waste. Smart packaging technologies like RFID tracking and tamper-evident technology are gaining traction on the back of patient safety, in addition to enhancing inventory management in hospitals and healthcare centers.

Only innovation-led, compliant, and sustainable packaging solution providers with financial muscle to invest in such partnerships will capitalize on the growing opportunity in IV infusion bottle sealing components segments.
Country-wise Outlook

Iv Infusion Bottle Seals & Caps Market Cagr Analysis By Country

United States

The USA IV infusion bottle seals & caps market is expected to grow steadily, owing to an increasing demand for advanced packaging in the healthcare sector, growing hospitalizations, and a surge in the pharmaceutical industry. The expanding demand for tamper-evident and sterile packaging solutions is driving new material formats as well as designs. Additionally, rigorous FDA regulations related to the safety of medical packaging, coupled with environmental sustainability initiatives, are driving companies to manufacture BPA-free and recyclable parts.

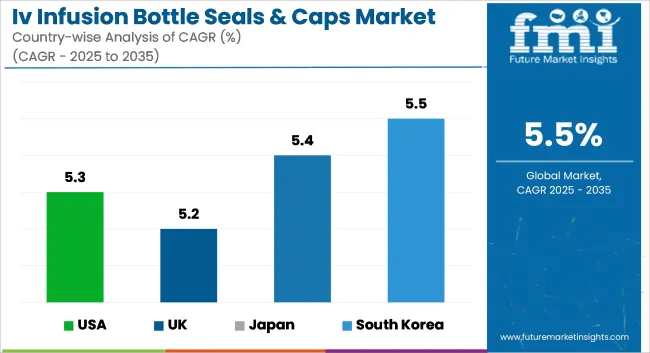
Country CAGR (2025 to 2035)
USA 5.3%

United Kingdom

Growing use of aseptic packaging in the healthcare industry & increasing investments in biopharmaceutical manufacturing are expected to drive the UK IV infusion bottle seals & caps market. As more of the manufacturing industry moves towards sustainable and EU-compliant products, companies are looking even more towards recyclable and bio-compatible materials. Expansion of home healthcare services is also creating the demand for safe, easy-to-handle, and leak-proof infusion packaging.

Country CAGR (2025 to 2035)
UK 5.2%

European Union

The EU IV Infusion Bottle Seals &Caps Market is driven by improving investments in healthcare infrastructure, stringent pharmaceutical packaging regulations, and the increasing need for sterile, tamper-proof seals and caps.

The press release also mentioned that the German market is the leading region in the sample analysis market, followed by France and Italy, where the high pharmaceutical manufacturing capacity and increased focus on regulatory compliance adherence towards EMA guidelines are driving the market. Apart from this, the increasing need for single-use medical packaging in hospitals and clinics is driving the market growth.

Region CAGR (2025 to 2035)
European Union 5.6%

Japan

Japan IV infusion bottle seal & caps industry is growing in response to a growing population of geriatrics, the surging demand for novel drug delivery mechanisms, and heavy regulatory restrictions imposed on the pharmaceutical packaging segment. Japan's demand for very strict sterilization requirements and contaminant avoidance measures are creating demands for high-performing, multi-layer sealing compounds. Smart package solutions like RFID-bearing seals are gaining momentum among smart packaging investment priorities in the health care space across Japan.

Country CAGR (2025 to 2035)
Japan 5.4%

South Korea

South Korea’s IV infusion bottle seals & caps market is growing due to expanding pharmaceutical manufacturing, increasing government healthcare spending, and the rising need for tamper-proof medical packaging. The country’s push for localized production of medical-grade plastics and aluminum caps is further boosting the market. Additionally, advancements in cleanroom manufacturing and automation are supporting the production of highly sterile and durable infusion bottle components.

Country CAGR (2025 to 2035)
South Korea 5.5%

Competitive Outlook

The IV Infusion Bottle Seals & Caps market is experiencing significant growth driven by the rising demand for advanced and sterile medical packaging solutions. With the increasing use of IV therapies in hospitals, clinics, and home healthcare settings, the need for secure and contamination-free bottle seals and caps has surged.

Advancements in material science, regulatory compliance, and sterilization technologies have further contributed to market expansion. Leading players in the industry are focusing on innovation, sustainable materials, and manufacturing scalability to strengthen their market presence.

Key Players

  • West Pharmaceutical Services: A provider of advanced packaging solutions for IV infusion and injectables.
  • SGD Pharma: Specializes in pharmaceutical glass packaging, including components for IV solutions.
  • Bormioli Pharma: Offers sustainable packaging solutions for IV infusion bottles and related applications.
  • Gerresheimer AG: Develops innovative medical packaging solutions with a strong emphasis on regulatory compliance.
  • Rubberex: Supplies medical-grade rubber seals and closures for IV bottles and other pharmaceutical applications.

Report Scope Table - IV Infusion Bottle Seals & Caps Market

Report Attributes Details
Current Total Market Size (2025) USD 177.6 million
Projected Market Size (2035) USD 303.4 million
CAGR (2025 to 2035) 5.5%
Base Year for Estimation 2024
Historical Period 2020 to 2024
Projections Period 2025 to 2035
Quantitative Units USD million for value and million units for volume
Products Analyzed (Segment 1) PP Caps, Rubber Seals
Neck Sizes Analyzed (Segment 2) Up to 20 mm, 21 to 28 mm, 29 to 32 mm, Above 32 mm
Applications Analyzed (Segment 3) Packaging, Printing
Regions Covered North America; Latin America; Western Europe; Eastern Europe; South Asia and Pacific; East Asia; Middle East & Africa
Countries Covered United States, Canada, Mexico, Brazil, Argentina, Germany, France, United Kingdom, Italy, Spain, Netherlands, China, India, Japan, South Korea, ANZ, GCC Countries, South Africa
Key Players influencing the IV Infusion Bottle Seals & Caps Market B. Braun Medical Inc., RENOLIT SE, Medline Industries Inc., Wuxi Qitian Medical Technology Co., Ltd, Datwyler Holding AG, Winfield Laboratories Inc., Prasad Meditech, Taiwan Hon Chuan Enterprise, Jiangsu Changjiang Lids, Cardinal Health Inc.
Additional Attributes Dollar sales by product type (PP vs rubber), Neck size compatibility trends across standard IV packaging, Demand from contract manufacturing and hospital pharmacies, Regulatory emphasis on seal integrity and sterility assurance, Innovations in tamper-evident and printable cap solutions
Customization and Pricing Customization and Pricing Available on Request

IV Infusion Bottle Seals & Caps Market Segmentation

By Product:

  • PP Caps
  • Rubber Seals

By Neck Size:

  • Up to 20 mm
  • 21 to 28 mm
  • 29 to 32 mm
  • Above 32 mm

By Application:

  • Packaging
  • Printing

By Region:

  • North America
  • Latin America
  • Western Europe
  • Eastern Europe
  • East Asia
  • South Asia Pacific
  • Middle East and Africa

Table of Content

  1. Executive Summary
    • Global Market Outlook
    • Demand-side Trends
    • Supply-side Trends
    • Technology Roadmap Analysis
    • Analysis and Recommendations
  2. Market Overview
    • Market Coverage / Taxonomy
    • Market Definition / Scope / Limitations
  3. Market Background
    • Market Dynamics
      • Drivers
      • Restraints
      • Opportunity
      • Trends
    • Scenario Forecast
      • Demand in Optimistic Scenario
      • Demand in Likely Scenario
      • Demand in Conservative Scenario
    • Opportunity Map Analysis
    • Product Life Cycle Analysis
    • Supply Chain Analysis
      • Supply Side Participants and their Roles
        • Producers
        • Mid-Level Participants
        • Wholesalers and Distributors
      • Value Added and Value Created at Node in the Supply Chain
      • List of Raw Material Suppliers
      • List of Existing and Potential Buyer’s
    • Investment Feasibility Matrix
    • Value Chain Analysis
      • Profit Margin Analysis
      • Wholesalers and Distributors
      • Retailers
    • PESTLE and Porter’s Analysis
    • Regulatory Landscape
      • By Key Regions
      • By Key Countries
    • Regional Parent Market Outlook
    • Production and Consumption Statistics
    • Import and Export Statistics
  4. Global Market Analysis 2020 to 2024 and Forecast, 2025 to 2035
    • Historical Market Size Value (USD Million) & Volume (Units) Analysis, 2020 to 2024
    • Current and Future Market Size Value (USD Million) & Volume (Units) Projections, 2025 to 2035
      • Y-o-Y Growth Trend Analysis
      • Absolute $ Opportunity Analysis
  5. Global Market Pricing Analysis 2020 to 2024 and Forecast 2025 to 2035
  6. Global Market Analysis 2020 to 2024 and Forecast 2025 to 2035, By Product Type
    • Introduction / Key Findings
    • Historical Market Size Value (USD Million) & Volume (Units) Analysis By Product Type, 2020 to 2024
    • Current and Future Market Size Value (USD Million) & Volume (Units) Analysis and Forecast By Product Type, 2025 to 2035
      • Flip-Off Seals
      • Tear-Off Seals
      • Euro Cap Seals
      • Aluminum Seals
      • Plastic Caps
      • Combination Seals
    • Y-o-Y Growth Trend Analysis By Product Type, 2020 to 2024
    • Absolute $ Opportunity Analysis By Product Type, 2025 to 2035
  7. Global Market Analysis 2020 to 2024 and Forecast 2025 to 2035, By Material Type
    • Introduction / Key Findings
    • Historical Market Size Value (USD Million) & Volume (Units) Analysis By Material Type, 2020 to 2024
    • Current and Future Market Size Value (USD Million) & Volume (Units) Analysis and Forecast By Material Type, 2025 to 2035
      • Aluminum
      • Polypropylene (PP)
      • Polyethylene (PE)
      • Rubber
      • Elastomeric Composites
    • Y-o-Y Growth Trend Analysis By Material Type, 2020 to 2024
    • Absolute $ Opportunity Analysis By Material Type, 2025 to 2035
  8. Global Market Analysis 2020 to 2024 and Forecast 2025 to 2035, By End-Use Application
    • Introduction / Key Findings
    • Historical Market Size Value (USD Million) & Volume (Units) Analysis By End-Use Application, 2020 to 2024
    • Current and Future Market Size Value (USD Million) & Volume (Units) Analysis and Forecast By End-Use Application, 2025 to 2035
      • Hospitals & Clinics
      • Ambulatory Surgical Centers
      • Home Healthcare Settings
      • Emergency Medical Services
      • Veterinary Healthcare
    • Y-o-Y Growth Trend Analysis By End-Use Application, 2020 to 2024
    • Absolute $ Opportunity Analysis By End-Use Application, 2025 to 2035
  9. Global Market Analysis 2020 to 2024 and Forecast 2025 to 2035, By Region
    • Introduction
    • Historical Market Size Value (USD Million) & Volume (Units) Analysis By Region, 2020 to 2024
    • Current Market Size Value (USD Million) & Volume (Units) Analysis and Forecast By Region, 2025 to 2035
      • North America
      • Latin America
      • Europe
      • East Asia
      • South Asia
      • Oceania
      • MEA
    • Market Attractiveness Analysis By Region
  10. North America Market Analysis 2020 to 2024 and Forecast 2025 to 2035, By Country
    • Historical Market Size Value (USD Million) & Volume (Units) Trend Analysis By Market Taxonomy, 2020 to 2024
    • Market Size Value (USD Million) & Volume (Units) Forecast By Market Taxonomy, 2025 to 2035
      • By Country
        • USA
        • Canada
      • By Product Type
      • By Material Type
      • By End-Use Application
    • Market Attractiveness Analysis
      • By Country
      • By Product Type
      • By Material Type
      • By End-Use Application
    • Key Takeaways
  11. Latin America Market Analysis 2020 to 2024 and Forecast 2025 to 2035, By Country
    • Historical Market Size Value (USD Million) & Volume (Units) Trend Analysis By Market Taxonomy, 2020 to 2024
    • Market Size Value (USD Million) & Volume (Units) Forecast By Market Taxonomy, 2025 to 2035
      • By Country
        • Brazil
        • Mexico
        • Argentina
        • Chile
        • Peru
        • Rest of Latin America
      • By Product Type
      • By Material Type
      • By End-Use Application
    • Market Attractiveness Analysis
      • By Country
      • By Product Type
      • By Material Type
      • By End-Use Application
    • Key Takeaways
  12. Europe Market Analysis 2020 to 2024 and Forecast 2025 to 2035, By Country
    • Historical Market Size Value (USD Million) & Volume (Units) Trend Analysis By Market Taxonomy, 2020 to 2024
    • Market Size Value (USD Million) & Volume (Units) Forecast By Market Taxonomy, 2025 to 2035
      • By Country
        • Germany
        • Italy
        • France
        • UK
        • Spain
        • Russia
        • BENELUX
        • Rest of Europe
      • By Product Type
      • By Material Type
      • By End-Use Application
    • Market Attractiveness Analysis
      • By Country
      • By Product Type
      • By Material Type
      • By End-Use Application
    • Key Takeaways
  13. East Asia Market Analysis 2020 to 2024 and Forecast 2025 to 2035, By Country
    • Historical Market Size Value (USD Million) & Volume (Units) Trend Analysis By Market Taxonomy, 2020 to 2024
    • Market Size Value (USD Million) & Volume (Units) Forecast By Market Taxonomy, 2025 to 2035
      • By Country
        • China
        • Japan
        • South Korea
      • By Product Type
      • By Material Type
      • By End-Use Application
    • Market Attractiveness Analysis
      • By Country
      • By Product Type
      • By Material Type
      • By End-Use Application
    • Key Takeaways
  14. South Asia Market Analysis 2020 to 2024 and Forecast 2025 to 2035, By Country
    • Historical Market Size Value (USD Million) & Volume (Units) Trend Analysis By Market Taxonomy, 2020 to 2024
    • Market Size Value (USD Million) & Volume (Units) Forecast By Market Taxonomy, 2025 to 2035
      • By Country
        • India
        • Thailand
        • Malaysia
        • Indonesia
        • Rest of South Asia
      • By Product Type
      • By Material Type
      • By End-Use Application
    • Market Attractiveness Analysis
      • By Country
      • By Product Type
      • By Material Type
      • By End-Use Application
    • Key Takeaways
  15. Oceania Market Analysis 2020 to 2024 and Forecast 2025 to 2035, By Country
    • Historical Market Size Value (USD Million) & Volume (Units) Trend Analysis By Market Taxonomy, 2020 to 2024
    • Market Size Value (USD Million) & Volume (Units) Forecast By Market Taxonomy, 2025 to 2035
      • By Country
        • Australia
        • New Zealand
      • By Product Type
      • By Material Type
      • By End-Use Application
    • Market Attractiveness Analysis
      • By Country
      • By Product Type
      • By Material Type
      • By End-Use Application
    • Key Takeaways
  16. MEA Market Analysis 2020 to 2024 and Forecast 2025 to 2035, By Country
    • Historical Market Size Value (USD Million) & Volume (Units) Trend Analysis By Market Taxonomy, 2020 to 2024
    • Market Size Value (USD Million) & Volume (Units) Forecast By Market Taxonomy, 2025 to 2035
      • By Country
        • GCC
        • Rest of MEA
      • By Product Type
      • By Material Type
      • By End-Use Application
    • Market Attractiveness Analysis
      • By Country
      • By Product Type
      • By Material Type
      • By End-Use Application
    • Key Takeaways
  17. Key Countries Market Analysis
    • USA
      • Pricing Analysis
      • Market Share Analysis, 2024
        • By Product Type
        • By Material Type
        • By End-Use Application
    • Canada
      • Pricing Analysis
      • Market Share Analysis, 2024
        • By Product Type
        • By Material Type
        • By End-Use Application
    • Brazil
      • Pricing Analysis
      • Market Share Analysis, 2024
        • By Product Type
        • By Material Type
        • By End-Use Application
    • Mexico
      • Pricing Analysis
      • Market Share Analysis, 2024
        • By Product Type
        • By Material Type
        • By End-Use Application
    • Argentina
      • Pricing Analysis
      • Market Share Analysis, 2024
        • By Product Type
        • By Material Type
        • By End-Use Application
  18. Market Structure Analysis
    • Competition Dashboard
    • Competition Benchmarking
    • Market Share Analysis of Top Players
      • By Regional
      • By Product Type
      • By Material Type
      • By End-Use Application
  19. Competition Analysis
    • Competition Deep Dive
      • B. Braun Medical Inc.
        • Overview
        • Product Portfolio
        • Profitability by Market Segments (Product/Age /Sales Channel/Region)
        • Sales Footprint
        • Strategy Overview
          • Marketing Strategy
          • Product Strategy
          • Channel Strategy
      • RENOLITSE
        • Overview
        • Product Portfolio
        • Profitability by Market Segments (Product/Age /Sales Channel/Region)
        • Sales Footprint
        • Strategy Overview
          • Marketing Strategy
          • Product Strategy
          • Channel Strategy
      • Medline Industries Inc.
        • Overview
        • Product Portfolio
        • Profitability by Market Segments (Product/Age /Sales Channel/Region)
        • Sales Footprint
        • Strategy Overview
          • Marketing Strategy
          • Product Strategy
          • Channel Strategy
      • Wuxi Qitian Medical Technology Co., Ltd
        • Overview
        • Product Portfolio
        • Profitability by Market Segments (Product/Age /Sales Channel/Region)
        • Sales Footprint
        • Strategy Overview
          • Marketing Strategy
          • Product Strategy
          • Channel Strategy
      • Datwyler Holding AG
        • Overview
        • Product Portfolio
        • Profitability by Market Segments (Product/Age /Sales Channel/Region)
        • Sales Footprint
        • Strategy Overview
          • Marketing Strategy
          • Product Strategy
          • Channel Strategy
      • Winfield Laboratories Inc.
        • Overview
        • Product Portfolio
        • Profitability by Market Segments (Product/Age /Sales Channel/Region)
        • Sales Footprint
        • Strategy Overview
          • Marketing Strategy
          • Product Strategy
          • Channel Strategy
      • Prasad Meditech
        • Overview
        • Product Portfolio
        • Profitability by Market Segments (Product/Age /Sales Channel/Region)
        • Sales Footprint
        • Strategy Overview
          • Marketing Strategy
          • Product Strategy
          • Channel Strategy
      • Taiwan Hon Chuan Enterprise
        • Overview
        • Product Portfolio
        • Profitability by Market Segments (Product/Age /Sales Channel/Region)
        • Sales Footprint
        • Strategy Overview
          • Marketing Strategy
          • Product Strategy
          • Channel Strategy
      • Jiangsu Changjiang Lids
        • Overview
        • Product Portfolio
        • Profitability by Market Segments (Product/Age /Sales Channel/Region)
        • Sales Footprint
        • Strategy Overview
          • Marketing Strategy
          • Product Strategy
          • Channel Strategy
      • Cardinal Health Inc.
        • Overview
        • Product Portfolio
        • Profitability by Market Segments (Product/Age /Sales Channel/Region)
        • Sales Footprint
        • Strategy Overview
          • Marketing Strategy
          • Product Strategy
          • Channel Strategy
  20. Assumptions & Acronyms Used
  21. Research Methodology

List of Tables

  • Table 1: Global Market Value (USD Million) Forecast by Region, 2020-2035
  • Table 2: Global Market Volume (Units) Forecast by Region, 2020-2035
  • Table 3: Global Market Value (USD Million) Forecast by Product Type, 2020-2035
  • Table 4: Global Market Volume (Units) Forecast by Product Type, 2020-2035
  • Table 5: Global Market Value (USD Million) Forecast by Material Type, 2020-2035
  • Table 6: Global Market Volume (Units) Forecast by Material Type, 2020-2035
  • Table 7: Global Market Value (USD Million) Forecast by End-Use Application, 2020-2035
  • Table 8: Global Market Volume (Units) Forecast by End-Use Application, 2020-2035
  • Table 9: North America Market Value (USD Million) Forecast by Country, 2020-2035
  • Table 10: North America Market Volume (Units) Forecast by Country, 2020-2035
  • Table 11: North America Market Value (USD Million) Forecast by Product Type, 2020-2035
  • Table 12: North America Market Volume (Units) Forecast by Product Type, 2020-2035
  • Table 13: North America Market Value (USD Million) Forecast by Material Type, 2020-2035
  • Table 14: North America Market Volume (Units) Forecast by Material Type, 2020-2035
  • Table 15: North America Market Value (USD Million) Forecast by End-Use Application, 2020-2035
  • Table 16: North America Market Volume (Units) Forecast by End-Use Application, 2020-2035
  • Table 17: Latin America Market Value (USD Million) Forecast by Country, 2020-2035
  • Table 18: Latin America Market Volume (Units) Forecast by Country, 2020-2035
  • Table 19: Latin America Market Value (USD Million) Forecast by Product Type, 2020-2035
  • Table 20: Latin America Market Volume (Units) Forecast by Product Type, 2020-2035
  • Table 21: Latin America Market Value (USD Million) Forecast by Material Type, 2020-2035
  • Table 22: Latin America Market Volume (Units) Forecast by Material Type, 2020-2035
  • Table 23: Latin America Market Value (USD Million) Forecast by End-Use Application, 2020-2035
  • Table 24: Latin America Market Volume (Units) Forecast by End-Use Application, 2020-2035
  • Table 25: Europe Market Value (USD Million) Forecast by Country, 2020-2035
  • Table 26: Europe Market Volume (Units) Forecast by Country, 2020-2035
  • Table 27: Europe Market Value (USD Million) Forecast by Product Type, 2020-2035
  • Table 28: Europe Market Volume (Units) Forecast by Product Type, 2020-2035
  • Table 29: Europe Market Value (USD Million) Forecast by Material Type, 2020-2035
  • Table 30: Europe Market Volume (Units) Forecast by Material Type, 2020-2035
  • Table 31: Europe Market Value (USD Million) Forecast by End-Use Application, 2020-2035
  • Table 32: Europe Market Volume (Units) Forecast by End-Use Application, 2020-2035
  • Table 33: East Asia Market Value (USD Million) Forecast by Country, 2020-2035
  • Table 34: East Asia Market Volume (Units) Forecast by Country, 2020-2035
  • Table 35: East Asia Market Value (USD Million) Forecast by Product Type, 2020-2035
  • Table 36: East Asia Market Volume (Units) Forecast by Product Type, 2020-2035
  • Table 37: East Asia Market Value (USD Million) Forecast by Material Type, 2020-2035
  • Table 38: East Asia Market Volume (Units) Forecast by Material Type, 2020-2035
  • Table 39: East Asia Market Value (USD Million) Forecast by End-Use Application, 2020-2035
  • Table 40: East Asia Market Volume (Units) Forecast by End-Use Application, 2020-2035
  • Table 41: South Asia Market Value (USD Million) Forecast by Country, 2020-2035
  • Table 42: South Asia Market Volume (Units) Forecast by Country, 2020-2035
  • Table 43: South Asia Market Value (USD Million) Forecast by Product Type, 2020-2035
  • Table 44: South Asia Market Volume (Units) Forecast by Product Type, 2020-2035
  • Table 45: South Asia Market Value (USD Million) Forecast by Material Type, 2020-2035
  • Table 46: South Asia Market Volume (Units) Forecast by Material Type, 2020-2035
  • Table 47: South Asia Market Value (USD Million) Forecast by End-Use Application, 2020-2035
  • Table 48: South Asia Market Volume (Units) Forecast by End-Use Application, 2020-2035
  • Table 49: Oceania Market Value (USD Million) Forecast by Country, 2020-2035
  • Table 50: Oceania Market Volume (Units) Forecast by Country, 2020-2035
  • Table 51: Oceania Market Value (USD Million) Forecast by Product Type, 2020-2035
  • Table 52: Oceania Market Volume (Units) Forecast by Product Type, 2020-2035
  • Table 53: Oceania Market Value (USD Million) Forecast by Material Type, 2020-2035
  • Table 54: Oceania Market Volume (Units) Forecast by Material Type, 2020-2035
  • Table 55: Oceania Market Value (USD Million) Forecast by End-Use Application, 2020-2035
  • Table 56: Oceania Market Volume (Units) Forecast by End-Use Application, 2020-2035
  • Table 57: MEA Market Value (USD Million) Forecast by Country, 2020-2035
  • Table 58: MEA Market Volume (Units) Forecast by Country, 2020-2035
  • Table 59: MEA Market Value (USD Million) Forecast by Product Type, 2020-2035
  • Table 60: MEA Market Volume (Units) Forecast by Product Type, 2020-2035
  • Table 61: MEA Market Value (USD Million) Forecast by Material Type, 2020-2035
  • Table 62: MEA Market Volume (Units) Forecast by Material Type, 2020-2035
  • Table 63: MEA Market Value (USD Million) Forecast by End-Use Application, 2020-2035
  • Table 64: MEA Market Volume (Units) Forecast by End-Use Application, 2020-2035

List of Figures

  • Figure 1: Global Market Volume (Units) Forecast 2020-2035
  • Figure 2: Global Market Pricing Analysis
  • Figure 3: Global Market Value (USD Million) Forecast 2020-2035
  • Figure 4: Global Market Value Share and BPS Analysis by Product Type, 2025 and 2035
  • Figure 5: Global Market Y-o-Y Growth Comparison by Product Type, 2025-2035
  • Figure 6: Global Market Attractiveness Analysis by Product Type
  • Figure 7: Global Market Value Share and BPS Analysis by Material Type, 2025 and 2035
  • Figure 8: Global Market Y-o-Y Growth Comparison by Material Type, 2025-2035
  • Figure 9: Global Market Attractiveness Analysis by Material Type
  • Figure 10: Global Market Value Share and BPS Analysis by End-Use Application, 2025 and 2035
  • Figure 11: Global Market Y-o-Y Growth Comparison by End-Use Application, 2025-2035
  • Figure 12: Global Market Attractiveness Analysis by End-Use Application
  • Figure 13: Global Market Value (USD Million) Share and BPS Analysis by Region, 2025 and 2035
  • Figure 14: Global Market Y-o-Y Growth Comparison by Region, 2025-2035
  • Figure 15: Global Market Attractiveness Analysis by Region
  • Figure 16: North America Market Incremental $ Opportunity, 2025-2035
  • Figure 17: Latin America Market Incremental $ Opportunity, 2025-2035
  • Figure 18: Europe Market Incremental $ Opportunity, 2025-2035
  • Figure 19: East Asia Market Incremental $ Opportunity, 2025-2035
  • Figure 20: South Asia Market Incremental $ Opportunity, 2025-2035
  • Figure 21: Oceania Market Incremental $ Opportunity, 2025-2035
  • Figure 22: MEA Market Incremental $ Opportunity, 2025-2035
  • Figure 23: North America Market Value Share and BPS Analysis by Country, 2025 and 2035
  • Figure 24: North America Market Value Share and BPS Analysis by Product Type, 2025 and 2035
  • Figure 25: North America Market Y-o-Y Growth Comparison by Product Type, 2025-2035
  • Figure 26: North America Market Attractiveness Analysis by Product Type
  • Figure 27: North America Market Value Share and BPS Analysis by Material Type, 2025 and 2035
  • Figure 28: North America Market Y-o-Y Growth Comparison by Material Type, 2025-2035
  • Figure 29: North America Market Attractiveness Analysis by Material Type
  • Figure 30: North America Market Value Share and BPS Analysis by End-Use Application, 2025 and 2035
  • Figure 31: North America Market Y-o-Y Growth Comparison by End-Use Application, 2025-2035
  • Figure 32: North America Market Attractiveness Analysis by End-Use Application
  • Figure 33: Latin America Market Value Share and BPS Analysis by Country, 2025 and 2035
  • Figure 34: Latin America Market Value Share and BPS Analysis by Product Type, 2025 and 2035
  • Figure 35: Latin America Market Y-o-Y Growth Comparison by Product Type, 2025-2035
  • Figure 36: Latin America Market Attractiveness Analysis by Product Type
  • Figure 37: Latin America Market Value Share and BPS Analysis by Material Type, 2025 and 2035
  • Figure 38: Latin America Market Y-o-Y Growth Comparison by Material Type, 2025-2035
  • Figure 39: Latin America Market Attractiveness Analysis by Material Type
  • Figure 40: Latin America Market Value Share and BPS Analysis by End-Use Application, 2025 and 2035
  • Figure 41: Latin America Market Y-o-Y Growth Comparison by End-Use Application, 2025-2035
  • Figure 42: Latin America Market Attractiveness Analysis by End-Use Application
  • Figure 43: Europe Market Value Share and BPS Analysis by Country, 2025 and 2035
  • Figure 44: Europe Market Value Share and BPS Analysis by Product Type, 2025 and 2035
  • Figure 45: Europe Market Y-o-Y Growth Comparison by Product Type, 2025-2035
  • Figure 46: Europe Market Attractiveness Analysis by Product Type
  • Figure 47: Europe Market Value Share and BPS Analysis by Material Type, 2025 and 2035
  • Figure 48: Europe Market Y-o-Y Growth Comparison by Material Type, 2025-2035
  • Figure 49: Europe Market Attractiveness Analysis by Material Type
  • Figure 50: Europe Market Value Share and BPS Analysis by End-Use Application, 2025 and 2035
  • Figure 51: Europe Market Y-o-Y Growth Comparison by End-Use Application, 2025-2035
  • Figure 52: Europe Market Attractiveness Analysis by End-Use Application
  • Figure 53: East Asia Market Value Share and BPS Analysis by Country, 2025 and 2035
  • Figure 54: East Asia Market Value Share and BPS Analysis by Product Type, 2025 and 2035
  • Figure 55: East Asia Market Y-o-Y Growth Comparison by Product Type, 2025-2035
  • Figure 56: East Asia Market Attractiveness Analysis by Product Type
  • Figure 57: East Asia Market Value Share and BPS Analysis by Material Type, 2025 and 2035
  • Figure 58: East Asia Market Y-o-Y Growth Comparison by Material Type, 2025-2035
  • Figure 59: East Asia Market Attractiveness Analysis by Material Type
  • Figure 60: East Asia Market Value Share and BPS Analysis by End-Use Application, 2025 and 2035
  • Figure 61: East Asia Market Y-o-Y Growth Comparison by End-Use Application, 2025-2035
  • Figure 62: East Asia Market Attractiveness Analysis by End-Use Application
  • Figure 63: South Asia Market Value Share and BPS Analysis by Country, 2025 and 2035
  • Figure 64: South Asia Market Value Share and BPS Analysis by Product Type, 2025 and 2035
  • Figure 65: South Asia Market Y-o-Y Growth Comparison by Product Type, 2025-2035
  • Figure 66: South Asia Market Attractiveness Analysis by Product Type
  • Figure 67: South Asia Market Value Share and BPS Analysis by Material Type, 2025 and 2035
  • Figure 68: South Asia Market Y-o-Y Growth Comparison by Material Type, 2025-2035
  • Figure 69: South Asia Market Attractiveness Analysis by Material Type
  • Figure 70: South Asia Market Value Share and BPS Analysis by End-Use Application, 2025 and 2035
  • Figure 71: South Asia Market Y-o-Y Growth Comparison by End-Use Application, 2025-2035
  • Figure 72: South Asia Market Attractiveness Analysis by End-Use Application
  • Figure 73: Oceania Market Value Share and BPS Analysis by Country, 2025 and 2035
  • Figure 74: Oceania Market Value Share and BPS Analysis by Product Type, 2025 and 2035
  • Figure 75: Oceania Market Y-o-Y Growth Comparison by Product Type, 2025-2035
  • Figure 76: Oceania Market Attractiveness Analysis by Product Type
  • Figure 77: Oceania Market Value Share and BPS Analysis by Material Type, 2025 and 2035
  • Figure 78: Oceania Market Y-o-Y Growth Comparison by Material Type, 2025-2035
  • Figure 79: Oceania Market Attractiveness Analysis by Material Type
  • Figure 80: Oceania Market Value Share and BPS Analysis by End-Use Application, 2025 and 2035
  • Figure 81: Oceania Market Y-o-Y Growth Comparison by End-Use Application, 2025-2035
  • Figure 82: Oceania Market Attractiveness Analysis by End-Use Application
  • Figure 83: MEA Market Value Share and BPS Analysis by Country, 2025 and 2035
  • Figure 84: MEA Market Value Share and BPS Analysis by Product Type, 2025 and 2035
  • Figure 85: MEA Market Y-o-Y Growth Comparison by Product Type, 2025-2035
  • Figure 86: MEA Market Attractiveness Analysis by Product Type
  • Figure 87: MEA Market Value Share and BPS Analysis by Material Type, 2025 and 2035
  • Figure 88: MEA Market Y-o-Y Growth Comparison by Material Type, 2025-2035
  • Figure 89: MEA Market Attractiveness Analysis by Material Type
  • Figure 90: MEA Market Value Share and BPS Analysis by End-Use Application, 2025 and 2035
  • Figure 91: MEA Market Y-o-Y Growth Comparison by End-Use Application, 2025-2035
  • Figure 92: MEA Market Attractiveness Analysis by End-Use Application
  • Figure 93: Global Market - Tier Structure Analysis
  • Figure 94: Global Market - Company Share Analysis

Frequently Asked Questions

What was the overall size of the IV infusion bottle seals & caps market in 2025?

The overall market size for IV infusion bottle seals & caps market was USD 177.6 Million in 2025.

How big is the IV infusion bottle seals & caps market expected in 2035?

The IV infusion bottle seals & caps market is expected to reach USD 303.4 Million in 2035.

What will drive the demand for IV infusion bottle seals & caps market during the forecast period?

The rising demand for advanced and safe packaging solutions in the pharmaceutical and healthcare industries fuels IV infusion bottle seals & caps Market during the forecast period.

List the top 5 countries contributing in IV infusion bottle seals & caps market?

The top 5 countries which drives the development of IV infusion bottle seals & caps Market are USA, UK, Europe Union, Japan and South Korea.

Which is the leading segment in the IV infusion bottle seals & caps market?

On the basis of product, PP Caps to command significant share over the forecast period.

Explore Similar Insights

Future Market Insights

IV Infusion Bottle Seals & Caps Market