IV Disposables Market Snapshot

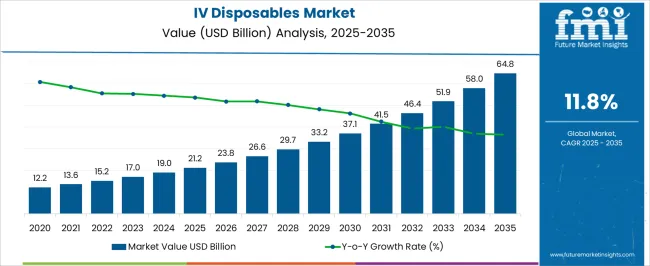
According to Future Market Insights research, during the projected period, the global IV disposables market is expected to grow at a CAGR of 11.8%. The market value is projected to increase from US$ 17.0 Billion in 2023 to US$ 51.6 Billion by 2033. The IV disposables market was valued at US$ 15.5 Billion at the end of 2022 and is anticipated to exhibit Y-o-Y growth of 9.6% in 2023.

Market Outlook:

Data Points Market Insights
Market Value 2022 US$ 15.5 Billion
Market Value 2023 US$ 17.0 Billion
Market Value 2033 US$ 51.6 Billion
CAGR 2023 to 2033 11.8%
Share of Top 5 Countries 60.4%
Key Players The key players in the IV disposables market are B. Braun Melsungen AG; Baxter; 3M; Terumo Corporation; Nipro Corporation; Teleflex Incorporated; Becton; Dickinson and Company; Smiths Medical/ICU Medical; Moog Inc; AngioDynamics.; Fresenius SE & Co. KgaA; arcomed ag

IV disposables, also known as intravenous disposables, are medical devices and accessories used in intravenous therapy to administer fluids, medications, and other substances directly into a patient's bloodstream. These disposable products are designed for single use and are discarded after each patient to minimize the risk of contamination and infection.

An increasing number of chronic diseases demanding disposable IV therapy products is expected to be a major factor driving the growth of the global disposable IV therapy products market over the forecast period.

  • According to the Centers for Disease Control and Prevention (CDC), chronic diseases would be the leading cause of mortality in the country in 2022, accounting for 7 out of every 10 fatalities.

Overall, the increasing number of chronic diseases due to several factors is likely to boost the market in the coming years.

Don't pay for what you don't need

Customize your report by selecting specific countries or regions and save 30%!

Sales Analysis of IV Disposables Market from 2018 to 2022 Vs Market Outlook for 2023 to 2033

Sales of the IV disposables market grew at a CAGR of 8.6% between 2018 to 2022. IV disposables market contributes 11.5% revenue share to the global medical supplies market which is valued around US$ 134.2 Billion 2022.

The demand for IV disposables has been steadily increasing due to factors such as the rising prevalence of chronic diseases, an aging population, and the expansion of healthcare infrastructure.

Diabetes is one of the leading cause of kidney failure, lower-limb amputations, and new cases of impaired vision among adults. Moreover, health risks by the dearth of exercise, high alcohol and tobacco consumption, and poor nutrition cause much illness and early death due to chronic diseases.

  • For instance, the Centers for Disease Control and Prevention (CDC) reported in 2021 that roughly 12 out of every 100 Americans aged 18 or older (11.5%) were current smokers. This indicates that there are currently an estimated 28.3 million adult smokers in the US. More than 16 million Americans are affected by a condition brought on by smoking.

The market is expected to continue growing during the forecast period. Factors such as the increasing prevalence of chronic diseases, ongoing advancements in medical technology, and the expansion of healthcare services in developing regions are likely to drive the market's growth.

The COVID-19 pandemic has highlighted the importance of IV therapy in critical care settings, further emphasizing the need for IV disposables. The market is also expected to benefit from the continued focus on infection control and the adoption of advanced healthcare technologies.

Considering this, FMI expects the global market to grow at a CAGR of 11.8% through the forecasted years.

What are the Key Opportunities in the IV Disposables Market?

The demand for IV therapy has increased as the prevalence of chronic diseases like diabetes, cancer, and coronary artery disease has increased. IV disposables are essential for giving patients their fluids, drugs, and nutrition, which opens up new business prospects for providers and manufacturers.

Technological advancements in the intravenous equipment market include smart pumps, wireless and remote monitoring, needle-free ports, closed system transfer devices, portable intravenous devices, and nanotechnology. These advances have the potential to improve the safety, effectiveness, and efficiency of intravenous therapy and create new opportunities for manufacturers in this market.

There is a growing demand for smart pumps, a type of infusion pumps, that use advanced software algorithms to improve the accuracy and safety of intravenous drug administration. They can detect potential errors, such as incorrect dosages or administration rates, and alert healthcare professionals. These factors can open up several opportunities in the intravenous equipment market.

Sabyasachi Ghosh
Sabyasachi Ghosh

Principal Consultant

Talk to Analyst

Find your sweet spots for generating winning opportunities in this market.

Which Factors Could Possibly Restrain the Growth of the IV Disposables Market?

The high cost of intravenous equipment can limit their acceptability in some healthcare settings, especially those with limited budgets. Healthcare providers may opt for lower-cost alternatives, such as oral medications or subcutaneous injections, which may limit the growth of the intravenous equipment market. Healthcare providers may face lower profit margins due to the high cost of intravenous equipment, which may limit their willingness to invest in new equipment or expand their services.

Product recalls can affect the intravenous equipment market in the United States by damaging brand reputation, reducing revenue, increasing regulatory scrutiny, raising patient safety concerns, and increasing litigation costs. Product recalls can raise patient safety concerns and limit the adoption of intravenous equipment by healthcare providers. This may impact the overall growth of the intravenous equipment market.

Some of the factors that can increase demand for alternative therapies include reducing demand, limiting cost-effectiveness, patient preference, limiting investment in innovation and research, and regulatory challenges. Alternative therapies may be more cost-effective for healthcare providers and insurance companies because they require less equipment and human resources. This may limit the adoption of intravenous equipment and affect the overall growth of the market.

These factors are expected to hamper the revenue growth of the market over the forecast period.
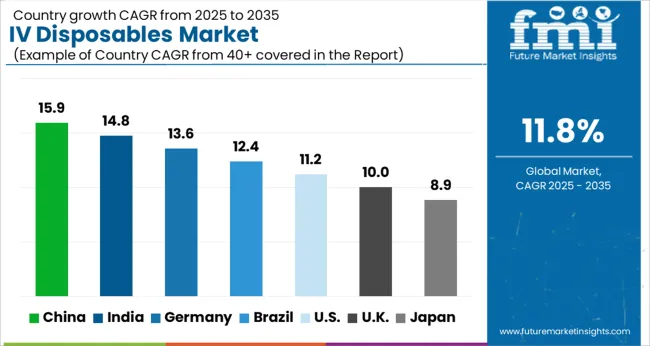
Country-wise Insights

What Makes the USA the Dominating Country in the IV Disposables Market?

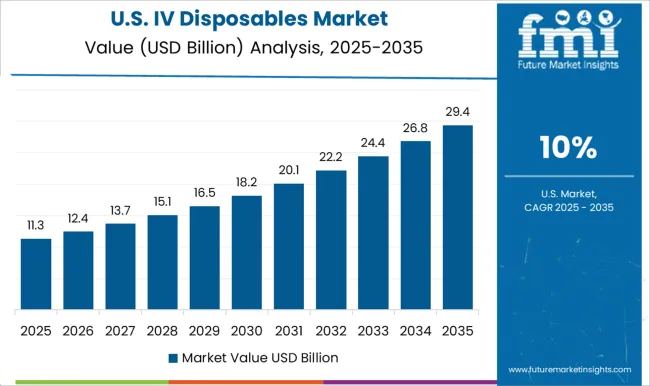
The USA market is expected to register a CAGR of 10.3% during the forecast period.

The demand for IV disposables in the USA is driven by factors such as the aging population, the need for improved patient care and safety, the expansion of healthcare infrastructure, and the growing focus on infection control.

The USA market is highly competitive, with several prominent companies operating in the industry. These companies compete based on factors such as product innovation, pricing strategies, distribution networks, and relationships with healthcare providers, which will drive the expansion of the market.
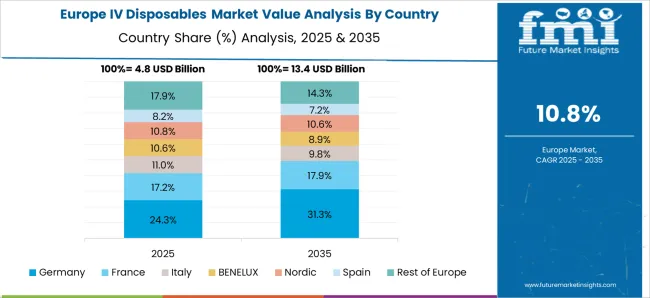
Why Germany is considered a Lucrative Segment for Market in Europe?

Germany dominated the European market for IV disposables and accounted for around 29.8% of the market share in 2022.

Germany has a robust healthcare infrastructure with a well-established network of hospitals, clinics, and healthcare facilities. The country is known for its high-quality healthcare services and advanced medical technology. This infrastructure creates a favorable environment for the adoption and utilization of IV disposables, driving market growth.

Germany is a lucrative segment of the market in Europe. The strong healthcare infrastructure, technological advancements, aging population, stringent regulations, reimbursement system, medical tourism, and emphasis on research and development create a favorable market landscape for IV disposable manufacturers and suppliers.

What Makes China an Emerging Market for IV Disposables?

China is projected to be the most attractive market in IV disposables and is expected to grow over a significant CAGR of 11.8%.

The market in China is expected to grow significantly in the coming years due to several factors. China has been increasing its healthcare expenditure in recent years, with a focus on improving healthcare infrastructure and services. This increased investment in the healthcare sector is expected to drive the demand for IV disposables as the country seeks to enhance patient care and treatment outcomes.

Another factor contributing to the growth of the market in China is the prevalence of chronic diseases such as cardiovascular diseases, diabetes, and cancer is on the rise in China, primarily due to factors like an ageing population, sedentary lifestyles, and changing dietary patterns. IV therapy is often necessary for the management and treatment of these chronic conditions, leading to an increased demand for IV disposables.

Get the data you need at a Fraction of the cost

Personalize your report by choosing insights you need
and save 40%!

Category-wise Insights

Why Product Is the Largely Adopted Treatment Option?

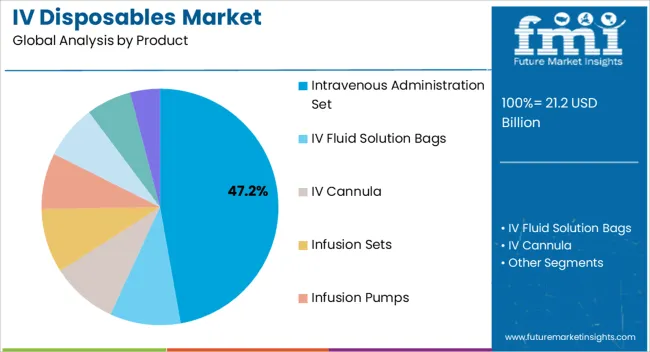
The infusion pumps segment held the major chunk of about 48.1% of the global market by the end of 2022.

Infusion pumps offer precise and controlled administration of fluids, medications, and nutrition to patients. They are designed to deliver these substances at specific rates and volumes, ensuring accuracy and consistency in dosage. This level of precision is critical in many medical scenarios, such as critical care, chemotherapy, and pain management.

IV disposables, such as specialized connectors and pressure sensors, are designed to work in conjunction with infusion pumps to ensure the safe and accurate delivery of fluids and medications.

Overall, infusion pumps are a widely adopted treatment option for IV Disposables due to their precise and controlled administration of fluids and medications, enhanced safety features, and compatibility with various IV disposables.

Which End User Dominates the Global Market in 2022?

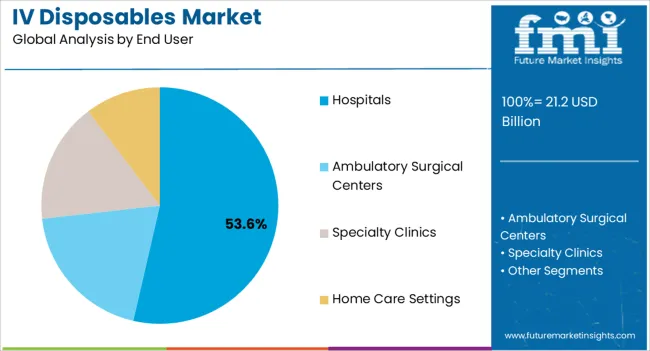
The hospitals accounted for a revenue share of 54.6% in the global market at the end of 2022.

Hospitals typically have a significantly higher volume of patients compared to other healthcare settings such as clinics or ambulatory surgical centers. This higher patient load translates into greater demand for IV therapy, which drives the need for IV disposables. Hospitals often have multiple departments and units that administer IV treatments, including emergency departments, intensive care units, operating rooms, and general wards, further contributing to the demand for IV disposables.

Hospitals primarily provide inpatient services, where patients stay for an extended period during treatment or recovery. In such cases, patients often require continuous or intermittent IV therapy throughout their hospital stay. This continuous demand for IV disposables further solidifies the dominance of hospitals in the IV disposable market.
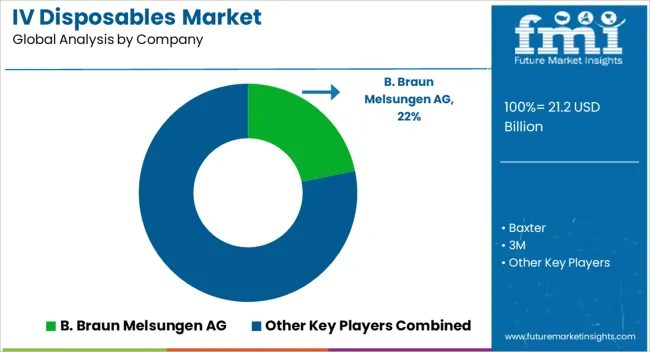
Competitive Landscape

Key players in the market are focused on increasing their product portfolio for strengthening their position in the market and to expand their footprint in emerging markets. The key strategy adopted by manufacturers to gain a competitive edge in the market is pricing strategies, market strategies, technological advancements, and acquisition with other companies to expand their business.

For instance:

  • In July 2021, Becton Dickinson & Company, a preeminent manufacturer and developer of unique resorbable polymer technology, announced that it had purchased Tepha, Inc.
  • In May 2022, Fresenius Kabi completes the acquisition of Ivenix, broadens its offering of infusion therapies, and opens up new avenues for innovation to boost operational effectiveness and improve patient care.

Similarly, recent developments have been tracked by the team at Future Market Insights related to companies in the IV disposables market space, which are available in the full report

Scope of the IV Disposables Market Report

Attribute Details
Forecast Period 2023 to 2033
Historical Data Available for 2018 to 2022
Market Analysis USD Million for Value
Key Regions Covered North America; Latin America; Europe; South Asia; East Asia; Oceania and Middle East & Africa (MEA)
Key Countries Covered USA, Canada, Brazil, Mexico, Argentina, Germany, UK, France, Italy, Spain, Russia, BENELUX, Nordics, China, Japan, South Korea, India, Thailand, Indonesia, Malaysia, Vietnam, Philippines, Australia, New Zealand, Türkiye, South Africa, North Africa and GCC Countries
Key Segments Covered Product, End User, and Region
Key Companies Profiled B. Braun Melsungen AG; Baxter; 3M; Terumo Corporation; Nipro Corporation; Teleflex Incorporated; Becton, Dickinson and Company; Smiths Medical/ICU Medical; Moog Inc; AngioDynamics.; Fresenius SE & Co. KgaA; arcomed ag
Report Coverage Market Forecast, Competition Intelligence, DROT Analysis, Market Dynamics and Challenges, Strategic Growth Initiatives
Customization & Pricing Available upon Request

Key Segments Covered in IV Disposables Market Industry Research

By Product:

  • Intravenous Administration Set
  • IV Fluid Solution Bags
  • IV Cannula
  • Infusion Sets
  • Infusion Pumps
  • Catheter Needles
  • Securement Devices
  • Others (Stopcocks, connectors, Extention Tubes)

By End User:

  • Hospitals
  • Ambulatory Surgical Centers
  • Specialty Clinics
  • Home Care Settings

By Region:

  • North America
  • Latin America
  • Europe
  • South Asia
  • East Asia
  • Oceania
  • Middle East & Africa

Frequently Asked Questions

How Big is the IV Disposables Market?

The market is valued at US$ 17.0 billion in 2023.

Who are the Key IV Disposables Market Players?

B. Braun Melsungen AG, Baxter International Inc., and 3M are key market players.

Which Industry is the Key Consumer of the IV Disposables Market?

The healthcare industry is the key consumer of the IV disposables market.

How Big Will the IV Disposables Market by 2033?

The market is estimated to reach US$ 51.6 billion by 2033.

What is the IV Disposables Market CAGR for 2033?

The IV Disposables Market CAGR for 2033 is 11.8%.

Table of Content

1. Executive Summary

    1.1. Global Market Outlook

    1.2. Demand Side Trends

    1.3. Supply-Side Side Trends

    1.4. Analysis and Recommendations

2. Market Overview

    2.1. Market Coverage / Taxonomy

    2.2. Market Definition / Scope / Limitations

    2.3. Inclusions and Exclusions

3. Key Market Trends

    3.1. Key Trends Impacting the Market

    3.2. Innovation / Development Trends

4. Value-Added Insights

    4.1. Disease Epidemiology

    4.2. Regulatory Scenario

    4.3. Value Chain Analysis

    4.4. Technological Advancements

    4.5. Cost per Infusion Pump

    4.6. PESTLE Analysis

    4.7. Porter’s Analysis

5. Market Background

    5.1. Macro-Economic Factors

        5.1.1. Global GDP Growth Outlook

        5.1.2. Global Healthcare Spending Outlook

        5.1.3. Global Medical Supplies Market Overview

    5.2. Forecast Factors - Relevance & Impact

        5.2.1. Increase in Medical Procedures

        5.2.2. Recent Key Player Activities

        5.2.3. Rise in Life Expectancy

        5.2.4. Increasing use of Infusion Pumps in Healthcare Settings and Home use

        5.2.5. Global Vaccination Programs

        5.2.6. Rising Acute and Chronic Cases

        5.2.7. Increased Training Programs

        5.2.8. GDP Growth

        5.2.9. Increase in Number of Companies with Sole Focus on Providing High-Quality IV Tubing

        5.2.10. Impact of Covid-19 on Sales

    5.3. Market Dynamics

        5.3.1. Drivers

        5.3.2. Restraints

        5.3.3. Opportunity Analysis

6. COVID-19 Crisis Analysis

    6.1. COVID-19 and Impact Analysis

        6.1.1. By Product

        6.1.2. By End User

        6.1.3. By Country

    6.2. 2022 Market Scenario

7. Global Market Demand Volume (Units) Analysis 2018 to 2022 and Forecast, 2023 to 2033

    7.1. Historical Market Volume (Units) Analysis, 2018 to 2022

    7.2. Current and Future Market Volume (Units) Projections, 2023 to 2033

        7.2.1. Y-o-Y Growth Trend Analysis

8. Global Market Demand Pricing Analysis 2018 to 2022 and Forecast, 2023 to 2033

    8.1. Regional Pricing Analysis

    8.2. Pricing Break-up

        8.2.1. Manufacturer-Level Pricing

        8.2.2. Distributor Level Pricing

    8.3. Global Average Pricing Analysis Benchmark

    8.4. Pricing Assumptions

9. Global Market Demand (in Value or Size in US$ Mn) Analysis 2018 to 2022 and Forecast, 2023 to 2033

    9.1. Historical Market Value (US$ Million) Analysis 2018 to 2022

    9.2. Current and Future Market Value (US$ Million) Projections, 2023 to 2033

        9.2.1. Y-o-Y Growth Trend Analysis

        9.2.2. Absolute $ Opportunity Analysis

    9.3. Revenue Opportunity Scenario

10. Global Market Analysis 2018 to 2022 and Forecast 2023 to 2033, By Product

    10.1. Introduction / Key Findings

    10.2. Historical Market Size (US$ Million) & Volume (Units) Analysis By Product, 2018 to 2022

    10.3. Current and Future Market Size (US$ Million) & Volume (Units) Analysis and Forecast, By Product, 2023 to 2033

        10.3.1. Intravenous Administration Set

        10.3.2. IV Fluid Solution Bags

        10.3.3. IV Cannula

        10.3.4. Infusion Sets

        10.3.5. Infusion Pumps

        10.3.6. Catheter Needles

        10.3.7. Securement Devices

        10.3.8. Others (Stopcocks, connectors, Extention Tubes)

    10.4. Market Attractiveness Analysis By Product

11. Global Market Analysis 2018 to 2022 and Forecast 2023 to 2033, By End User

    11.1. Introduction

    11.2. Historical Market Size (US$ Million) Analysis By End User, 2018 to 2022

    11.3. Current and Future Market Size (US$ Million) Analysis and Forecast By End User, 2023 to 2033

        11.3.1. Hospitals

        11.3.2. Ambulatory Surgical Centers

        11.3.3. Specialty Clinics

        11.3.4. Home Care Settings

    11.4. Market Attractiveness Analysis By End User

12. Global Market Analysis 2018 to 2022 and Forecast 2023 to 2033, By Region

    12.1. Introduction

    12.2. Historical Market Size (US$ Million) & Volume (Units) Analysis By Region, 2018 to 2022

    12.3. Current and Future Market Size (US$ Million) & Volume (Units) Analysis and Forecast, By Region, 2023 to 2033

        12.3.1. North America

        12.3.2. Latin America

        12.3.3. Europe

        12.3.4. South Asia

        12.3.5. East Asia

        12.3.6. Oceania

        12.3.7. Middle East & Africa

    12.4. Market Attractiveness Analysis By Region

13. North America Market Analysis 2018 to 2022 and Forecast 2023 to 2033

    13.1. Introduction

    13.2. Historical Market Size (US$ Million) & Volume (Units) Analysis, By Market Taxonomy 2018 to 2022

    13.3. Current and Future Market Size (US$ Million) & Volume (Units) Analysis and Forecast, By Market Taxonomy, 2023 to 2033

        13.3.1. By Country

            13.3.1.1. USA

            13.3.1.2. Canada

        13.3.2. By Product

        13.3.3. By End User

    13.4. Market Attractiveness Analysis

        13.4.1. By Country

        13.4.2. By Product

        13.4.3. By End User

    13.5. Market Trends

    13.6. Key Market Participants - Intensity Mapping

    13.7. Drivers and Restraints - Impact Analysis

    13.8. Country-Level Analysis & Forecast

        13.8.1. USA Market

            13.8.1.1. Introduction

            13.8.1.2. Market Analysis and Forecast by Market Taxonomy

                13.8.1.2.1. By Product

                13.8.1.2.2. By End User

        13.8.2. Canada Market

        13.8.3. Introduction

        13.8.4. Market Analysis and Forecast by Market Taxonomy

                13.8.4.1.1. By Product

                13.8.4.1.2. By End User

14. Latin America Market Analysis 2018 to 2022 and Forecast 2023 to 2033

    14.1. Introduction

    14.2. Historical Market Size (US$ Million) & Volume (Units) Analysis, By Market Taxonomy 2018 to 2022

    14.3. Current and Future Market Size (US$ Million) & Volume (Units) Analysis and Forecast, By Market Taxonomy, 2023 to 2033

        14.3.1. By Country

            14.3.1.1. Brazil

            14.3.1.2. Mexico

            14.3.1.3. Argentina

            14.3.1.4. Rest of Latin America

        14.3.2. By Product

        14.3.3. By End User

    14.4. Market Attractiveness Analysis

        14.4.1. By Country

        14.4.2. By Product

        14.4.3. By End User

    14.5. Market Trends

    14.6. Key Market Participants - Intensity Mapping

    14.7. Drivers and Restraints - Impact Analysis

    14.8. Country-Level Analysis & Forecast

        14.8.1. Brazil Market

            14.8.1.1. Introduction

            14.8.1.2. Market Analysis and Forecast by Market Taxonomy

                14.8.1.2.1. By Product

                14.8.1.2.2. By End User

        14.8.2. Mexico Market

            14.8.2.1. Introduction

            14.8.2.2. Market Analysis and Forecast by Market Taxonomy

                14.8.2.2.1. By Product

                14.8.2.2.2. By End User

        14.8.3. Argentina Market

        14.8.4. Introduction

        14.8.5. Market Analysis and Forecast by Market Taxonomy

                14.8.5.1.1. By Product

                14.8.5.1.2. By End User

15. Europe Market Analysis 2018 to 2022 and Forecast 2023 to 2033

    15.1. Introduction

    15.2. Historical Market Size (US$ Million) & Volume (Units) Analysis, By Market Taxonomy 2018 to 2022

    15.3. Current and Future Market Size (US$ Million) & Volume (Units) Analysis and Forecast, By Market Taxonomy, 2023 to 2033

        15.3.1. By Country

            15.3.1.1. Germany

            15.3.1.2. Italy

            15.3.1.3. France

            15.3.1.4. UK

            15.3.1.5. Spain

            15.3.1.6. BENELUX

            15.3.1.7. Russia

            15.3.1.8. Nordic Countries

            15.3.1.9. Rest of Europe

        15.3.2. By Product

        15.3.3. By End User

    15.4. Market Attractiveness Analysis

        15.4.1. By Country

        15.4.2. By Product

        15.4.3. By End User

    15.5. Market Trends

    15.6. Key Market Participants - Intensity Mapping

    15.7. Drivers and Restraints - Impact Analysis

    15.8. Country-Level Analysis & Forecast

        15.8.1. Germany Market

            15.8.1.1. Introduction

            15.8.1.2. Market Analysis and Forecast by Market Taxonomy

                15.8.1.2.1. By Product

                15.8.1.2.2. By End User

        15.8.2. Italy Market

            15.8.2.1. Introduction

            15.8.2.2. Market Analysis and Forecast by Market Taxonomy

                15.8.2.2.1. By Product

                15.8.2.2.2. By End User

        15.8.3. France Market

            15.8.3.1. Introduction

            15.8.3.2. Market Analysis and Forecast by Market Taxonomy

                15.8.3.2.1. By Product

                15.8.3.2.2. By End User

        15.8.4. UK Market

            15.8.4.1. Introduction

            15.8.4.2. Market Analysis and Forecast by Market Taxonomy

                15.8.4.2.1. By Product

                15.8.4.2.2. By End User

        15.8.5. Spain Market

            15.8.5.1. Introduction

            15.8.5.2. Market Analysis and Forecast by Market Taxonomy

                15.8.5.2.1. By Product

                15.8.5.2.2. By End User

        15.8.6. BENELUX Market

            15.8.6.1. Introduction

            15.8.6.2. Market Analysis and Forecast by Market Taxonomy

                15.8.6.2.1. By Product

                15.8.6.2.2. By End User

        15.8.7. Russia Market

            15.8.7.1. Introduction

            15.8.7.2. Market Analysis and Forecast by Market Taxonomy

                15.8.7.2.1. By Product

                15.8.7.2.2. By End User

        15.8.8. Nordic Countries Market

            15.8.8.1. Introduction

            15.8.8.2. Market Analysis and Forecast by Market Taxonomy

                15.8.8.2.1. By Product

                15.8.8.2.2. By End User

16. East Asia Market Analysis 2018 to 2022 and Forecast 2023 to 2033

    16.1. Introduction

    16.2. Historical Market Size (US$ Million) & Volume (Units) Analysis, By Market Taxonomy 2018 to 2022

    16.3. Current and Future Market Size (US$ Million) & Volume (Units) Analysis and Forecast, By Market Taxonomy, 2023 to 2033

        16.3.1. By Country

            16.3.1.1. China

            16.3.1.2. Japan

            16.3.1.3. South Korea

        16.3.2. By Product

        16.3.3. By End User

    16.4. Market Attractiveness Analysis

        16.4.1. By Country

        16.4.2. By Product

        16.4.3. By End User

    16.5. Market Trends

    16.6. Key Market Participants - Intensity Mapping

    16.7. Drivers and Restraints - Impact Analysis

    16.8. Country-Level Analysis & Forecast

        16.8.1. China Market

            16.8.1.1. Introduction

            16.8.1.2. Market Analysis and Forecast by Market Taxonomy

                16.8.1.2.1. By Product

                16.8.1.2.2. By End User

        16.8.2. Japan Market

            16.8.2.1. Introduction

            16.8.2.2. Market Analysis and Forecast by Market Taxonomy

                16.8.2.2.1. By Product

                16.8.2.2.2. By End User

        16.8.3. South Korea Market

            16.8.3.1. Introduction

            16.8.3.2. Market Analysis and Forecast by Market Taxonomy

                16.8.3.2.1. By Product

                16.8.3.2.2. By End User

17. South Asia Market Analysis 2018 to 2022 and Forecast 2023 to 2033

    17.1. Introduction

    17.2. Historical Market Size (US$ Million) & Volume (Units) Analysis, By Market Taxonomy 2018 to 2022

    17.3. Current and Future Market Size (US$ Million) & Volume (Units) Analysis and Forecast, By Market Taxonomy, 2023 to 2033

        17.3.1. By Country

            17.3.1.1. India

            17.3.1.2. Malaysia

            17.3.1.3. Thailand

            17.3.1.4. Indonesia

            17.3.1.5. Philippines

            17.3.1.6. Vietnam

            17.3.1.7. Rest of South Africa

        17.3.2. By Product

        17.3.3. By End User

    17.4. Market Attractiveness Analysis

        17.4.1. By Country

        17.4.2. By Product

        17.4.3. By End User

    17.5. Market Trends

    17.6. Key Market Participants - Intensity Mapping

    17.7. Drivers and Restraints - Impact Analysis

    17.8. Country-Level Analysis & Forecast

        17.8.1. India Market

            17.8.1.1. Introduction

            17.8.1.2. Market Analysis and Forecast by Market Taxonomy

                17.8.1.2.1. By Product

                17.8.1.2.2. By End User

        17.8.2. Indonesia Market

            17.8.2.1. Introduction

            17.8.2.2. Market Analysis and Forecast by Market Taxonomy

                17.8.2.2.1. By Product

                17.8.2.2.2. By End User

        17.8.3. Malaysia Treatment Market

            17.8.3.1. Introduction

            17.8.3.2. Market Analysis and Forecast by Market Taxonomy

                17.8.3.2.1. By Product

                17.8.3.2.2. By End User

        17.8.4. Thailand Market

            17.8.4.1. Introduction

            17.8.4.2. Market Analysis and Forecast by Market Taxonomy

                17.8.4.2.1. By Product

                17.8.4.2.2. By End User

        17.8.5. Philippines Market

            17.8.5.1. Introduction

            17.8.5.2. Market Analysis and Forecast by Market Taxonomy

                17.8.5.2.1. By Product

                17.8.5.2.2. By End User

        17.8.6. Vietnam Market

            17.8.6.1. Introduction

            17.8.6.2. Market Analysis and Forecast by Market Taxonomy

                17.8.6.2.1. By Product

                17.8.6.2.2. By End User

18. Oceania Market Analysis 2018 to 2022 and Forecast 2023 to 2033

    18.1. Introduction

    18.2. Historical Market Size (US$ Million) & Volume (Units) Analysis, By Market Taxonomy 2018 to 2022

    18.3. Current and Future Market Size (US$ Million) & Volume (Units) Analysis and Forecast, By Market Taxonomy, 2023 to 2033

        18.3.1. By Country

            18.3.1.1. Australia

            18.3.1.2. New Zealand

        18.3.2. By Product

        18.3.3. By End User

    18.4. Market Attractiveness Analysis

        18.4.1. By Country

        18.4.2. By Product

        18.4.3. By End User

    18.5. Market Trends

    18.6. Key Market Participants - Intensity Mapping

    18.7. Drivers and Restraints - Impact Analysis

    18.8. Country-Level Analysis & Forecast

        18.8.1. Australia Treatment Market

            18.8.1.1. Introduction

            18.8.1.2. Market Analysis and Forecast by Market Taxonomy

                18.8.1.2.1. By Product

                18.8.1.2.2. By End User

        18.8.2. New Zealand Treatment Market

            18.8.2.1. Introduction

            18.8.2.2. Market Analysis and Forecast by Market Taxonomy

                18.8.2.2.1. By Product

                18.8.2.2.2. By End User

19. Middle East and Africa Market Analysis 2018 to 2022 and Forecast 2023 to 2033

    19.1. Introduction

    19.2. Historical Market Size (US$ Million) & Volume (Units) Analysis, By Market Taxonomy 2018 to 2022

    19.3. Current and Future Market Size (US$ Million) & Volume (Units) Analysis and Forecast, By Market Taxonomy, 2023 to 2033

        19.3.1. By Country

            19.3.1.1. GCC Countries

            19.3.1.2. Türkiye

            19.3.1.3. South Africa

            19.3.1.4. North Africa

            19.3.1.5. Rest of Middle East and Africa

        19.3.2. By Product

        19.3.3. By End User

    19.4. Market Attractiveness Analysis

        19.4.1. By Country

        19.4.2. By Product

        19.4.3. By End User

    19.5. Market Trends

    19.6. Key Market Participants - Intensity Mapping

    19.7. Drivers and Restraints - Impact Analysis

    19.8. Country-Level Analysis & Forecast

        19.8.1. GCC Countries Market

            19.8.1.1. Introduction

            19.8.1.2. Market Analysis and Forecast by Market Taxonomy

                19.8.1.2.1. By Product

                19.8.1.2.2. By End User

        19.8.2. Türkiye Market

            19.8.2.1. Introduction

            19.8.2.2. Market Analysis and Forecast by Market Taxonomy

                19.8.2.2.1. By Product

                19.8.2.2.2. By End User

        19.8.3. Israel Market

            19.8.3.1. Introduction

            19.8.3.2. Market Analysis and Forecast by Market Taxonomy

                19.8.3.2.1. By Product

                19.8.3.2.2. By End User

        19.8.4. South Africa Market

            19.8.4.1. Introduction

            19.8.4.2. Market Analysis and Forecast by Market Taxonomy

                19.8.4.2.1. By Product

                19.8.4.2.2. By End User

        19.8.5. North Africa Market

            19.8.5.1. Introduction

            19.8.5.2. Market Analysis and Forecast by Market Taxonomy

                19.8.5.2.1. By Product

                19.8.5.2.2. By End User

20. Market Structure Analysis

    20.1. Market Analysis by Tier of Companies

    20.2. Market Share Analysis (%) of Top Players

    20.3. Market Presence Analysis

        20.3.1. Regional Footprint of Players

        20.3.2. Channel Foot Print by Players

        20.3.3. Product Foot Print by Players

21. Competition Analysis

    21.1. Competition Dashboard

    21.2. Key Development Analysis

    21.3. Promotional and Branding Strategies by Manufacturers

    21.4. Competition Deep Dive

        21.4.1. B. Braun Melsungen AG

            21.4.1.1. Overview

            21.4.1.2. Product Portfolio

            21.4.1.3. Sales Footprint

            21.4.1.4. Key Financials

            21.4.1.5. SWOT Analysis

            21.4.1.6. Strategy Overview

                21.4.1.6.1. Product Strategy

                21.4.1.6.2. Channel Strategy

                21.4.1.6.3. Marketing Strategy

        21.4.2. Baxter

            21.4.2.1. Overview

            21.4.2.2. Product Portfolio

            21.4.2.3. Sales Footprint

            21.4.2.4. Key Financials

            21.4.2.5. SWOT Analysis

            21.4.2.6. Strategy Overview

                21.4.2.6.1. Product Strategy

                21.4.2.6.2. Channel Strategy

                21.4.2.6.3. Marketing Strategy

        21.4.3. 3M

            21.4.3.1. Overview

            21.4.3.2. Product Portfolio

            21.4.3.3. Sales Footprint

            21.4.3.4. Key Financials

            21.4.3.5. SWOT Analysis

            21.4.3.6. Strategy Overview

                21.4.3.6.1. Product Strategy

                21.4.3.6.2. Channel Strategy

                21.4.3.6.3. Marketing Strategy

        21.4.4. Terumo Corporation

            21.4.4.1. Overview

            21.4.4.2. Product Portfolio

            21.4.4.3. Sales Footprint

            21.4.4.4. Key Financials

            21.4.4.5. SWOT Analysis

            21.4.4.6. Strategy Overview

                21.4.4.6.1. Product Strategy

                21.4.4.6.2. Channel Strategy

                21.4.4.6.3. Marketing Strategy

        21.4.5. Nipro Corporation

            21.4.5.1. Overview

            21.4.5.2. Product Portfolio

            21.4.5.3. Sales Footprint

            21.4.5.4. Key Financials

            21.4.5.5. SWOT Analysis

            21.4.5.6. Strategy Overview

                21.4.5.6.1. Product Strategy

                21.4.5.6.2. Channel Strategy

                21.4.5.6.3. Marketing Strategy

        21.4.6. Teleflex Incorporated

            21.4.6.1. Overview

            21.4.6.2. Product Portfolio

            21.4.6.3. Sales Footprint

            21.4.6.4. Key Financials

            21.4.6.5. SWOT Analysis

            21.4.6.6. Strategy Overview

                21.4.6.6.1. Product Strategy

                21.4.6.6.2. Channel Strategy

                21.4.6.6.3. Marketing Strategy

        21.4.7. Becton, Dickinson, and Company

            21.4.7.1. Overview

            21.4.7.2. Product Portfolio

            21.4.7.3. Sales Footprint

            21.4.7.4. Key Financials

            21.4.7.5. SWOT Analysis

            21.4.7.6. Strategy Overview

                21.4.7.6.1. Product Strategy

                21.4.7.6.2. Channel Strategy

                21.4.7.6.3. Marketing Strategy

        21.4.8. Smiths Medical/ICU Medical

            21.4.8.1. Overview

            21.4.8.2. Product Portfolio

            21.4.8.3. Sales Footprint

            21.4.8.4. Key Financials

            21.4.8.5. SWOT Analysis

            21.4.8.6. Strategy Overview

                21.4.8.6.1. Product Strategy

                21.4.8.6.2. Channel Strategy

                21.4.8.6.3. Marketing Strategy

        21.4.9. Moog Inc

            21.4.9.1. Overview

            21.4.9.2. Product Portfolio

            21.4.9.3. Sales Footprint

            21.4.9.4. Key Financials

            21.4.9.5. SWOT Analysis

            21.4.9.6. Strategy Overview

                21.4.9.6.1. Product Strategy

                21.4.9.6.2. Channel Strategy

                21.4.9.6.3. Marketing Strategy

        21.4.10. AngioDynamics.

            21.4.10.1. Overview

            21.4.10.2. Product Portfolio

            21.4.10.3. Sales Footprint

            21.4.10.4. Key Financials

            21.4.10.5. SWOT Analysis

            21.4.10.6. Strategy Overview

                21.4.10.6.1. Product Strategy

                21.4.10.6.2. Channel Strategy

                21.4.10.6.3. Marketing Strategy

        21.4.11. Fresenius SE & Co. KgaA

            21.4.11.1. Overview

            21.4.11.2. Product Portfolio

            21.4.11.3. Sales Footprint

            21.4.11.4. Key Financials

            21.4.11.5. SWOT Analysis

            21.4.11.6. Strategy Overview

                21.4.11.6.1. Product Strategy

                21.4.11.6.2. Channel Strategy

                21.4.11.6.3. Marketing Strategy

        21.4.12. arcomed ag

            21.4.12.1. Overview

            21.4.12.2. Product Portfolio

            21.4.12.3. Sales Footprint

            21.4.12.4. Key Financials

            21.4.12.5. SWOT Analysis

            21.4.12.6. Strategy Overview

                21.4.12.6.1. Product Strategy

                21.4.12.6.2. Channel Strategy

                21.4.12.6.3. Marketing Strategy

22. Assumptions and Acronyms Used

23. Research Methodology

Explore Healthcare Insights

View Reports
Future Market Insights

IV Disposables Market

Schedule a Call