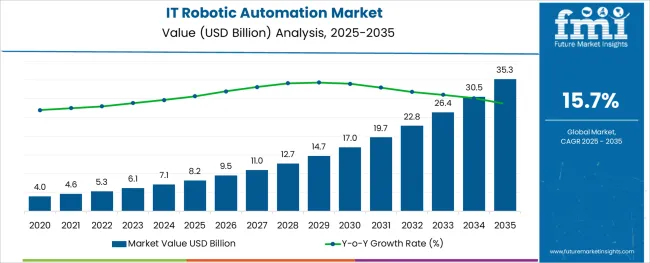
The IT Robotic Automation Market is estimated to be valued at USD 8.2 billion in 2025 and is projected to reach USD 35.3 billion by 2035, registering a compound annual growth rate (CAGR) of 15.7% over the forecast period.
The IT robotic automation market has emerged as a pivotal segment within enterprise IT operations, driven by increasing demand for operational efficiency, cost optimization, and seamless integration of digital workflows. Enterprises across industries are progressively adopting robotic process automation (RPA) solutions to automate rule-based, repetitive tasks, thereby freeing up human resources for higher-value functions.
The market has witnessed a notable surge in implementation across shared services, IT support, and infrastructure management, supported by rapid advancements in artificial intelligence, machine learning, and natural language processing technologies. Future growth is expected to remain robust as organizations prioritize hyperautomation strategies and digital transformation initiatives to remain competitive.
The integration of cognitive RPA capabilities, such as predictive analytics and self-learning bots, is anticipated to reshape IT operational frameworks by minimizing manual interventions and enhancing accuracy in transactional processes. Additionally, the expansion of cloud-based RPA platforms is set to improve accessibility for mid-sized enterprises, contributing to the overall scalability and reach of IT robotic automation solutions in both established and emerging markets.
The market is segmented by Application and region. By Application, the market is divided into Tools, Services, and Training. Regionally, the market is classified into North America, Latin America, Western Europe, Eastern Europe, Balkan & Baltic Countries, Russia & Belarus, Central Asia, East Asia, South Asia & Pacific, and the Middle East & Africa.
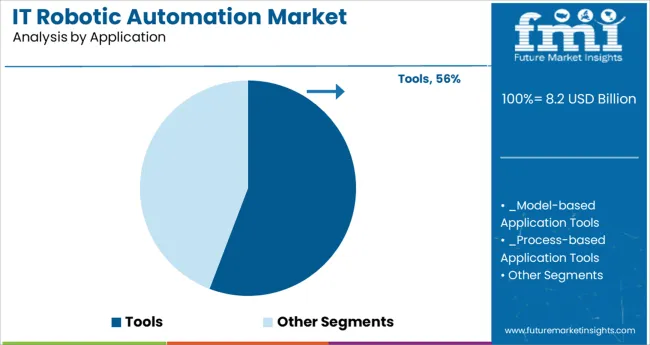
The tools segment held a commanding 55.8% market share within the IT robotic automation market, underscoring its critical role in facilitating process automation and operational streamlining across enterprise IT functions. This segment's growth has been propelled by escalating demand for configurable, scalable, and user-friendly RPA tools capable of integrating seamlessly with existing enterprise resource planning (ERP), customer relationship management (CRM), and cloud-based applications.
The tools segment includes software platforms and frameworks that enable the development, deployment, and monitoring of automated bots across diverse operational workflows. Its dominance is further reinforced by continuous enhancements in platform capabilities, including AI-driven decision-making, real-time analytics, and advanced security protocols.
The rising emphasis on governance, compliance, and risk management within IT environments has also fueled demand for feature-rich, customizable RPA tools. As organizations increasingly prioritize enterprise-wide automation initiatives and invest in centralized automation centers of excellence, the tools segment is expected to maintain its leadership position, supported by ongoing technological innovation and expanding use cases across complex IT service management and infrastructure support operations.
Across industries such as healthcare, telecom, insurance, travel, and banking, automation is being relied upon to speed up the production process, increasing efficiency and cutting costs. Companies need to reduce the time it takes to launch new products in a highly competitive market.
Production timelines and errors in finished products are significantly reduced by robotic process automation. A combination of factors including the factors above as well as impressive improvements in industrial automation technologies accounts for the astounding growth statistics.
In an effort to encourage the growth of the robotic process automation (RPA) market, the rapid emergence of new technologies such as cyber-physical systems, the Internet of Things, machine learning, cloud computing, and artificial intelligence (AI) has been observed.
Labor-intensive organizations are more likely to improve their performance with robotic automation while saving both time and money. Automation of some business processes, IT management, software support, and workflow processes, as well as back office work, has revolutionized the way the process is administered.
Additionally, automation can improve productivity by improving accuracy, eliminating boring, repetitive work, and improving the quality of work.
Robotic automation can be used to increase production rates without sacrificing quality. Robotic automation is being adopted widely by the IT industry due to its low cost and increased efficiency when compared to manual processes.
Due to its benefits, robotic automation is increasingly popular in business process outsourcing (BPO), application, and infrastructure management. Furthermore, the market's growth is expected to be driven by the increasing adoption of cloud-based solutions.
A dynamic environment also makes organizations look for new technologies. Other factors driving the growth of the IT robotic automation market include increasing complexity in IT operations and management.
The rapid growth of the robotic automation market can be slowed by challenges associated with infrastructure and customization. A firm must invest in a reliable infrastructure to implement a process automation solution, as well as a professional team to review the entire process.
Installation of various bots requires complex infrastructure, hiring of professional employees, and training of existing employees.
As a result of the high cost of the automation process, installation, and the requirement of skilled professionals, this process has become increasingly difficult, which has hindered the growth of the market. The costs associated with the maintenance and services of robotics in the market and their upgrades added to hamper the advancement of the market in these sectors.
Hidden costs, a lack of real-time visibility into the steps the robot is performing, and no strategic value as a stand-alone technology also hamper the market growth. During the global pandemic, both internal, as well as external business processes, were affected. A drop in business has hit IT industries, while healthcare has been overwhelmed by COVID-19.
The occurrence of this unusual event-triggered various problems both inside and outside the office, affecting the business in many ways, including extending response times, causing burnout among staff members, causing paperwork backlogs, and causing supply chain interruptions, among other things.
With an anticipated CAGR of 32% from 2025 to 2035, the services segment is expected to continue to lead the global market over the next few years. The service segment is further segmented into professional and training applications.
As enterprises face increased competition among themselves, service providers have been urged to improve the quality of their consulting, integration, development, and BPO services.
RPA as a service is gaining popularity due to continuous upgrades in automation that make it scalable and easy to use. The service helps organizations in identifying opportunities for automation, building business cases, selecting the right vendors, and moving forward.
Consulting services account for a significant share of the market value. The tech industry has benefited from a new era of cost-effective alternatives that are now being considered by organizations in emerging markets. Therefore, organizations that are interested in robotic process automation are in need of consulting services.
With numerous economically and technologically advanced countries represented in the market, North America is projected to grow at a CAGR of 34.7% over the forecast period. According to the forecast, the market's value is expected to reach USD 42.2 Billion by the end of the forecast period.
A growing millennial population, as well as a growing geriatric population, are driving the need for advanced consumer products that require precision. Automating robotic processes can help buyers achieve the same level of accuracy while having speed and agility.
Government agencies and private enterprises in the area are using automation technologies and process management solutions at a high rate.
SMEs in North America are increasingly leveraging robotic process automation as another means of improving a variety of business activities, including planning & estimating, financial management, supply chain management, and a variety of HR-related tasks, which contribute to the market's growth.
Asia Pacific to Emerge as a Highly Opportunistic Region
Asia's growing economy is home to many IT companies, outsourcing companies, and manufacturing firms which rely heavily on automation to minimize repetitive work, supporting the region's growth.
The increased investments in research and development activities and technology developments in these regions are stimulating the market growth of IT robotic automation in these regions.
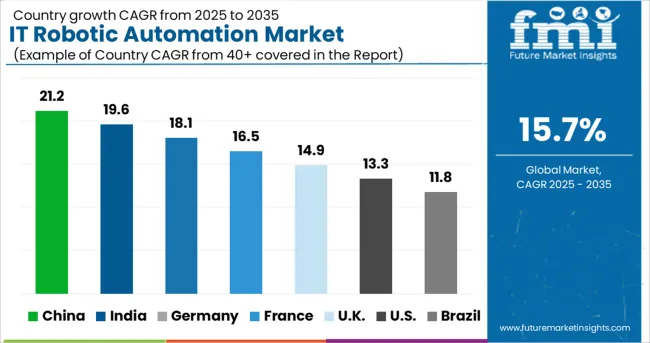
Japan accounts for the highest market value of IT robotics automation with a market value of USD 1.6 Billion during the forecast period. The market is projected to grow at a CAGR of 28.2% during the forecast period.
A partnership between FPT Software and USA-based Sitecore, a provider of digital experience software and automated marketing solutions, was announced in June 2024, so that Sitecore would be available in Japan to a broad range of businesses. Several enterprises in Japan will benefit from the partnership.
In terms of growth rate, India has a compound annual growth rate of 19.3%, followed by China, which has an annual growth rate of 18.6%. The rise of solutions and services across health care, pharmaceutical, information technology, manufacturing, and retail industries has fueled the growth.
In addition, a growing awareness of automation, specifically among SMEs, and the rise of automation in the BPO sector contribute to the region's favorable market growth.
What are the Growth Prospects for IT Robotic Automation across the USA and the UK?
During the forecast period, the IT robotic automation market in the UK is expected to grow at a compound annual growth rate of 16.1%. From manufacturing to banking, finance, and insurance (BFSI), robotic automation is now finding its way into automating repetitive tasks across all sectors.
Currently, financial firms are undergoing a transformation strategy that focuses on automating processes to improve operational efficiency. In the financial services market, automated accounting and reporting processes are contributing to growth due to increasing interest in digital solutions for optimizing business speed.
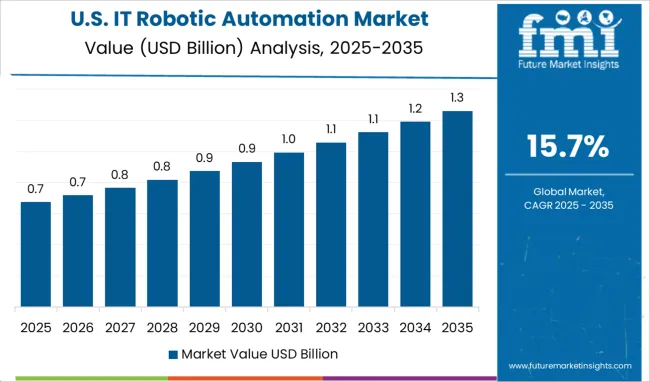
The USA IT robotic automation market is anticipated to account for 15.7% of the total market revenue share in 2035, driven by the increase in the use of cloud technologies, an increase in the use of IoT, and the existence of many companies.
The cloud-based software services market in the USA is experiencing rapid growth due to the region's early implementation of automation in various industries and subsequent technological innovations, which makes it an ideal environment for expansion.
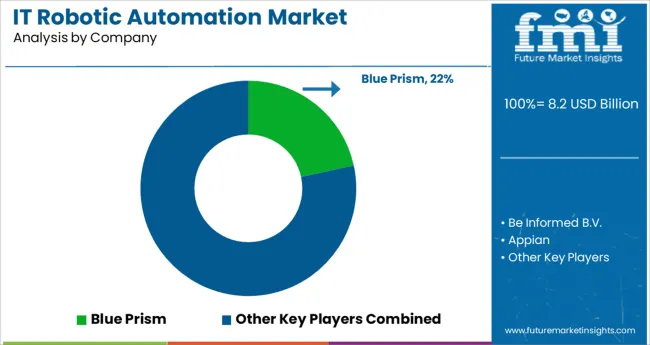
Strategic partnerships enable manufacturers to increase production and meet consumer demand, thereby increasing both revenue and market share. End users will reap the benefits of new technologies through the introduction of new products and technologies. One benefit of a strategic partnership is that it increases the company's production capacity.
IT Robotic Automation Market Developments
The global it robotic automation market is estimated to be valued at USD 8.2 USD billion in 2025.
It is projected to reach USD 35.3 USD billion by 2035.
The market is expected to grow at a 15.7% CAGR between 2025 and 2035.
The key product types are tools, _model-based application tools, _process-based application tools, services, _professional services, _bpo and training.
segment is expected to dominate with a 0.0% industry share in 2025.


Full Research Suite comprises of:
Market outlook & trends analysis
Interviews & case studies
Strategic recommendations
Vendor profiles & capabilities analysis
5-year forecasts
8 regions and 60+ country-level data splits
Market segment data splits
12 months of continuous data updates
DELIVERED AS:
PDF EXCEL ONLINE
IT Asset Disposition Market Forecast and Outlook 2025 to 2035
Itchy Skin Relief Lotions Market Size and Share Forecast Outlook 2025 to 2035
Itaconic Acid Market Size and Share Forecast Outlook 2025 to 2035
Italy Sustainable Tourism Market Size and Share Forecast Outlook 2025 to 2035
Italy Medical Tourism Market Size and Share Forecast Outlook 2025 to 2035
Italy Faith Based Tourism Market Size and Share Forecast Outlook 2025 to 2035
IT Asset Management Market Size and Share Forecast Outlook 2025 to 2035
Italy Casino Tourism Market Analysis 2025 to 2035
Itinerary Aggregators Industry Analysis by Platform, by Destination Type, by Region (North America, Latin America, Europe, East Asia, South Asia, Oceania, MEA) – Forecast for 2025 to 2035
Italy Wine Tourism Market Report – Size, Share & Growth 2025-2035
Italy Women's Luxury Footwear Market Trends – Size, Demand & Forecast 2025-2035
IT Service Management Tools Market Growth – Trends & Forecast through 2034
Italy Tourism Market Analysis – Growth & Industry Trends 2024-2034
IT Infrastructure Management Tools Market
IT Operations Analytics Market
Titanium Strips Market Size and Share Forecast Outlook 2025 to 2035
Lithium Battery Thermal Runaway Sensor Modules Market Size and Share Forecast Outlook 2025 to 2035
Sit-Down Reach Truck Market Size and Share Forecast Outlook 2025 to 2035
Citrus Molasses Market Size and Share Forecast Outlook 2025 to 2035
Titanium Diboride Market Size and Share Forecast Outlook 2025 to 2035

Thank you!
You will receive an email from our Business Development Manager. Please be sure to check your SPAM/JUNK folder too.
Chat With
MaRIA