Ischemia Reperfusion Injury Treatment Market Snapshot

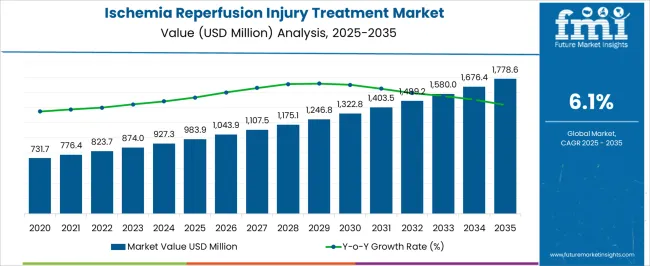
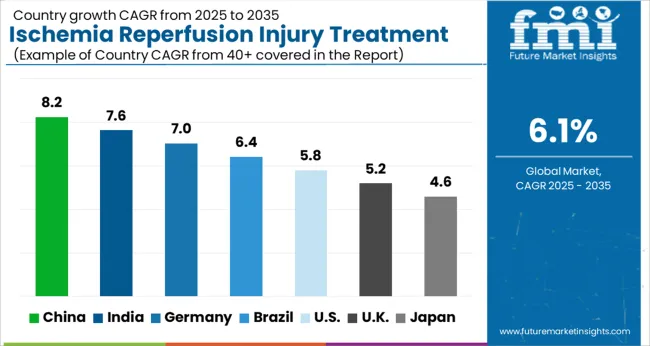
The global ischemia reperfusion injury treatment market garnered a market value of US$ 823.74 Million in 2022 and is expected to accumulate a market value of US$ 1580 Million by registering a CAGR of 6.1% in the forecast period 2023 to 2033. Growth of the ischemia reperfusion injury treatment market can be attributed to growing prevalence of conditions that can lead to IRI, such as heart attacks, strokes, and organ transplants. Additionally, advances in technology and medical research are leading to the development of new and innovative therapies for IRI, which is expected to further drive market growth in the coming years. The market for ischemia reperfusion injury treatment registered a CAGR of 3.4% in the historical period 2018 to 2022

Ischemia-reperfusion injury (IRI) occurs when blood supply to an organ or tissue is temporarily cut off, followed by the restoration of blood flow. This can lead to tissue damage and cell death. Ischemia-reperfusion injury treatment refers to therapies or interventions aimed at preventing or minimizing the damage caused by IRI.

The ischemia reperfusion injury treatment market includes a variety of drugs, devices, and therapies that are used to prevent or treat IRI in different organs, including the heart, liver, kidneys, and brain. These treatments may include medications to prevent inflammation and oxidative stress, mechanical devices to improve blood flow, or surgical procedures to restore blood flow to the affected area.

Report Attribute Details
Expected Market Value (2023) US$ 873.98 Million
Anticipated Forecast Value (2033) US$ 1580 Million
Projected Growth Rate (2023 to 2033) 6.1% CAGR

Don't pay for what you don't need

Customize your report by selecting specific countries or regions and save 30%!

2018 to 2022 Ischemia Reperfusion Injury Treatment Market Demand Analysis vs. Forecast 2023 to 2033

According to market research and competitive intelligence provider Future Market Insights- the market for Ischemia reperfusion injury treatment reflected a value of 3.4% during the historical period, 2018 to 2022.

Factors driving the growth of the ischemia reperfusion injury treatment market during this period include an increase in the incidence of ischemia-related disorders such as heart attacks, strokes, and organ transplants, as well as the development of new and innovative therapies to address these conditions.

Additionally, the market has seen an increase in collaborations and partnerships between pharmaceutical and medical device companies, as well as increased investment in research and development to advance the development of new therapies and technologies.

Thus, the market for Ischemia reperfusion injury treatment is expected to register a CAGR of 6.1% in the forecast period 2023 to 2033.

Which are Some Prominent Drivers of Ischemia Reperfusion Injury Treatment Market?

Increasing incidence of ischemia-related disorders driving market growth

The rising prevalence of conditions such as heart attacks, strokes, and organ transplants has led to an increased demand for effective ischemia reperfusion injury treatments. Technological advances have led to the development of new and innovative therapies for ischemia reperfusion injury, such as hypothermia and gene therapy.

Pharmaceutical and medical device companies are investing heavily in research and development to develop new and more effective treatments for ischemia reperfusion injury. Increased collaboration between pharmaceutical and medical device companies has led to the development of new therapies and technologies that can effectively treat ischemia reperfusion injury.

Governments around the world are providing favorable policies and funding to support the development of new treatments for ischemia reperfusion injury, which is driving market growth.

Availability of treatments shaping landscape for ischemia reperfusion injury treatment

Pharmacological therapies: This involves the use of medications such as anti-inflammatory drugs, antioxidants, and free radical scavengers to prevent or reduce the damage caused by ischemia reperfusion injury.

Mechanical interventions: This involves the use of devices such as intra-aortic balloon pumps or extracorporeal membrane oxygenation (ECMO) to improve blood flow and oxygen delivery to the affected tissues or organs.

Surgical procedures: Revascularization procedures such as coronary artery bypass grafting (CABG), carotid endarterectomy, and organ transplantation can be used to restore blood flow to the affected area.

Hypothermia: Inducing mild hypothermia can help to reduce the metabolic rate of the affected tissues or organs, which can reduce the damage caused by ischemia reperfusion injury.

Gene therapy: This involves introducing genes into the affected tissues or organs to enhance their ability to tolerate ischemia and reperfusion.

Sabyasachi Ghosh
Sabyasachi Ghosh

Principal Consultant

Talk to Analyst

Find your sweet spots for generating winning opportunities in this market.

What are the Challenges Faced by the Ischemia Reperfusion Injury Treatment Market?

Lack of awareness and expensive nature of treatment derailing market growth

A significant challenge in the ischemia reperfusion injury treatment market is the lack of awareness among patients and healthcare professionals about the condition and available treatment options. This can lead to a delay in diagnosis and treatment, resulting in poorer patient outcomes.

The cost of treating ischemia reperfusion injury can be high, particularly for complex cases that require advanced medical interventions. This can limit access to treatment, especially in developing countries where healthcare budgets are limited.

Currently, there are limited treatment options available for ischemia reperfusion injury, which can make it difficult to manage and treat the condition effectively. This underscores the need for continued research and development of new therapies.

Some of the treatment options for ischemia reperfusion injury, such as reperfusion therapy, can have adverse effects on the patient, including bleeding, clotting, and arrhythmias. This can make it challenging for healthcare professionals to balance the potential benefits of treatment with the risks of complications.

The regulatory environment surrounding the development and approval of new therapies for ischemia reperfusion injury can be complex and time-consuming. This can delay the availability of new treatments and limit the options available to patients.
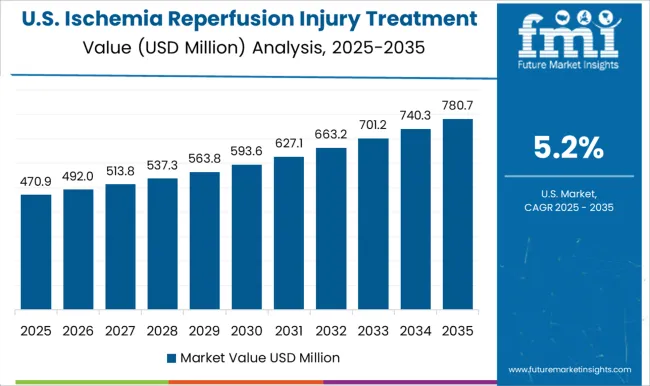
Region-Wise Insights

Increasing prevalence of ischemic disorders Bolstering Market Growth in North America?

Presence of major key players creating lucrative opportunities for treatment of ischemic disorders

The North America ischemia reperfusion injury treatment market is one of the largest in the world, with the United States and Canada being the major markets in the region.

The market growth is driven by the increasing prevalence of ischemic disorders such as heart attacks, strokes, and organ transplants, as well as the presence of well-established healthcare infrastructure and a high level of healthcare spending in the region. The increasing adoption of new and innovative therapies, such as hypothermia, gene therapy, and stem cell therapy, will further drive the market growth in the coming years.

Some of the major players in the North America ischemia reperfusion injury treatment market include Pfizer, Inc., Merck & Co., Inc., F. Hoffmann-La Roche Ltd, Abbott Laboratories, and Novartis AG. These companies are investing heavily in research and development to develop new and more effective treatments for ischemia reperfusion injury, which is expected to further drive market growth in the region. Thus, North America is expected to possess 47% market share for ischemia reperfusion injury treatment market in 2023.

Increasing adoption of innovative therapies Propelling Market Growth in Europe?

Well-established healthcare infrastructure favoring market growth in Europe

The Europe ischemia reperfusion injury treatment market is experiencing growth due to several factors. One of the main drivers of the market is the increasing prevalence of ischemic disorders such as heart attacks, strokes, and organ transplants, which are contributing to the demand for ischemia reperfusion injury treatments in the region. Additionally, the region's well-established healthcare infrastructure, high healthcare spending, and favorable government initiatives are also driving the market growth.

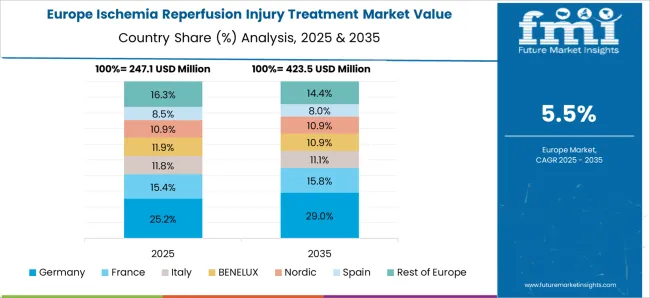
In addition, the increasing adoption of innovative therapies such as hypothermia, gene therapy, and stem cell therapy as a significant factor driving the market growth in the region. In order to drive market growth in the region, Furthermore, key companies are making significant investments in research and development aimed at creating novel and more efficient therapies for ischemia reperfusion injury. Thus, Europe is expected to possess 41% market share for ischemia reperfusion injury treatment market in 2023.

Get the data you need at a Fraction of the cost

Personalize your report by choosing insights you need
and save 40%!

Category-Wise Insights

Advanced Equipment and Technology Increasing Dependency on Hospitals for Ischemia Reperfusion Injury Treatment?

Presence of emergency care increasing popularity of ischemia reperfusion injury treatment

Hospitals typically have access to advanced medical equipment and technology, which is necessary for the diagnosis and treatment of ischemia reperfusion injury. This includes tools like imaging equipment, cardiac monitors, and specialized surgical instruments.

Hospitals typically have multidisciplinary teams of healthcare professionals, including doctors, nurses, and other specialists, who work together to provide comprehensive care to patients with ischemia reperfusion injury.

Emergency care: In cases where ischemia reperfusion injury is caused by a medical emergency, such as a heart attack or stroke, hospitals are equipped to provide emergency care quickly and efficiently, which can be critical in improving patient outcomes.

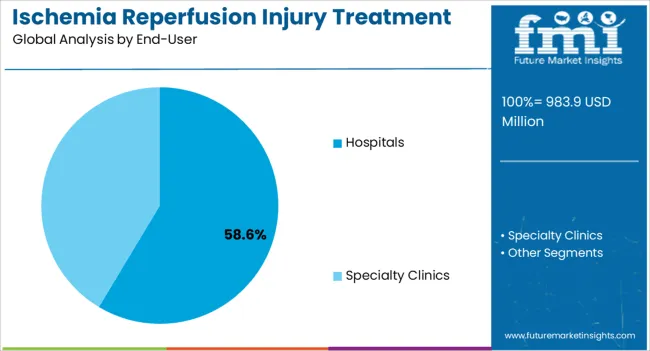
After initial treatment, patients with ischemia reperfusion injury may require ongoing follow-up care to manage their condition and prevent complications. Hospitals typically have the resources and expertise to provide this type of care. Thus, hospitals are expected to possess 53% market share for ischemia reperfusion injury treatment market in 2023.

Market Competition

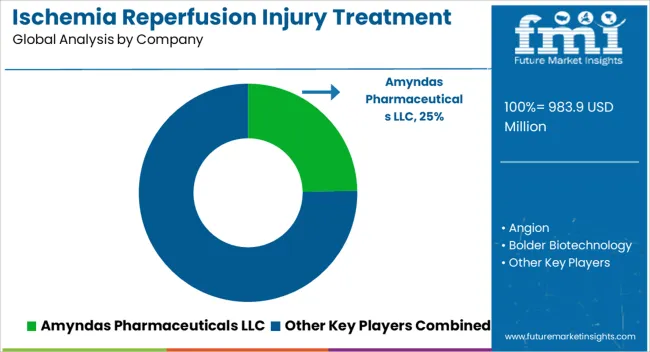
Key players in the ischemia reperfusion injury treatment market are Amyndas Pharmaceuticals LLC, Angion, Bolder Biotechnology, Opsona Therapeutics Ltd., Pharming Group NV, Prolong Pharmaceuticals, Prothix BV, Stealth BioTherapeutics, Inc., Zealand Pharma A/S, Faraday Pharmaceuticals and SBI Pharmaceuticals

  • Amyndas Pharmaceuticals has developed a drug candidate called AMY-101, which is a HSP inducer that has shown promising results in preclinical studies. The drug has been shown to reduce tissue damage and improve functional recovery in animal models of myocardial infarction, stroke, and kidney ischemia reperfusion injury.
  • Bolder Biotechnology has developed a drug candidate called BBT-015, which is a modified form of human serum albumin (HSA). BBT-015 has been engineered to include a domain called H-NOX, which can bind to and modulate nitric oxide (NO) signaling in the body. Nitric oxide is a key signaling molecule involved in many physiological processes, including blood vessel dilation, immune cell function, and inflammation.

Report Scope

Report Attribute Details
Market Value in 2023 US$ 873.98 Million
Market Value in 2033 US$ 1580 Million
Growth Rate CAGR of 6.1% from 2023 to 2033
Base Year for Estimation 2022
Historical Data 2018 to 2022
Forecast Period 2023 to 2033
Quantitative Units Revenue in USD Million and CAGR from 2023 to 2033
Report Coverage Revenue Forecast, Volume Forecast, Company Ranking, Competitive Landscape, Growth Factors, Trends and Pricing Analysis
Segments Covered
  • Indication
  • End User
  • Region
Regions Covered
  • North America
  • Latin America
  • Europe
  • South Asia
  • East Asia
  • Oceania
  • Middle East & Africa
Key Countries Profiled
  • USA
  • Canada
  • Brazil
  • Mexico
  • Rest of Latin America
  • Germany
  • United kingdom
  • France
  • Spain
  • Italy
  • Rest of Europe
  • India
  • Malaysia
  • Singapore
  • Thailand
  • Rest of South Asia
  • China
  • Japan
  • South Korea
  • Austria
  • New Zealand
  • GCC countries
  • South Africa
  • Israel
  • Rest of MEA
Key Companies Profiled
  • Amyndas Pharmaceuticals LLC
  • Angion
  • Bolder Biotechnology
  • Opsona Therapeutics Ltd.
  • Pharming Group NV
  • Prolong Pharmaceuticals
  • Prothix BV
  • Stealth BioTherapeutics, Inc.
  • Zealand Pharma A/S
  • Faraday Pharmaceuticals
  • SBI Pharmaceuticals
Customization Available Upon Request

Key Segments Profiled in the Ischemia Reperfusion Injury Treatment Industry Survey

Indication:

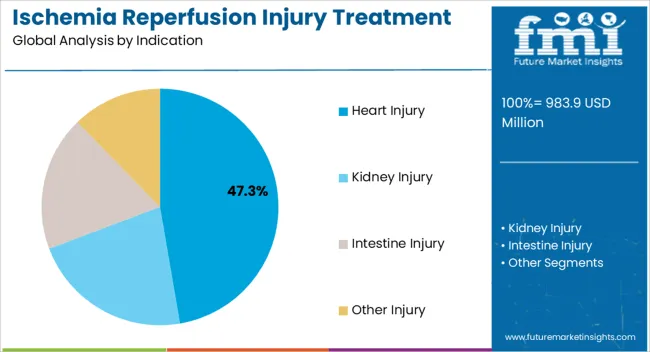
  • Heart injury
  • Kidney injury
  • Intestine injury
  • Other injury

End-user:

  • Hospitals
  • Specialty Clinics

Region:

  • North America
  • Latin America
  • Europe
  • South Asia
  • East Asia
  • Oceania
  • Middle East & Africa

Frequently Asked Questions

At what rate did the Ischemia reperfusion injury treatment market flourish from 2018 to 2022?

From 2018 to 2022, the Ischemia reperfusion injury treatment market grew at a CAGR of 3.4%

What will be the growth rate of the global Ischemia reperfusion injury treatment market during the forecast period?

The global Ischemia reperfusion injury treatment market is expected to grow with a 6.1% CAGR during 2023 to 2033.

What will be the projected market size of the Ischemia reperfusion injury treatment market by 2033?

As of 2033, the Ischemia reperfusion injury treatment market is expected to reach US$ 1580 Million

Which end user segment is expected to dominate the global Ischemia reperfusion injury treatment market during 2023?

Hospitals are expected to hold 53% of the market share in 2023 for Ischemia reperfusion injury treatment market.

How is the North America Ischemia reperfusion injury treatment market projected to grow in 2023?

North America is expected to possess 47% market share for Ischemia reperfusion injury treatment market in 2023.

How is the Europe Ischemia reperfusion injury treatment market projected to grow in 2023?

Europe Ischemia reperfusion injury treatment market size is expected to possess 41% market share in 2023.

Table of Content

1. Executive Summary | Ischemia Reperfusion Injury Treatment Market

    1.1. Global Market Outlook

    1.2. Demand-side Trends

    1.3. Supply-side Trends

    1.4. Technology Roadmap Analysis

    1.5. Analysis and Recommendations

2. Market Overview

    2.1. Market Coverage / Taxonomy

    2.2. Market Definition / Scope / Limitations

3. Market Background

    3.1. Market Dynamics

        3.1.1. Drivers

        3.1.2. Restraints

        3.1.3. Opportunity

        3.1.4. Trends

    3.2. Scenario Forecast

        3.2.1. Demand in Optimistic Scenario

        3.2.2. Demand in Likely Scenario

        3.2.3. Demand in Conservative Scenario

    3.3. Opportunity Map Analysis

    3.4. Investment Feasibility Matrix

    3.5. PESTLE and Porter’s Analysis

    3.6. Regulatory Landscape

        3.6.1. By Key Regions

        3.6.2. By Key Countries

    3.7. Regional Parent Market Outlook

4. Global Market Analysis 2018 to 022 and Forecast, 2023 to 2033

    4.1. Historical Market Size Value (US$ Million) Analysis, 2018 to 022

    4.2. Current and Future Market Size Value (US$ Million) Projections, 2023 to 2033

        4.2.1. Y-o-Y Growth Trend Analysis

        4.2.2. Absolute $ Opportunity Analysis

5. Global Market Analysis 2018 to 022 and Forecast 2023 to 2033, By Indication

    5.1. Introduction / Key Findings

    5.2. Historical Market Size Value (US$ Million) Analysis By Indication, 2018 to 022

    5.3. Current and Future Market Size Value (US$ Million) Analysis and Forecast By Indication, 2023 to 2033

        5.3.1. Heart Injury

        5.3.2. Kidney Injury

        5.3.3. Intestine Injury

        5.3.4. Other Injury

    5.4. Y-o-Y Growth Trend Analysis By Indication, 2018 to 022

    5.5. Absolute $ Opportunity Analysis By Indication, 2023 to 2033

6. Global Market Analysis 2018 to 022 and Forecast 2023 to 2033, By Treatment

    6.1. Introduction / Key Findings

    6.2. Historical Market Size Value (US$ Million) Analysis By Treatment, 2018 to 022

    6.3. Current and Future Market Size Value (US$ Million) Analysis and Forecast By Treatment, 2023 to 2033

        6.3.1. Drug Therapy

        6.3.2. Medicated Gases

    6.4. Y-o-Y Growth Trend Analysis By Treatment, 2018 to 022

    6.5. Absolute $ Opportunity Analysis By Treatment, 2023 to 2033

7. Global Market Analysis 2018 to 022 and Forecast 2023 to 2033, By End-user

    7.1. Introduction / Key Findings

    7.2. Historical Market Size Value (US$ Million) Analysis By End-user, 2018 to 022

    7.3. Current and Future Market Size Value (US$ Million) Analysis and Forecast By End-user, 2023 to 2033

        7.3.1. Hospitals

        7.3.2. Specialty Clinics

    7.4. Y-o-Y Growth Trend Analysis By End-user, 2018 to 022

    7.5. Absolute $ Opportunity Analysis By End-user, 2023 to 2033

8. Global Market Analysis 2018 to 022 and Forecast 2023 to 2033, By Region

    8.1. Introduction

    8.2. Historical Market Size Value (US$ Million) Analysis By Region, 2018 to 022

    8.3. Current Market Size Value (US$ Million) Analysis and Forecast By Region, 2023 to 2033

        8.3.1. North America

        8.3.2. Latin America

        8.3.3. Europe

        8.3.4. South Asia

        8.3.5. East Asia

        8.3.6. Oceania

        8.3.7. MEA

    8.4. Market Attractiveness Analysis By Region

9. North America Market Analysis 2018 to 022 and Forecast 2023 to 2033, By Country

    9.1. Historical Market Size Value (US$ Million) Trend Analysis By Market Taxonomy, 2018 to 022

    9.2. Market Size Value (US$ Million) Forecast By Market Taxonomy, 2023 to 2033

        9.2.1. By Country

            9.2.1.1. USA

            9.2.1.2. Canada

        9.2.2. By Indication

        9.2.3. By Treatment

        9.2.4. By End-user

    9.3. Market Attractiveness Analysis

        9.3.1. By Country

        9.3.2. By Indication

        9.3.3. By Treatment

        9.3.4. By End-user

    9.4. Key Takeaways

10. Latin America Market Analysis 2018 to 022 and Forecast 2023 to 2033, By Country

    10.1. Historical Market Size Value (US$ Million) Trend Analysis By Market Taxonomy, 2018 to 022

    10.2. Market Size Value (US$ Million) Forecast By Market Taxonomy, 2023 to 2033

        10.2.1. By Country

            10.2.1.1. Brazil

            10.2.1.2. Mexico

            10.2.1.3. Rest of Latin America

        10.2.2. By Indication

        10.2.3. By Treatment

        10.2.4. By End-user

    10.3. Market Attractiveness Analysis

        10.3.1. By Country

        10.3.2. By Indication

        10.3.3. By Treatment

        10.3.4. By End-user

    10.4. Key Takeaways

11. Europe Market Analysis 2018 to 022 and Forecast 2023 to 2033, By Country

    11.1. Historical Market Size Value (US$ Million) Trend Analysis By Market Taxonomy, 2018 to 022

    11.2. Market Size Value (US$ Million) Forecast By Market Taxonomy, 2023 to 2033

        11.2.1. By Country

            11.2.1.1. Germany

            11.2.1.2. United kingdom

            11.2.1.3. France

            11.2.1.4. Spain

            11.2.1.5. Italy

            11.2.1.6. Rest of Europe

        11.2.2. By Indication

        11.2.3. By Treatment

        11.2.4. By End-user

    11.3. Market Attractiveness Analysis

        11.3.1. By Country

        11.3.2. By Indication

        11.3.3. By Treatment

        11.3.4. By End-user

    11.4. Key Takeaways

12. South Asia Market Analysis 2018 to 022 and Forecast 2023 to 2033, By Country

    12.1. Historical Market Size Value (US$ Million) Trend Analysis By Market Taxonomy, 2018 to 022

    12.2. Market Size Value (US$ Million) Forecast By Market Taxonomy, 2023 to 2033

        12.2.1. By Country

            12.2.1.1. India

            12.2.1.2. Malaysia

            12.2.1.3. Singapore

            12.2.1.4. Thailand

            12.2.1.5. Rest of South Asia

        12.2.2. By Indication

        12.2.3. By Treatment

        12.2.4. By End-user

    12.3. Market Attractiveness Analysis

        12.3.1. By Country

        12.3.2. By Indication

        12.3.3. By Treatment

        12.3.4. By End-user

    12.4. Key Takeaways

13. East Asia Market Analysis 2018 to 022 and Forecast 2023 to 2033, By Country

    13.1. Historical Market Size Value (US$ Million) Trend Analysis By Market Taxonomy, 2018 to 022

    13.2. Market Size Value (US$ Million) Forecast By Market Taxonomy, 2023 to 2033

        13.2.1. By Country

            13.2.1.1. China

            13.2.1.2. Japan

            13.2.1.3. South Korea

        13.2.2. By Indication

        13.2.3. By Treatment

        13.2.4. By End-user

    13.3. Market Attractiveness Analysis

        13.3.1. By Country

        13.3.2. By Indication

        13.3.3. By Treatment

        13.3.4. By End-user

    13.4. Key Takeaways

14. Oceania Market Analysis 2018 to 022 and Forecast 2023 to 2033, By Country

    14.1. Historical Market Size Value (US$ Million) Trend Analysis By Market Taxonomy, 2018 to 022

    14.2. Market Size Value (US$ Million) Forecast By Market Taxonomy, 2023 to 2033

        14.2.1. By Country

            14.2.1.1. Australia

            14.2.1.2. New Zealand

        14.2.2. By Indication

        14.2.3. By Treatment

        14.2.4. By End-user

    14.3. Market Attractiveness Analysis

        14.3.1. By Country

        14.3.2. By Indication

        14.3.3. By Treatment

        14.3.4. By End-user

    14.4. Key Takeaways

15. MEA Market Analysis 2018 to 022 and Forecast 2023 to 2033, By Country

    15.1. Historical Market Size Value (US$ Million) Trend Analysis By Market Taxonomy, 2018 to 022

    15.2. Market Size Value (US$ Million) Forecast By Market Taxonomy, 2023 to 2033

        15.2.1. By Country

            15.2.1.1. GCC Countries

            15.2.1.2. South Africa

            15.2.1.3. Israel

            15.2.1.4. Rest of MEA

        15.2.2. By Indication

        15.2.3. By Treatment

        15.2.4. By End-user

    15.3. Market Attractiveness Analysis

        15.3.1. By Country

        15.3.2. By Indication

        15.3.3. By Treatment

        15.3.4. By End-user

    15.4. Key Takeaways

16. Key Countries Market Analysis

    16.1. USA

        16.1.1. Pricing Analysis

        16.1.2. Market Share Analysis, 2022

            16.1.2.1. By Indication

            16.1.2.2. By Treatment

            16.1.2.3. By End-user

    16.2. Canada

        16.2.1. Pricing Analysis

        16.2.2. Market Share Analysis, 2022

            16.2.2.1. By Indication

            16.2.2.2. By Treatment

            16.2.2.3. By End-user

    16.3. Brazil

        16.3.1. Pricing Analysis

        16.3.2. Market Share Analysis, 2022

            16.3.2.1. By Indication

            16.3.2.2. By Treatment

            16.3.2.3. By End-user

    16.4. Mexico

        16.4.1. Pricing Analysis

        16.4.2. Market Share Analysis, 2022

            16.4.2.1. By Indication

            16.4.2.2. By Treatment

            16.4.2.3. By End-user

    16.5. Germany

        16.5.1. Pricing Analysis

        16.5.2. Market Share Analysis, 2022

            16.5.2.1. By Indication

            16.5.2.2. By Treatment

            16.5.2.3. By End-user

    16.6. United kingdom

        16.6.1. Pricing Analysis

        16.6.2. Market Share Analysis, 2022

            16.6.2.1. By Indication

            16.6.2.2. By Treatment

            16.6.2.3. By End-user

    16.7. France

        16.7.1. Pricing Analysis

        16.7.2. Market Share Analysis, 2022

            16.7.2.1. By Indication

            16.7.2.2. By Treatment

            16.7.2.3. By End-user

    16.8. Spain

        16.8.1. Pricing Analysis

        16.8.2. Market Share Analysis, 2022

            16.8.2.1. By Indication

            16.8.2.2. By Treatment

            16.8.2.3. By End-user

    16.9. Italy

        16.9.1. Pricing Analysis

        16.9.2. Market Share Analysis, 2022

            16.9.2.1. By Indication

            16.9.2.2. By Treatment

            16.9.2.3. By End-user

    16.10. India

        16.10.1. Pricing Analysis

        16.10.2. Market Share Analysis, 2022

            16.10.2.1. By Indication

            16.10.2.2. By Treatment

            16.10.2.3. By End-user

    16.11. Malaysia

        16.11.1. Pricing Analysis

        16.11.2. Market Share Analysis, 2022

            16.11.2.1. By Indication

            16.11.2.2. By Treatment

            16.11.2.3. By End-user

    16.12. Singapore

        16.12.1. Pricing Analysis

        16.12.2. Market Share Analysis, 2022

            16.12.2.1. By Indication

            16.12.2.2. By Treatment

            16.12.2.3. By End-user

    16.13. Thailand

        16.13.1. Pricing Analysis

        16.13.2. Market Share Analysis, 2022

            16.13.2.1. By Indication

            16.13.2.2. By Treatment

            16.13.2.3. By End-user

    16.14. China

        16.14.1. Pricing Analysis

        16.14.2. Market Share Analysis, 2022

            16.14.2.1. By Indication

            16.14.2.2. By Treatment

            16.14.2.3. By End-user

    16.15. Japan

        16.15.1. Pricing Analysis

        16.15.2. Market Share Analysis, 2022

            16.15.2.1. By Indication

            16.15.2.2. By Treatment

            16.15.2.3. By End-user

    16.16. South Korea

        16.16.1. Pricing Analysis

        16.16.2. Market Share Analysis, 2022

            16.16.2.1. By Indication

            16.16.2.2. By Treatment

            16.16.2.3. By End-user

    16.17. Australia

        16.17.1. Pricing Analysis

        16.17.2. Market Share Analysis, 2022

            16.17.2.1. By Indication

            16.17.2.2. By Treatment

            16.17.2.3. By End-user

    16.18. New Zealand

        16.18.1. Pricing Analysis

        16.18.2. Market Share Analysis, 2022

            16.18.2.1. By Indication

            16.18.2.2. By Treatment

            16.18.2.3. By End-user

    16.19. GCC Countries

        16.19.1. Pricing Analysis

        16.19.2. Market Share Analysis, 2022

            16.19.2.1. By Indication

            16.19.2.2. By Treatment

            16.19.2.3. By End-user

    16.20. South Africa

        16.20.1. Pricing Analysis

        16.20.2. Market Share Analysis, 2022

            16.20.2.1. By Indication

            16.20.2.2. By Treatment

            16.20.2.3. By End-user

    16.21. Israel

        16.21.1. Pricing Analysis

        16.21.2. Market Share Analysis, 2022

            16.21.2.1. By Indication

            16.21.2.2. By Treatment

            16.21.2.3. By End-user

17. Market Structure Analysis

    17.1. Competition Dashboard

    17.2. Competition Benchmarking

    17.3. Market Share Analysis of Top Players

        17.3.1. By Regional

        17.3.2. By Indication

        17.3.3. By Treatment

        17.3.4. By End-user

18. Competition Analysis

    18.1. Competition Deep Dive

        18.1.1. Amyndas Pharmaceuticals LLC

            18.1.1.1. Overview

            18.1.1.2. Product Portfolio

            18.1.1.3. Profitability by Market Segments

            18.1.1.4. Sales Footprint

            18.1.1.5. Strategy Overview

                18.1.1.5.1. Marketing Strategy

        18.1.2. Angion

            18.1.2.1. Overview

            18.1.2.2. Product Portfolio

            18.1.2.3. Profitability by Market Segments

            18.1.2.4. Sales Footprint

            18.1.2.5. Strategy Overview

                18.1.2.5.1. Marketing Strategy

        18.1.3. Bolder Biotechnology

            18.1.3.1. Overview

            18.1.3.2. Product Portfolio

            18.1.3.3. Profitability by Market Segments

            18.1.3.4. Sales Footprint

            18.1.3.5. Strategy Overview

                18.1.3.5.1. Marketing Strategy

        18.1.4. Opsona Therapeutics Ltd.

            18.1.4.1. Overview

            18.1.4.2. Product Portfolio

            18.1.4.3. Profitability by Market Segments

            18.1.4.4. Sales Footprint

            18.1.4.5. Strategy Overview

                18.1.4.5.1. Marketing Strategy

        18.1.5. Pharming Group NV

            18.1.5.1. Overview

            18.1.5.2. Product Portfolio

            18.1.5.3. Profitability by Market Segments

            18.1.5.4. Sales Footprint

            18.1.5.5. Strategy Overview

                18.1.5.5.1. Marketing Strategy

        18.1.6. Prolong Pharmaceuticals

            18.1.6.1. Overview

            18.1.6.2. Product Portfolio

            18.1.6.3. Profitability by Market Segments

            18.1.6.4. Sales Footprint

            18.1.6.5. Strategy Overview

                18.1.6.5.1. Marketing Strategy

        18.1.7. Prothix BV

            18.1.7.1. Overview

            18.1.7.2. Product Portfolio

            18.1.7.3. Profitability by Market Segments

            18.1.7.4. Sales Footprint

            18.1.7.5. Strategy Overview

                18.1.7.5.1. Marketing Strategy

        18.1.8. Stealth BioTherapeutics, Inc.

            18.1.8.1. Overview

            18.1.8.2. Product Portfolio

            18.1.8.3. Profitability by Market Segments

            18.1.8.4. Sales Footprint

            18.1.8.5. Strategy Overview

                18.1.8.5.1. Marketing Strategy

        18.1.9. Zealand Pharma A/S

            18.1.9.1. Overview

            18.1.9.2. Product Portfolio

            18.1.9.3. Profitability by Market Segments

            18.1.9.4. Sales Footprint

            18.1.9.5. Strategy Overview

                18.1.9.5.1. Marketing Strategy

        18.1.10. Faraday Pharmaceuticals

            18.1.10.1. Overview

            18.1.10.2. Product Portfolio

            18.1.10.3. Profitability by Market Segments

            18.1.10.4. Sales Footprint

            18.1.10.5. Strategy Overview

                18.1.10.5.1. Marketing Strategy

        18.1.11. SBI Pharmaceuticals

            18.1.11.1. Overview

            18.1.11.2. Product Portfolio

            18.1.11.3. Profitability by Market Segments

            18.1.11.4. Sales Footprint

            18.1.11.5. Strategy Overview

                18.1.11.5.1. Marketing Strategy

19. Assumptions & Acronyms Used

20. Research Methodology

Recommendations

Healthcare

Cancer Diagnostics Market

December 2024

REP-GB-1090

405 pages

Healthcare

Ischemic Stroke Aspiration Systems Market

July 2023

REP-GB-9662

333 pages

Explore Healthcare Insights

View Reports
Future Market Insights

Ischemia Reperfusion Injury Treatment Market

Schedule a Call