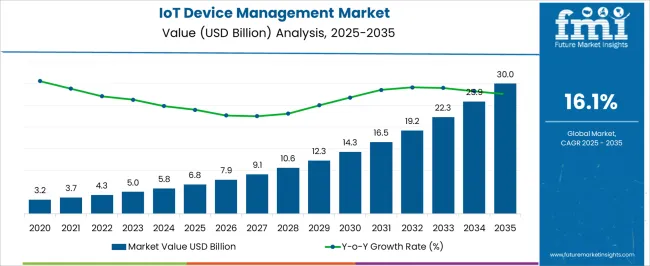
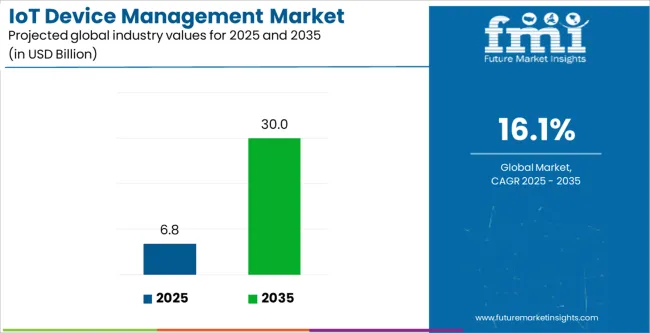
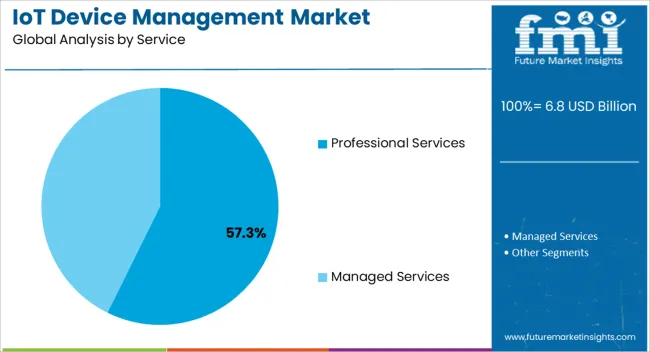
The IoT device management market size is projected to be valued at USD 4,965.4 million in 2023 and is expected to rise to USD 28,118.5 million by 2033. The sales of IoT device management are predicted to expand at a significant CAGR of 16.8% during the forecast period.
Over the next few years, the market is likely to be driven by rising demand for IoT services, as well as increased penetration of communication and networking technologies.
Given the growing need for advanced infrastructure management solutions that eliminate manual complications in companies, the IoT device management market is predicted to develop at a healthy rate.
The market has grown significantly as the Internet of Things (IoT) has become widely adopted for various functions. Because of the significant advancement of technology and the necessity for efficient management of connected devices, solutions such as real-time analysis, security, and data management have been developed, which are influencing market trends.
Attributes | Details |
---|---|
IoT Device Management Market Estimated Size (2023) | USD 4,965.4 million |
IoT Device Management Market CAGR (2023 to 2033) | 16.8% |
IoT Device Management Market Forecasted Size (2033) | USD 28,118.5 million |
The IoT device management market is predicted to develop in response to the notably growing demand for IoT solutions across all industrial sectors, as well as the benefits of this network, such as connected computing, and supply chain analytics.
The increased saturation of networking and communication technologies, as well as the global need for digitalization, are driving the adoption of IoT device management and cloud-based technology services.
The market is predicted to develop in response to the significantly growing demand for IoT solutions across all industrial sectors, as well as the benefits of this network, such as connected computing, marketing automation, and supply chain analytics.
The increased saturation of networking and communication technologies, as well as the global need for digitalization, are boosting the adoption of IoT device management and cloud-based technology services. Furthermore, there are a few improvements in IoT device management that give the profit potential for the IoT device management market size's growth such as:
Improvements in IoT device management, such as high productivity, real-time device monitoring, and updating increased customer reliability, and data security, give the profit potential for the market size's growth.
The matter of cybercrime at the devices and communication layer is a big barrier for the IoT device management market. Intrusion in platforms, servers, and browsers can render the network unfit for use. In turn, resulting in the loss of key data, increased costs of installing new devices, and the theft of equipment and critical organizational data such as financial and customer information. This is negatively impacting the market adoption trends.
Smart gadgets and the Internet of Things (IoT) enable retailers to improve customer experience and increase conversions while also affecting day-to-day store operations. Some of the advantages of implementing IoT in the retail industry include power management, in-store navigation, theft prevention, and consumer interaction. The Internet of Things (IoT) and connected technologies are sweeping the retail business.
As per the IoT device management market study, energy usage, whether in refrigeration, heating, air conditioning, lighting, or other areas, is a significant cost element for retailers. Efficient usage of these energy sources can result in annual cost reductions of up to 20%. Energy conservation and management issues can be solved with the help of smart IoT-enabled devices.
Retailers are likely to increase sales and empower their employees to respond in ways that improve the customer experience and successfully manage shop inventories thanks to the Internet of Things. According to Verizon's survey, 77 percent of merchants feel that IoT solutions may significantly improve the consumer experience.
Using integrated sensors, many IoT-based solutions can record, monitor, warn, or alert store workers about temperature, gas leaks, power outages, power usage, heating, and many more. Store owners can interface with refrigerator controllers and retrieve priority information with the help of sensors using these smart power management devices.
Over the next few years, the security solutions segment of the IoT device management market is expected to acquire more than 60.6% of the market share. Security solutions for connected devices are becoming popular on the market. Furthermore, high efficiency in device monitoring, diagnostics, and analytics are among the benefits provided by the technology.
Given the expanding digitalization of the healthcare sector, the smart health area is expected to rise by 25% by 2028. IoT is revolutionizing the healthcare industry by redefining the area of medical devices and healthcare solutions. Additionally, in the healthcare industry, IoT device management solutions provide benefits such as remote patient monitoring, end-to-end connectivity, data analysis, automatic alerts, and medical support.
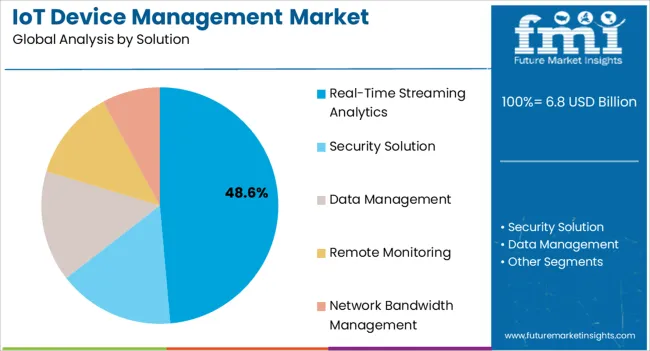
Real-time streaming analytics account for the 29.8% share of the IoT device management market. The majority of companies are concentrating on real-time streaming by processing and combining data from various sources. Real-time analysis, for example, can be used to remotely monitor patients in the healthcare industry. Furthermore, by providing patients with real-time data and prompt responses to their queries, the quality of care can be improved. This is positively influencing the market outlook.
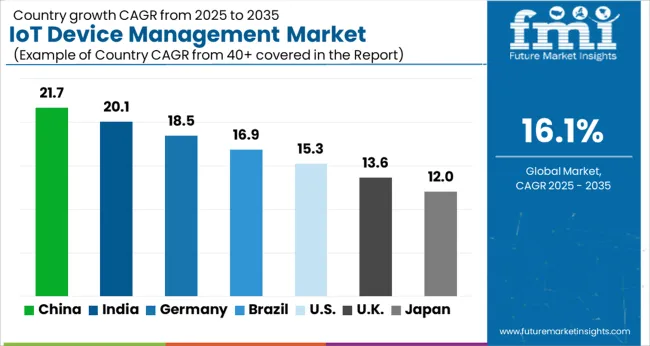
North America is a prominent hub in the global market capturing a significant share of 28.6% of the global market. Growing investments in IoT technology and favorable government efforts are expected to propel the North America market to USD 2 billion in sales by 2028.
The presence of key IoT device management businesses such as Google LLC, PTC Inc, and others is boosting the regional IoT device management market growth.
The United Kingdom is growing at a transforming rate of 17.2% during the analysis period. The increase can be ascribed to the growing adoption of the Bring Your Own Device (BYOD) trend and the deployment of a mobile workforce across the country. The need for private cloud solutions has surged during COVID-19, owing to an increase in the number of cyberattacks.
Private clouds offer sophisticated privacy and security measures to secure sensitive and personal information. The IoT device management industry statistics are backed up by significant cost reductions, flexibility, and ease of control.
India is set to become a notable market in the world, recording a CAGR of 19.2% between 2023 and 2033. India has emerged as a significant player in the IoT (Internet of Things) device management market. IoT device management involves the monitoring, provisioning, and maintenance of IoT devices deployed in various industries.
With the growing adoption of IoT devices across sectors such as manufacturing, healthcare, agriculture, transportation, and smart cities, India has recognized the potential of IoT and has been actively participating in its development.
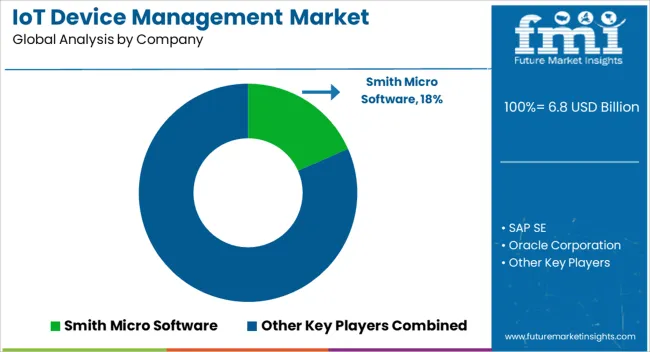
The market for IoT device management is competitive. The growing adoption of IoT across industries has resulted in a surge in several opportunities available. Though the market is now dominated by a few key players, it is projected to see numerous new players enter as the breadth of IoT applications across industries grows.
The majority of vendors engage in various marketing methods to increase their share. Vendors in the industry are competing on price, quality, brand, and product & service differentiation, while minor companies are acquired to ensure a global leadership position in IoT device management services. Furthermore, participants in the sector are forging strategic alliances to develop a sophisticated and integrated IoT device management platform. For example,
Table 1: Global Market Value (US$ Million) Forecast by Region, 2018 to 2033
Table 2: Global Market Value (US$ Million) Forecast by Component, 2018 to 2033
Table 3: Global Market Value (US$ Million) Forecast by Solution, 2018 to 2033
Table 4: Global Market Value (US$ Million) Forecast by Service, 2018 to 2033
Table 5: Global Market Value (US$ Million) Forecast by Organization Size, 2018 to 2033
Table 6: Global Market Value (US$ Million) Forecast by Deployment, 2018 to 2033
Table 7: Global Market Value (US$ Million) Forecast by Application, 2018 to 2033
Table 8: North America Market Value (US$ Million) Forecast by Country, 2018 to 2033
Table 9: North America Market Value (US$ Million) Forecast by Component, 2018 to 2033
Table 10: North America Market Value (US$ Million) Forecast by Solution, 2018 to 2033
Table 11: North America Market Value (US$ Million) Forecast by Service, 2018 to 2033
Table 12: North America Market Value (US$ Million) Forecast by Organization Size, 2018 to 2033
Table 13: North America Market Value (US$ Million) Forecast by Deployment, 2018 to 2033
Table 14: North America Market Value (US$ Million) Forecast by Application, 2018 to 2033
Table 15: Latin America Market Value (US$ Million) Forecast by Country, 2018 to 2033
Table 16: Latin America Market Value (US$ Million) Forecast by Component, 2018 to 2033
Table 17: Latin America Market Value (US$ Million) Forecast by Solution, 2018 to 2033
Table 18: Latin America Market Value (US$ Million) Forecast by Service, 2018 to 2033
Table 19: Latin America Market Value (US$ Million) Forecast by Organization Size, 2018 to 2033
Table 20: Latin America Market Value (US$ Million) Forecast by Deployment, 2018 to 2033
Table 21: Latin America Market Value (US$ Million) Forecast by Application, 2018 to 2033
Table 22: Europe Market Value (US$ Million) Forecast by Country, 2018 to 2033
Table 23: Europe Market Value (US$ Million) Forecast by Component, 2018 to 2033
Table 24: Europe Market Value (US$ Million) Forecast by Solution, 2018 to 2033
Table 25: Europe Market Value (US$ Million) Forecast by Service, 2018 to 2033
Table 26: Europe Market Value (US$ Million) Forecast by Organization Size, 2018 to 2033
Table 27: Europe Market Value (US$ Million) Forecast by Deployment, 2018 to 2033
Table 28: Europe Market Value (US$ Million) Forecast by Application, 2018 to 2033
Table 29: South Asia Market Value (US$ Million) Forecast by Country, 2018 to 2033
Table 30: South Asia Market Value (US$ Million) Forecast by Component, 2018 to 2033
Table 31: South Asia Market Value (US$ Million) Forecast by Solution, 2018 to 2033
Table 32: South Asia Market Value (US$ Million) Forecast by Service, 2018 to 2033
Table 33: South Asia Market Value (US$ Million) Forecast by Organization Size, 2018 to 2033
Table 34: South Asia Market Value (US$ Million) Forecast by Deployment, 2018 to 2033
Table 35: South Asia Market Value (US$ Million) Forecast by Application, 2018 to 2033
Table 36: East Asia Market Value (US$ Million) Forecast by Country, 2018 to 2033
Table 37: East Asia Market Value (US$ Million) Forecast by Component, 2018 to 2033
Table 38: East Asia Market Value (US$ Million) Forecast by Solution, 2018 to 2033
Table 39: East Asia Market Value (US$ Million) Forecast by Service, 2018 to 2033
Table 40: East Asia Market Value (US$ Million) Forecast by Organization Size, 2018 to 2033
Table 41: East Asia Market Value (US$ Million) Forecast by Deployment, 2018 to 2033
Table 42: East Asia Market Value (US$ Million) Forecast by Application, 2018 to 2033
Table 43: Oceania Market Value (US$ Million) Forecast by Country, 2018 to 2033
Table 44: Oceania Market Value (US$ Million) Forecast by Component, 2018 to 2033
Table 45: Oceania Market Value (US$ Million) Forecast by Solution, 2018 to 2033
Table 46: Oceania Market Value (US$ Million) Forecast by Service, 2018 to 2033
Table 47: Oceania Market Value (US$ Million) Forecast by Organization Size, 2018 to 2033
Table 48: Oceania Market Value (US$ Million) Forecast by Deployment, 2018 to 2033
Table 49: Oceania Market Value (US$ Million) Forecast by Application, 2018 to 2033
Table 50: MEA Market Value (US$ Million) Forecast by Country, 2018 to 2033
Table 51: MEA Market Value (US$ Million) Forecast by Component, 2018 to 2033
Table 52: MEA Market Value (US$ Million) Forecast by Solution, 2018 to 2033
Table 53: MEA Market Value (US$ Million) Forecast by Service, 2018 to 2033
Table 54: MEA Market Value (US$ Million) Forecast by Organization Size, 2018 to 2033
Table 55: MEA Market Value (US$ Million) Forecast by Deployment, 2018 to 2033
Table 56: MEA Market Value (US$ Million) Forecast by Application, 2018 to 2033
Figure 1: Global Market Value (US$ Million) by Component, 2023 to 2033
Figure 2: Global Market Value (US$ Million) by Solution, 2023 to 2033
Figure 3: Global Market Value (US$ Million) by Service, 2023 to 2033
Figure 4: Global Market Value (US$ Million) by Organization Size, 2023 to 2033
Figure 5: Global Market Value (US$ Million) by Deployment, 2023 to 2033
Figure 6: Global Market Value (US$ Million) by Application, 2023 to 2033
Figure 7: Global Market Value (US$ Million) by Region, 2023 to 2033
Figure 8: Global Market Value (US$ Million) Analysis by Region, 2018 to 2033
Figure 9: Global Market Value Share (%) and BPS Analysis by Region, 2023 to 2033
Figure 10: Global Market Y-o-Y Growth (%) Projections by Region, 2023 to 2033
Figure 11: Global Market Value (US$ Million) Analysis by Component, 2018 to 2033
Figure 12: Global Market Value Share (%) and BPS Analysis by Component, 2023 to 2033
Figure 13: Global Market Y-o-Y Growth (%) Projections by Component, 2023 to 2033
Figure 14: Global Market Value (US$ Million) Analysis by Solution, 2018 to 2033
Figure 15: Global Market Value Share (%) and BPS Analysis by Solution, 2023 to 2033
Figure 16: Global Market Y-o-Y Growth (%) Projections by Solution, 2023 to 2033
Figure 17: Global Market Value (US$ Million) Analysis by Service, 2018 to 2033
Figure 18: Global Market Value Share (%) and BPS Analysis by Service, 2023 to 2033
Figure 19: Global Market Y-o-Y Growth (%) Projections by Service, 2023 to 2033
Figure 20: Global Market Value (US$ Million) Analysis by Organization Size, 2018 to 2033
Figure 21: Global Market Value Share (%) and BPS Analysis by Organization Size, 2023 to 2033
Figure 22: Global Market Y-o-Y Growth (%) Projections by Organization Size, 2023 to 2033
Figure 23: Global Market Value (US$ Million) Analysis by Deployment, 2018 to 2033
Figure 24: Global Market Value Share (%) and BPS Analysis by Deployment, 2023 to 2033
Figure 25: Global Market Y-o-Y Growth (%) Projections by Deployment, 2023 to 2033
Figure 26: Global Market Value (US$ Million) Analysis by Application, 2018 to 2033
Figure 27: Global Market Value Share (%) and BPS Analysis by Application, 2023 to 2033
Figure 28: Global Market Y-o-Y Growth (%) Projections by Application, 2023 to 2033
Figure 29: Global Market Attractiveness by Component, 2023 to 2033
Figure 30: Global Market Attractiveness by Solution, 2023 to 2033
Figure 31: Global Market Attractiveness by Service, 2023 to 2033
Figure 32: Global Market Attractiveness by Organization Size, 2023 to 2033
Figure 33: Global Market Attractiveness by Deployment, 2023 to 2033
Figure 34: Global Market Attractiveness by Application, 2023 to 2033
Figure 35: Global Market Attractiveness by Region, 2023 to 2033
Figure 36: North America Market Value (US$ Million) by Component, 2023 to 2033
Figure 37: North America Market Value (US$ Million) by Solution, 2023 to 2033
Figure 38: North America Market Value (US$ Million) by Service, 2023 to 2033
Figure 39: North America Market Value (US$ Million) by Organization Size, 2023 to 2033
Figure 40: North America Market Value (US$ Million) by Deployment, 2023 to 2033
Figure 41: North America Market Value (US$ Million) by Application, 2023 to 2033
Figure 42: North America Market Value (US$ Million) by Country, 2023 to 2033
Figure 43: North America Market Value (US$ Million) Analysis by Country, 2018 to 2033
Figure 44: North America Market Value Share (%) and BPS Analysis by Country, 2023 to 2033
Figure 45: North America Market Y-o-Y Growth (%) Projections by Country, 2023 to 2033
Figure 46: North America Market Value (US$ Million) Analysis by Component, 2018 to 2033
Figure 47: North America Market Value Share (%) and BPS Analysis by Component, 2023 to 2033
Figure 48: North America Market Y-o-Y Growth (%) Projections by Component, 2023 to 2033
Figure 49: North America Market Value (US$ Million) Analysis by Solution, 2018 to 2033
Figure 50: North America Market Value Share (%) and BPS Analysis by Solution, 2023 to 2033
Figure 51: North America Market Y-o-Y Growth (%) Projections by Solution, 2023 to 2033
Figure 52: North America Market Value (US$ Million) Analysis by Service, 2018 to 2033
Figure 53: North America Market Value Share (%) and BPS Analysis by Service, 2023 to 2033
Figure 54: North America Market Y-o-Y Growth (%) Projections by Service, 2023 to 2033
Figure 55: North America Market Value (US$ Million) Analysis by Organization Size, 2018 to 2033
Figure 56: North America Market Value Share (%) and BPS Analysis by Organization Size, 2023 to 2033
Figure 57: North America Market Y-o-Y Growth (%) Projections by Organization Size, 2023 to 2033
Figure 58: North America Market Value (US$ Million) Analysis by Deployment, 2018 to 2033
Figure 59: North America Market Value Share (%) and BPS Analysis by Deployment, 2023 to 2033
Figure 60: North America Market Y-o-Y Growth (%) Projections by Deployment, 2023 to 2033
Figure 61: North America Market Value (US$ Million) Analysis by Application, 2018 to 2033
Figure 62: North America Market Value Share (%) and BPS Analysis by Application, 2023 to 2033
Figure 63: North America Market Y-o-Y Growth (%) Projections by Application, 2023 to 2033
Figure 64: North America Market Attractiveness by Component, 2023 to 2033
Figure 65: North America Market Attractiveness by Solution, 2023 to 2033
Figure 66: North America Market Attractiveness by Service, 2023 to 2033
Figure 67: North America Market Attractiveness by Organization Size, 2023 to 2033
Figure 68: North America Market Attractiveness by Deployment, 2023 to 2033
Figure 69: North America Market Attractiveness by Application, 2023 to 2033
Figure 70: North America Market Attractiveness by Country, 2023 to 2033
Figure 71: Latin America Market Value (US$ Million) by Component, 2023 to 2033
Figure 72: Latin America Market Value (US$ Million) by Solution, 2023 to 2033
Figure 73: Latin America Market Value (US$ Million) by Service, 2023 to 2033
Figure 74: Latin America Market Value (US$ Million) by Organization Size, 2023 to 2033
Figure 75: Latin America Market Value (US$ Million) by Deployment, 2023 to 2033
Figure 76: Latin America Market Value (US$ Million) by Application, 2023 to 2033
Figure 77: Latin America Market Value (US$ Million) by Country, 2023 to 2033
Figure 78: Latin America Market Value (US$ Million) Analysis by Country, 2018 to 2033
Figure 79: Latin America Market Value Share (%) and BPS Analysis by Country, 2023 to 2033
Figure 80: Latin America Market Y-o-Y Growth (%) Projections by Country, 2023 to 2033
Figure 81: Latin America Market Value (US$ Million) Analysis by Component, 2018 to 2033
Figure 82: Latin America Market Value Share (%) and BPS Analysis by Component, 2023 to 2033
Figure 83: Latin America Market Y-o-Y Growth (%) Projections by Component, 2023 to 2033
Figure 84: Latin America Market Value (US$ Million) Analysis by Solution, 2018 to 2033
Figure 85: Latin America Market Value Share (%) and BPS Analysis by Solution, 2023 to 2033
Figure 86: Latin America Market Y-o-Y Growth (%) Projections by Solution, 2023 to 2033
Figure 87: Latin America Market Value (US$ Million) Analysis by Service, 2018 to 2033
Figure 88: Latin America Market Value Share (%) and BPS Analysis by Service, 2023 to 2033
Figure 89: Latin America Market Y-o-Y Growth (%) Projections by Service, 2023 to 2033
Figure 90: Latin America Market Value (US$ Million) Analysis by Organization Size, 2018 to 2033
Figure 91: Latin America Market Value Share (%) and BPS Analysis by Organization Size, 2023 to 2033
Figure 92: Latin America Market Y-o-Y Growth (%) Projections by Organization Size, 2023 to 2033
Figure 93: Latin America Market Value (US$ Million) Analysis by Deployment, 2018 to 2033
Figure 94: Latin America Market Value Share (%) and BPS Analysis by Deployment, 2023 to 2033
Figure 95: Latin America Market Y-o-Y Growth (%) Projections by Deployment, 2023 to 2033
Figure 96: Latin America Market Value (US$ Million) Analysis by Application, 2018 to 2033
Figure 97: Latin America Market Value Share (%) and BPS Analysis by Application, 2023 to 2033
Figure 98: Latin America Market Y-o-Y Growth (%) Projections by Application, 2023 to 2033
Figure 99: Latin America Market Attractiveness by Component, 2023 to 2033
Figure 100: Latin America Market Attractiveness by Solution, 2023 to 2033
Figure 101: Latin America Market Attractiveness by Service, 2023 to 2033
Figure 102: Latin America Market Attractiveness by Organization Size, 2023 to 2033
Figure 103: Latin America Market Attractiveness by Deployment, 2023 to 2033
Figure 104: Latin America Market Attractiveness by Application, 2023 to 2033
Figure 105: Latin America Market Attractiveness by Country, 2023 to 2033
Figure 106: Europe Market Value (US$ Million) by Component, 2023 to 2033
Figure 107: Europe Market Value (US$ Million) by Solution, 2023 to 2033
Figure 108: Europe Market Value (US$ Million) by Service, 2023 to 2033
Figure 109: Europe Market Value (US$ Million) by Organization Size, 2023 to 2033
Figure 110: Europe Market Value (US$ Million) by Deployment, 2023 to 2033
Figure 111: Europe Market Value (US$ Million) by Application, 2023 to 2033
Figure 112: Europe Market Value (US$ Million) by Country, 2023 to 2033
Figure 113: Europe Market Value (US$ Million) Analysis by Country, 2018 to 2033
Figure 114: Europe Market Value Share (%) and BPS Analysis by Country, 2023 to 2033
Figure 115: Europe Market Y-o-Y Growth (%) Projections by Country, 2023 to 2033
Figure 116: Europe Market Value (US$ Million) Analysis by Component, 2018 to 2033
Figure 117: Europe Market Value Share (%) and BPS Analysis by Component, 2023 to 2033
Figure 118: Europe Market Y-o-Y Growth (%) Projections by Component, 2023 to 2033
Figure 119: Europe Market Value (US$ Million) Analysis by Solution, 2018 to 2033
Figure 120: Europe Market Value Share (%) and BPS Analysis by Solution, 2023 to 2033
Figure 121: Europe Market Y-o-Y Growth (%) Projections by Solution, 2023 to 2033
Figure 122: Europe Market Value (US$ Million) Analysis by Service, 2018 to 2033
Figure 123: Europe Market Value Share (%) and BPS Analysis by Service, 2023 to 2033
Figure 124: Europe Market Y-o-Y Growth (%) Projections by Service, 2023 to 2033
Figure 125: Europe Market Value (US$ Million) Analysis by Organization Size, 2018 to 2033
Figure 126: Europe Market Value Share (%) and BPS Analysis by Organization Size, 2023 to 2033
Figure 127: Europe Market Y-o-Y Growth (%) Projections by Organization Size, 2023 to 2033
Figure 128: Europe Market Value (US$ Million) Analysis by Deployment, 2018 to 2033
Figure 129: Europe Market Value Share (%) and BPS Analysis by Deployment, 2023 to 2033
Figure 130: Europe Market Y-o-Y Growth (%) Projections by Deployment, 2023 to 2033
Figure 131: Europe Market Value (US$ Million) Analysis by Application, 2018 to 2033
Figure 132: Europe Market Value Share (%) and BPS Analysis by Application, 2023 to 2033
Figure 133: Europe Market Y-o-Y Growth (%) Projections by Application, 2023 to 2033
Figure 134: Europe Market Attractiveness by Component, 2023 to 2033
Figure 135: Europe Market Attractiveness by Solution, 2023 to 2033
Figure 136: Europe Market Attractiveness by Service, 2023 to 2033
Figure 137: Europe Market Attractiveness by Organization Size, 2023 to 2033
Figure 138: Europe Market Attractiveness by Deployment, 2023 to 2033
Figure 139: Europe Market Attractiveness by Application, 2023 to 2033
Figure 140: Europe Market Attractiveness by Country, 2023 to 2033
Figure 141: South Asia Market Value (US$ Million) by Component, 2023 to 2033
Figure 142: South Asia Market Value (US$ Million) by Solution, 2023 to 2033
Figure 143: South Asia Market Value (US$ Million) by Service, 2023 to 2033
Figure 144: South Asia Market Value (US$ Million) by Organization Size, 2023 to 2033
Figure 145: South Asia Market Value (US$ Million) by Deployment, 2023 to 2033
Figure 146: South Asia Market Value (US$ Million) by Application, 2023 to 2033
Figure 147: South Asia Market Value (US$ Million) by Country, 2023 to 2033
Figure 148: South Asia Market Value (US$ Million) Analysis by Country, 2018 to 2033
Figure 149: South Asia Market Value Share (%) and BPS Analysis by Country, 2023 to 2033
Figure 150: South Asia Market Y-o-Y Growth (%) Projections by Country, 2023 to 2033
Figure 151: South Asia Market Value (US$ Million) Analysis by Component, 2018 to 2033
Figure 152: South Asia Market Value Share (%) and BPS Analysis by Component, 2023 to 2033
Figure 153: South Asia Market Y-o-Y Growth (%) Projections by Component, 2023 to 2033
Figure 154: South Asia Market Value (US$ Million) Analysis by Solution, 2018 to 2033
Figure 155: South Asia Market Value Share (%) and BPS Analysis by Solution, 2023 to 2033
Figure 156: South Asia Market Y-o-Y Growth (%) Projections by Solution, 2023 to 2033
Figure 157: South Asia Market Value (US$ Million) Analysis by Service, 2018 to 2033
Figure 158: South Asia Market Value Share (%) and BPS Analysis by Service, 2023 to 2033
Figure 159: South Asia Market Y-o-Y Growth (%) Projections by Service, 2023 to 2033
Figure 160: South Asia Market Value (US$ Million) Analysis by Organization Size, 2018 to 2033
Figure 161: South Asia Market Value Share (%) and BPS Analysis by Organization Size, 2023 to 2033
Figure 162: South Asia Market Y-o-Y Growth (%) Projections by Organization Size, 2023 to 2033
Figure 163: South Asia Market Value (US$ Million) Analysis by Deployment, 2018 to 2033
Figure 164: South Asia Market Value Share (%) and BPS Analysis by Deployment, 2023 to 2033
Figure 165: South Asia Market Y-o-Y Growth (%) Projections by Deployment, 2023 to 2033
Figure 166: South Asia Market Value (US$ Million) Analysis by Application, 2018 to 2033
Figure 167: South Asia Market Value Share (%) and BPS Analysis by Application, 2023 to 2033
Figure 168: South Asia Market Y-o-Y Growth (%) Projections by Application, 2023 to 2033
Figure 169: South Asia Market Attractiveness by Component, 2023 to 2033
Figure 170: South Asia Market Attractiveness by Solution, 2023 to 2033
Figure 171: South Asia Market Attractiveness by Service, 2023 to 2033
Figure 172: South Asia Market Attractiveness by Organization Size, 2023 to 2033
Figure 173: South Asia Market Attractiveness by Deployment, 2023 to 2033
Figure 174: South Asia Market Attractiveness by Application, 2023 to 2033
Figure 175: South Asia Market Attractiveness by Country, 2023 to 2033
Figure 176: East Asia Market Value (US$ Million) by Component, 2023 to 2033
Figure 177: East Asia Market Value (US$ Million) by Solution, 2023 to 2033
Figure 178: East Asia Market Value (US$ Million) by Service, 2023 to 2033
Figure 179: East Asia Market Value (US$ Million) by Organization Size, 2023 to 2033
Figure 180: East Asia Market Value (US$ Million) by Deployment, 2023 to 2033
Figure 181: East Asia Market Value (US$ Million) by Application, 2023 to 2033
Figure 182: East Asia Market Value (US$ Million) by Country, 2023 to 2033
Figure 183: East Asia Market Value (US$ Million) Analysis by Country, 2018 to 2033
Figure 184: East Asia Market Value Share (%) and BPS Analysis by Country, 2023 to 2033
Figure 185: East Asia Market Y-o-Y Growth (%) Projections by Country, 2023 to 2033
Figure 186: East Asia Market Value (US$ Million) Analysis by Component, 2018 to 2033
Figure 187: East Asia Market Value Share (%) and BPS Analysis by Component, 2023 to 2033
Figure 188: East Asia Market Y-o-Y Growth (%) Projections by Component, 2023 to 2033
Figure 189: East Asia Market Value (US$ Million) Analysis by Solution, 2018 to 2033
Figure 190: East Asia Market Value Share (%) and BPS Analysis by Solution, 2023 to 2033
Figure 191: East Asia Market Y-o-Y Growth (%) Projections by Solution, 2023 to 2033
Figure 192: East Asia Market Value (US$ Million) Analysis by Service, 2018 to 2033
Figure 193: East Asia Market Value Share (%) and BPS Analysis by Service, 2023 to 2033
Figure 194: East Asia Market Y-o-Y Growth (%) Projections by Service, 2023 to 2033
Figure 195: East Asia Market Value (US$ Million) Analysis by Organization Size, 2018 to 2033
Figure 196: East Asia Market Value Share (%) and BPS Analysis by Organization Size, 2023 to 2033
Figure 197: East Asia Market Y-o-Y Growth (%) Projections by Organization Size, 2023 to 2033
Figure 198: East Asia Market Value (US$ Million) Analysis by Deployment, 2018 to 2033
Figure 199: East Asia Market Value Share (%) and BPS Analysis by Deployment, 2023 to 2033
Figure 200: East Asia Market Y-o-Y Growth (%) Projections by Deployment, 2023 to 2033
Figure 201: East Asia Market Value (US$ Million) Analysis by Application, 2018 to 2033
Figure 202: East Asia Market Value Share (%) and BPS Analysis by Application, 2023 to 2033
Figure 203: East Asia Market Y-o-Y Growth (%) Projections by Application, 2023 to 2033
Figure 204: East Asia Market Attractiveness by Component, 2023 to 2033
Figure 205: East Asia Market Attractiveness by Solution, 2023 to 2033
Figure 206: East Asia Market Attractiveness by Service, 2023 to 2033
Figure 207: East Asia Market Attractiveness by Organization Size, 2023 to 2033
Figure 208: East Asia Market Attractiveness by Deployment, 2023 to 2033
Figure 209: East Asia Market Attractiveness by Application, 2023 to 2033
Figure 210: East Asia Market Attractiveness by Country, 2023 to 2033
Figure 211: Oceania Market Value (US$ Million) by Component, 2023 to 2033
Figure 212: Oceania Market Value (US$ Million) by Solution, 2023 to 2033
Figure 213: Oceania Market Value (US$ Million) by Service, 2023 to 2033
Figure 214: Oceania Market Value (US$ Million) by Organization Size, 2023 to 2033
Figure 215: Oceania Market Value (US$ Million) by Deployment, 2023 to 2033
Figure 216: Oceania Market Value (US$ Million) by Application, 2023 to 2033
Figure 217: Oceania Market Value (US$ Million) by Country, 2023 to 2033
Figure 218: Oceania Market Value (US$ Million) Analysis by Country, 2018 to 2033
Figure 219: Oceania Market Value Share (%) and BPS Analysis by Country, 2023 to 2033
Figure 220: Oceania Market Y-o-Y Growth (%) Projections by Country, 2023 to 2033
Figure 221: Oceania Market Value (US$ Million) Analysis by Component, 2018 to 2033
Figure 222: Oceania Market Value Share (%) and BPS Analysis by Component, 2023 to 2033
Figure 223: Oceania Market Y-o-Y Growth (%) Projections by Component, 2023 to 2033
Figure 224: Oceania Market Value (US$ Million) Analysis by Solution, 2018 to 2033
Figure 225: Oceania Market Value Share (%) and BPS Analysis by Solution, 2023 to 2033
Figure 226: Oceania Market Y-o-Y Growth (%) Projections by Solution, 2023 to 2033
Figure 227: Oceania Market Value (US$ Million) Analysis by Service, 2018 to 2033
Figure 228: Oceania Market Value Share (%) and BPS Analysis by Service, 2023 to 2033
Figure 229: Oceania Market Y-o-Y Growth (%) Projections by Service, 2023 to 2033
Figure 230: Oceania Market Value (US$ Million) Analysis by Organization Size, 2018 to 2033
Figure 231: Oceania Market Value Share (%) and BPS Analysis by Organization Size, 2023 to 2033
Figure 232: Oceania Market Y-o-Y Growth (%) Projections by Organization Size, 2023 to 2033
Figure 233: Oceania Market Value (US$ Million) Analysis by Deployment, 2018 to 2033
Figure 234: Oceania Market Value Share (%) and BPS Analysis by Deployment, 2023 to 2033
Figure 235: Oceania Market Y-o-Y Growth (%) Projections by Deployment, 2023 to 2033
Figure 236: Oceania Market Value (US$ Million) Analysis by Application, 2018 to 2033
Figure 237: Oceania Market Value Share (%) and BPS Analysis by Application, 2023 to 2033
Figure 238: Oceania Market Y-o-Y Growth (%) Projections by Application, 2023 to 2033
Figure 239: Oceania Market Attractiveness by Component, 2023 to 2033
Figure 240: Oceania Market Attractiveness by Solution, 2023 to 2033
Figure 241: Oceania Market Attractiveness by Service, 2023 to 2033
Figure 242: Oceania Market Attractiveness by Organization Size, 2023 to 2033
Figure 243: Oceania Market Attractiveness by Deployment, 2023 to 2033
Figure 244: Oceania Market Attractiveness by Application, 2023 to 2033
Figure 245: Oceania Market Attractiveness by Country, 2023 to 2033
Figure 246: MEA Market Value (US$ Million) by Component, 2023 to 2033
Figure 247: MEA Market Value (US$ Million) by Solution, 2023 to 2033
Figure 248: MEA Market Value (US$ Million) by Service, 2023 to 2033
Figure 249: MEA Market Value (US$ Million) by Organization Size, 2023 to 2033
Figure 250: MEA Market Value (US$ Million) by Deployment, 2023 to 2033
Figure 251: MEA Market Value (US$ Million) by Application, 2023 to 2033
Figure 252: MEA Market Value (US$ Million) by Country, 2023 to 2033
Figure 253: MEA Market Value (US$ Million) Analysis by Country, 2018 to 2033
Figure 254: MEA Market Value Share (%) and BPS Analysis by Country, 2023 to 2033
Figure 255: MEA Market Y-o-Y Growth (%) Projections by Country, 2023 to 2033
Figure 256: MEA Market Value (US$ Million) Analysis by Component, 2018 to 2033
Figure 257: MEA Market Value Share (%) and BPS Analysis by Component, 2023 to 2033
Figure 258: MEA Market Y-o-Y Growth (%) Projections by Component, 2023 to 2033
Figure 259: MEA Market Value (US$ Million) Analysis by Solution, 2018 to 2033
Figure 260: MEA Market Value Share (%) and BPS Analysis by Solution, 2023 to 2033
Figure 261: MEA Market Y-o-Y Growth (%) Projections by Solution, 2023 to 2033
Figure 262: MEA Market Value (US$ Million) Analysis by Service, 2018 to 2033
Figure 263: MEA Market Value Share (%) and BPS Analysis by Service, 2023 to 2033
Figure 264: MEA Market Y-o-Y Growth (%) Projections by Service, 2023 to 2033
Figure 265: MEA Market Value (US$ Million) Analysis by Organization Size, 2018 to 2033
Figure 266: MEA Market Value Share (%) and BPS Analysis by Organization Size, 2023 to 2033
Figure 267: MEA Market Y-o-Y Growth (%) Projections by Organization Size, 2023 to 2033
Figure 268: MEA Market Value (US$ Million) Analysis by Deployment, 2018 to 2033
Figure 269: MEA Market Value Share (%) and BPS Analysis by Deployment, 2023 to 2033
Figure 270: MEA Market Y-o-Y Growth (%) Projections by Deployment, 2023 to 2033
Figure 271: MEA Market Value (US$ Million) Analysis by Application, 2018 to 2033
Figure 272: MEA Market Value Share (%) and BPS Analysis by Application, 2023 to 2033
Figure 273: MEA Market Y-o-Y Growth (%) Projections by Application, 2023 to 2033
Figure 274: MEA Market Attractiveness by Component, 2023 to 2033
Figure 275: MEA Market Attractiveness by Solution, 2023 to 2033
Figure 276: MEA Market Attractiveness by Service, 2023 to 2033
Figure 277: MEA Market Attractiveness by Organization Size, 2023 to 2033
Figure 278: MEA Market Attractiveness by Deployment, 2023 to 2033
Figure 279: MEA Market Attractiveness by Application, 2023 to 2033
Figure 280: MEA Market Attractiveness by Country, 2023 to 2033
The market may create a revenue of around USD 4,965.4 million in 2023.
In North America the net worth of the total IoT device management adopted in 2022 was 28.6% of the global market.
India is the leading market and is expected to grow at 19.2% CAGR until 2033.
The security solutions segment dominates and could hold 60.6% of the global market share.
The real-time streaming analytics segment accounted for 29.8% of the market share.
Explore Similar Insights
Thank you!
You will receive an email from our Business Development Manager. Please be sure to check your SPAM/JUNK folder too.