The Intrusion Detection System Market is estimated to be valued at USD 6.8 billion in 2025 and is projected to reach USD 22.2 billion by 2035, registering a compound annual growth rate (CAGR) of 12.5% over the forecast period.
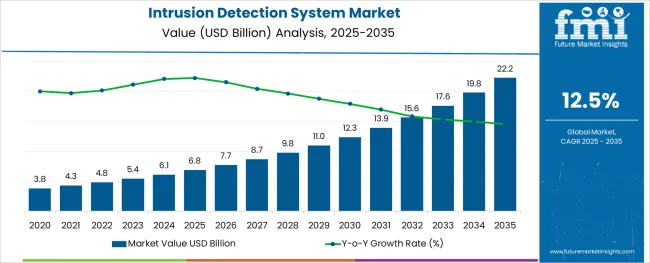
The intrusion detection system market is evolving rapidly due to the rising complexity of cyber threats, stricter compliance mandates, and growing reliance on digital infrastructure. Increased digital transformation across industries has heightened the risk of security breaches, making real-time detection systems a critical investment.
Enterprises are focusing on early threat detection to mitigate financial loss, reputational damage, and regulatory penalties. Technological advancements in anomaly detection, AI-based threat analysis, and integration with broader cybersecurity platforms are enhancing the precision and responsiveness of intrusion detection systems.
Additionally, hybrid IT environments and multi-cloud deployments are driving demand for flexible, scalable detection architectures. The outlook remains strong, supported by increased cybersecurity budgets and government focus on infrastructure security, particularly in sectors such as BFSI, defense, healthcare, and telecom.
The market is segmented by Type, Deployment Type, and Service and region. By Type, the market is divided into Network-Based Intrusion Detection System (NIDS) and Host Based Intrusion Detection System (HIDS). In terms of Deployment Type, the market is classified into On-Premises Deployment and Cloud Deployment.
Based on Service, the market is segmented into Managed Services, Design and Integration Services, Training & Education, and Consultancy Services. Regionally, the market is classified into North America, Latin America, Western Europe, Eastern Europe, Balkan & Baltic Countries, Russia & Belarus, Central Asia, East Asia, South Asia & Pacific, and the Middle East & Africa.
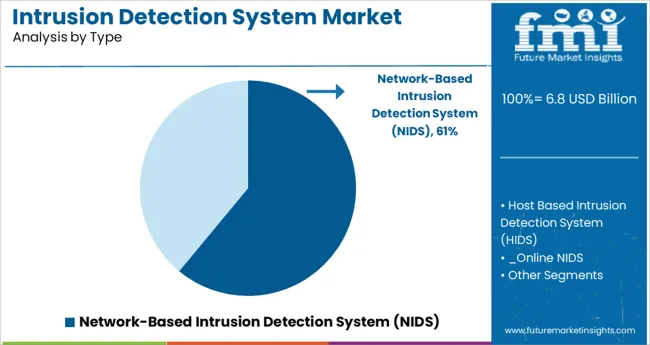
Network-based intrusion detection systems (NIDS) are projected to contribute 61.0% of the total revenue share in 2025, making them the dominant system type in the market. Their ability to monitor multiple devices and data flows without needing endpoint integration has supported wide-scale adoption across enterprise and service provider networks.
The rising sophistication of network-level attacks and the need for non-intrusive, scalable security solutions have reinforced the role of NIDS in centralized cybersecurity frameworks. Enhanced packet inspection capabilities, integration with SIEM tools, and improved signature-based and anomaly detection techniques are boosting system performance.
Their deployment across high-traffic segments such as financial services and telecom has further supported segment growth, offering comprehensive visibility and reduced overhead compared to host-based alternatives.
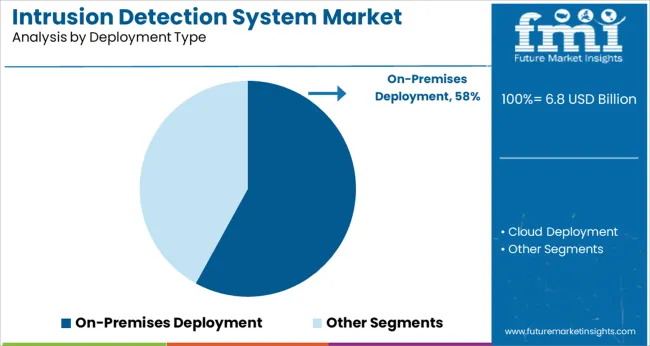
On-premises deployment is expected to account for 58.0% of the overall market revenue in 2025, positioning it as the leading deployment mode for intrusion detection systems. This preference is being driven by the need for greater control, data sovereignty, and compliance with regional data protection regulations.
Enterprises operating in heavily regulated sectors, such as defense, banking, and energy, continue to favor on-premises models to minimize third-party exposure and maintain full audit trails. Customization flexibility, direct network integration, and enhanced performance for real-time packet inspection are influencing this deployment choice.
As threat actors become more targeted and stealthy, organizations are investing in high-assurance, internally managed systems to ensure uninterrupted detection capabilities without reliance on public infrastructure.
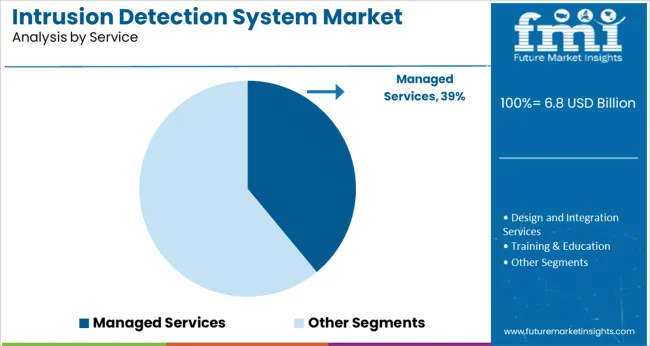
Managed services are projected to hold 39.0% of the intrusion detection system market share in 2025, making this the leading service model. Organizations are increasingly outsourcing security management to specialized service providers to address internal skill gaps and improve threat response time.
Managed service providers (MSPs) offer continuous monitoring, rapid threat intelligence updates, and incident response support, enabling enterprises to scale their security operations without significant internal resource allocation. The growing demand for round-the-clock detection, along with rising attack complexity, has made managed services a preferred approach for mid-sized firms and geographically distributed enterprises.
Additionally, bundled offerings combining IDS with other security services are contributing to adoption, especially as organizations seek end-to-end, cost-efficient protection across hybrid IT environments.
Based on region, North America is likely to hold a significant share of the global intrusion detection system market during the forecast period. Due to rising data security, threats, and government security in the region. In addition, the USA is likely to hold the maximum share of the market by establishing the IT sector, rising awareness, and growing security solutions during the forecast period. These factors are putting a positive impact on propelling market growth in the region. On the other hand, a growing number of terrorist organizations and hackers stealing nations' sensitive data are rising the adoption of intrusion detection systems in the region.
The Asia Pacific is contributing a key role as the fastest growing region in the intrusion detection system market by rising cyber attacks during the forecast period. In addition, the presence of IT infrastructure and rising cloud computing trends in the countries such as China and India are rising the market size. Moreover, due to the COVID-19 crisis, companies are shifting their company work to work from home. These things left the company to increase the adoption of the intrusion detection system in recent years. Rivals from other countries are attempting several attacks on secure data, and the nation's official evidence through cyber attacks are likely to rise the demand for intrusion detection system in the region.
Rising development in the global market is consolidated by key market players during the forecast period. These players are putting their efforts into growing the market and carrying out maximum output through their several advanced technologies. The key players focus on a particular product that drives consumers' demand as per their requirements and provides that product differently by adding advanced and innovative features to it.
The intrusion detection system is a new solution for detecting threats, malicious threats, and unauthorized activities in the system. However, the key manufacturers are making the best out of it and launching a product that attracts consumers' desire. Some of the key market strategies adopted by them are mergers, acquisitions, collaborations, and product launches, among others, during the forecast period. These essential tricks upsurge the market size and flourish the business globally.
The intrusion detection system is a device or software application that monitors and detects malicious activities or policy violations in networks. It has the potential to effectively generate alerts when any suspicious activity is detected.
The rapid rise in the number of cyberattacks such as ransomware and denial of service (DoS), in enterprises, has created a big space for the growth of the intrusion detection system market. These security breaches can result in the loss of confidential data and can incur heavy losses to businesses. As a result, business enterprises are increasingly adopting modern security technologies like intrusion detection systems to eliminate the threat of cyber-attacks and enhance their security.
Intrusion detection systems perform multiple functions in enterprises. It enables companies to monitor their system and user activities, analyze system configurations and vulnerabilities, track user policy violations, and assess file and system integrity.
Over the last few years, intrusion detection and prevention systems have gradually replaced traditional security systems due to their various attractive features. They can help the end users to improve their security systems or implement more effective controls.
The rapid expansion of end-use verticals such as telecommunication and defense, BSFI, etc. will continue to provide a strong thrust to the growth of the intrusion detection system market over the forecast period.
The rising incidence of cyberattacks, increasing investments by government and private organizations in IT security solutions, growing trends of BYOD devices, innovations in intrusion detection technology, and rising awareness among people regarding cyberattacks and their solutions are some of the major factors driving the global intrusion detection system market.
Intrusion detection has become an indispensable part of modern security systems across the world. It provides an effective means of detecting malware and threats before they can do any damage to the data or compromise a company's privacy.
As industries and businesses continue their march towards digitalization and automation, they are becoming more susceptible to cyberattacks. Over the last few years, there has been a substantial rise in the incidence of cyberattacks and data breaches. This rapid increase in the number of cyber threats and hacking attempts is emerging as a major factor stimulating the adoption of intrusion detection systems across industries and businesses. Deployment of these systems helps businesses to prevent data theft and data breaches.
Cyberattack has become a novel approach to combat in the modern world. Terrorist organizations, criminals, and hackers are using this method to either hack or steal the sensitive data of nations. This is prompting countries to adopt intrusion detection systems. Increasing investments by the government in developing and strengthening their cyber-attack defense is anticipated to boost the growth of the intrusion-detecting system market in the future.
Similarly, the growing trend of digitalization and the adoption of cloud computing, the internet of things (IoT), and artificial intelligence (AI) will further accelerate the adoption of intrusion detection systems during the forecast period.
Two types of intrusion systems are mostly used by business enterprises i.e., host-based intrusion detection systems (HIDS) and network-based intrusion detection systems (NIDS). HIDS can detect internal changes such as accidentally downloaded viruses by an employee while NIDS detects malicious packets as they enter into the company's network.
Despite its multiple benefits, demand for intrusion detection systems remains very low across various developing and underdeveloped regions. Some of the major factors that are currently restraining the growth of the intrusion detection system market are a lack of awareness and skilled security professionals, high costs, and a limited number of service providers in emerging economies. Moreover, intrusion detection systems are prone to false alarms, which is also limiting their adoption to some extent.
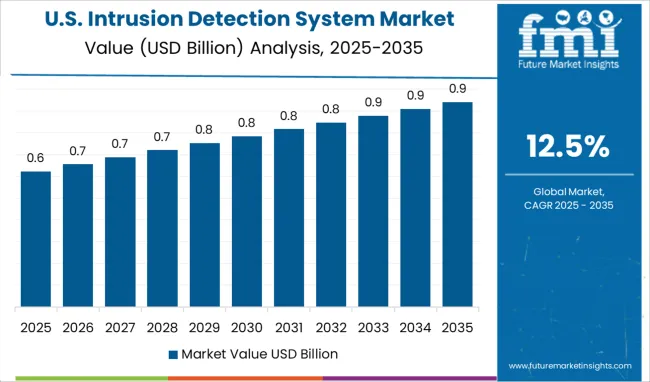
North America remains the most dominant market for intrusion detection systems and the trend is likely to continue in the future, owing to the rising spending on data safety & security by the government, the presence of a well-established IT industry, and increasing awareness among about security solutions.
Countries like the USA are experiencing high demand for intrusion detection systems due to an increase in the number of cyberattacks. These countries have claimed from time to time cyberattacks from rivals like Russia and China. The potential threat of cyber-attacks in these countries is acting as a catalyst for the growth of the intrusion detection system market.
Moreover, the abundant presence of leading intrusion detection system providers in these regions is positively impacting the market growth.
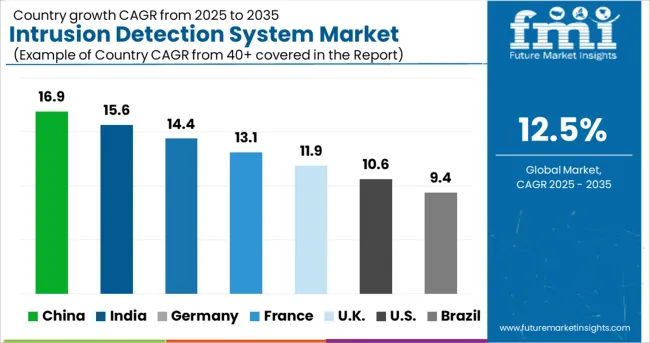
According to Future Market Insights, the Asia Pacific intrusion detection system market is poised to grow at a faster CAGR over the forecast period. Growth in the region is driven by expanding IT infrastructure, the growing trend of cloud computing, favorable government support, and the increasing adoption of modern security solutions by business enterprises.
Ever since the outbreak of the COVID-19 pandemic, various companies based in countries like China and India have shifted their business to remote working modes. This has left these companies vulnerable to cyberattacks and necessitated the adoption of security solutions such as intrusion detection systems.
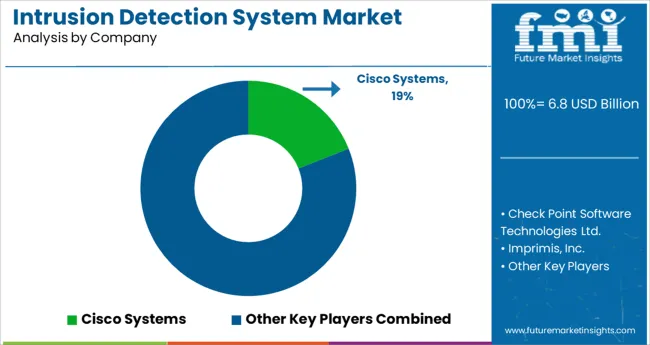
Some of the key participants present in the global intrusion detection system market include Tyco International Ltd., Corero Network Security, Inc., Robert Bosch LLC, Extreme Networks, Inc., Juniper Networks, Inc., McAfee, Inc, NSFOCUS, Inc., Nortek, Inc., and Allegion plc.
These key players are focusing on adopting advanced technologies for developing new security solutions that can significantly detect any type of malicious threats. Besides this, they are partnering and collaborating with end-use industries to expand their business.
| Report Attribute | Details |
|---|---|
| Base Year for Estimation | 2024 |
| Historical Data | 2020 to 2024 |
| Forecast Period | 2025 to 2035 |
| Quantitative Units | Revenue in USD Million and CAGR from 2025 to 2035 |
| Report Coverage | Revenue Forecast, Volume Forecast, Company Ranking, Competitive Landscape, Growth Factors, Trends, and Pricing Analysis |
| Segments Covered | Type, Deployment Type, Service, Region |
| Regions Covered | North America; Latin America; Western Europe; Eastern Europe; Asia Pacific; Middle East and Africa |
| Key Countries Profiled | USA, Canada, Brazil, Argentina, Germany, United Kingdom, France, Spain, Italy, Nordics, BENELUX, Australia & New Zealand, China, India, ASIAN, GCC Countries, South Africa |
| Key Companies Profiled | Tyco International Ltd.; Corero Network Security, Inc.; Robert Bosch LLC; Extreme Networks, Inc.; Juniper Networks, Inc.; McAfee, Inc; NSFOCUS, Inc.; Nortek, Inc.; Allegion plc |
| Customization | Available Upon Request |
The global intrusion detection system market is estimated to be valued at USD 6.8 billion in 2025.
It is projected to reach USD 22.2 billion by 2035.
The market is expected to grow at a 12.5% CAGR between 2025 and 2035.
The key product types are network-based intrusion detection system (nids), host based intrusion detection system (hids), _online nids and _off-line nids.
on-premises deployment segment is expected to dominate with a 58.0% industry share in 2025.


Our Research Products

The "Full Research Suite" delivers actionable market intel, deep dives on markets or technologies, so clients act faster, cut risk, and unlock growth.

The Leaderboard benchmarks and ranks top vendors, classifying them as Established Leaders, Leading Challengers, or Disruptors & Challengers.

Locates where complements amplify value and substitutes erode it, forecasting net impact by horizon

We deliver granular, decision-grade intel: market sizing, 5-year forecasts, pricing, adoption, usage, revenue, and operational KPIs—plus competitor tracking, regulation, and value chains—across 60 countries broadly.

Spot the shifts before they hit your P&L. We track inflection points, adoption curves, pricing moves, and ecosystem plays to show where demand is heading, why it is changing, and what to do next across high-growth markets and disruptive tech

Real-time reads of user behavior. We track shifting priorities, perceptions of today’s and next-gen services, and provider experience, then pace how fast tech moves from trial to adoption, blending buyer, consumer, and channel inputs with social signals (#WhySwitch, #UX).

Partner with our analyst team to build a custom report designed around your business priorities. From analysing market trends to assessing competitors or crafting bespoke datasets, we tailor insights to your needs.
Supplier Intelligence
Discovery & Profiling
Capacity & Footprint
Performance & Risk
Compliance & Governance
Commercial Readiness
Who Supplies Whom
Scorecards & Shortlists
Playbooks & Docs
Category Intelligence
Definition & Scope
Demand & Use Cases
Cost Drivers
Market Structure
Supply Chain Map
Trade & Policy
Operating Norms
Deliverables
Buyer Intelligence
Account Basics
Spend & Scope
Procurement Model
Vendor Requirements
Terms & Policies
Entry Strategy
Pain Points & Triggers
Outputs
Pricing Analysis
Benchmarks
Trends
Should-Cost
Indexation
Landed Cost
Commercial Terms
Deliverables
Brand Analysis
Positioning & Value Prop
Share & Presence
Customer Evidence
Go-to-Market
Digital & Reputation
Compliance & Trust
KPIs & Gaps
Outputs
Full Research Suite comprises of:
Market outlook & trends analysis
Interviews & case studies
Strategic recommendations
Vendor profiles & capabilities analysis
5-year forecasts
8 regions and 60+ country-level data splits
Market segment data splits
12 months of continuous data updates
DELIVERED AS:
PDF EXCEL ONLINE
Ice Detection System Market Trends, Growth & Forecast 2025 to 2035
Bird Detection System Market Size and Share Forecast Outlook 2025 to 2035
Fall Detection System Market Insights – Size & Forecast 2025 to 2035
Spark Detection System Market Forecast and Outlook 2025 to 2035
Threat Detection Systems Market
AI-Secured Perimeters – Advanced Intrusion Detection Solutions
Water Leak Detection System for Server Rooms and Data Centers Market Size and Share Forecast Outlook 2025 to 2035
Wireless Fire Detection Systems Market Analysis - Size, Growth, and Forecast 2025 to 2035
Ammonia Online Detection System Market Size and Share Forecast Outlook 2025 to 2035
Concealed Weapon Detection Systems Market Trends – Growth & Forecast 2025-2035
Automated Microbial Detection Systems Market
Next-Generation Intrusion Prevention System (NGIPS) Market Size and Share Forecast Outlook 2025 to 2035
Aircraft Smoke Detection and Fire Extinguishing System Market Size and Share Forecast Outlook 2025 to 2035
System-On-Package Market Size and Share Forecast Outlook 2025 to 2035
Systems Administration Management Tools Market Size and Share Forecast Outlook 2025 to 2035
Systemic Sclerosis Treatment Market - Trends & Forecast 2025 to 2035
System on Module Market Growth – Trends & Forecast 2025 to 2035
SLE Drugs Market Insights - Growth & Forecast 2025 to 2035
Systemic Mastocytosis Treatment Market
Systemic Infection Treatment Market

Thank you!
You will receive an email from our Business Development Manager. Please be sure to check your SPAM/JUNK folder too.
Chat With
MaRIA