The Intraocular Lens Market is estimated to be valued at USD 5.4 billion in 2025 and is projected to reach USD 9.7 billion by 2035, registering a compound annual growth rate (CAGR) of 6.0% over the forecast period.
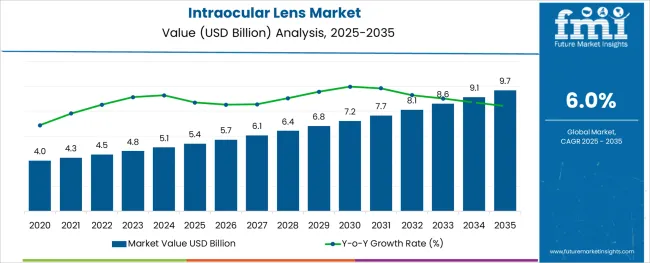
The intraocular lens market is expanding steadily due to the growing prevalence of cataract and age related eye disorders along with technological advancements in lens design and surgical techniques. Increasing life expectancy and rising demand for vision correction in the elderly population have fueled the number of cataract surgeries performed globally.
Innovations such as aspheric optics, blue light filtering, and premium lens materials are enhancing patient outcomes and driving market preference. Healthcare infrastructure improvements and government initiatives supporting free or subsidized cataract surgeries are also contributing to increased procedural volumes.
Furthermore, enhanced awareness about post surgical visual quality and availability of multiple lens options is shaping consumer choices. The market outlook remains favorable as medical tourism, surgeon expertise, and customization of lens selection continue to evolve and support long term vision correction strategies across diverse patient demographics.
The market is segmented by Product Type and End-User and region. By Product Type, the market is divided into Monofocal Intraocular Lens, Multifocal Intraocular Lens, Toric Intraocular Lens, and Accommodative Intraocular Lens. In terms of End-User, the market is classified into Hospitals, Ophthalmic Clinics, Ambulatory Surgery Centers, and Eye Research Institutes. Regionally, the market is classified into North America, Latin America, Western Europe, Eastern Europe, Balkan & Baltic Countries, Russia & Belarus, Central Asia, East Asia, South Asia & Pacific, and the Middle East & Africa.
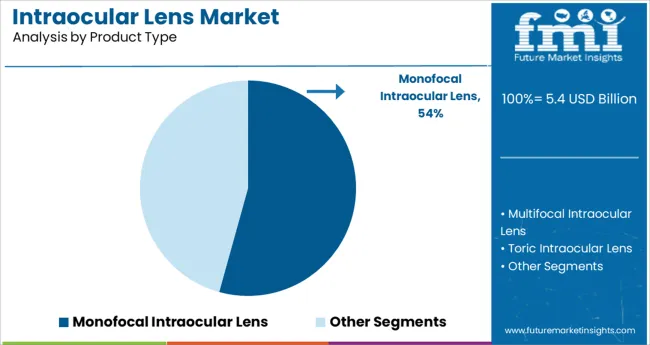
The monofocal intraocular lens segment is expected to account for 54.30% of total revenue by 2025 within the product type category, making it the dominant choice. This growth is attributed to its widespread clinical adoption, cost effectiveness, and proven outcomes in restoring distance vision after cataract removal.
Monofocal lenses are often preferred in public health programs and insurance covered procedures due to their affordability and simplified postoperative care. Their straightforward surgical implantation and high predictability of results make them ideal for large scale interventions.
While multifocal and toric lenses are gaining attention, monofocal lenses remain the standard in cataract treatment owing to their established track record, broad accessibility, and surgeon familiarity.
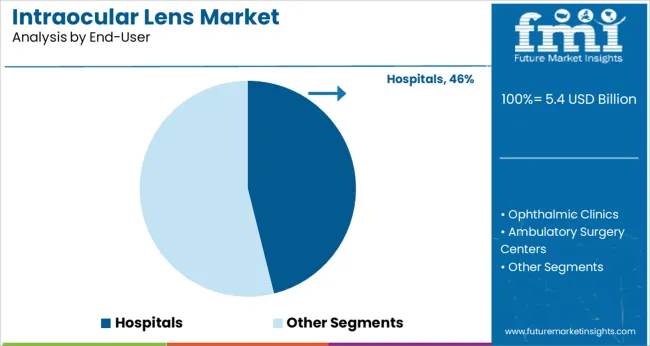
The hospitals segment is projected to contribute 46.10% of the total market revenue by 2025 within the end user category, positioning it as the leading channel. This prominence stems from the high volume of cataract procedures conducted in hospital settings where specialized surgical infrastructure and comprehensive postoperative care are readily available.
Hospitals typically offer both public and private eye care services, supporting a wide range of patients across demographics. Availability of ophthalmic specialists, access to advanced diagnostic tools, and capacity to manage surgical complications have made hospitals the preferred environment for intraocular lens implantation.
Additionally, hospital based reimbursement systems and government backed cataract surgery initiatives have reinforced their role as primary end users in the intraocular lens market.
As per the Intraocular Lens industry research by Future market insights - a market research and competitive intelligence provider, historically, from 2020 to 2024, the market value of the Intraocular Lens industry increased at around 5.7% CAGR, wherein, countries such as the USA, United Kingdom, China, Japan, and South Korea held a significant share in the global market.
The growing need to reduce healthcare costs while improving operational efficiency in healthcare organizations, as well as the growing need to maintain regulatory compliance and ensure the safety, security, and confidentiality of healthcare data, are the key drivers of the intraocular lens market.
Owing to this, the Intraocular Lens market is projected to grow at a CAGR of 6% over the coming 10 years.
During the forecast period, the market in Asia Pacific is expected to grow at the fastest rate. The presence of a large geriatric and diabetic population, both of whom are susceptible to cataracts and other ophthalmic disorders, is driving the market in the region.
Due to the large number of elderly people and the availability of reimbursements, the market in the Asia Pacific is expected to grow rapidly over the next five years. Besides, a large pool of patients and rising government funding are two key driving forces for the intraocular lens market in emerging countries.
Furthermore, the regional market is growing due to increased awareness of advanced treatment options and an influx of patients from developed countries seeking affordable healthcare.
USA Market Analysis
With a revenue share of over 35% in 2024, the USA dominated the global intraocular lens market. This is due to an increase in the prevalence of cataracts and other ophthalmic conditions. Furthermore, the market in the USA is growing due to well-defined regulatory guidelines and reimbursement policies for cataract treatment.
More than 11 million Americans have common vision issues that can be corrected with prescriptive eyewear such as glasses or contact lenses, according to the National Eye Institute of the National Institutes of Health. More than 150 million Americans wear corrective eyewear, with an annual expenditure of more than USD 15 billion.
As a result, over the forecast period, the rise in ophthalmic conditions across the region is expected to drive the intraocular lens market.
United Kingdom Market Analysis
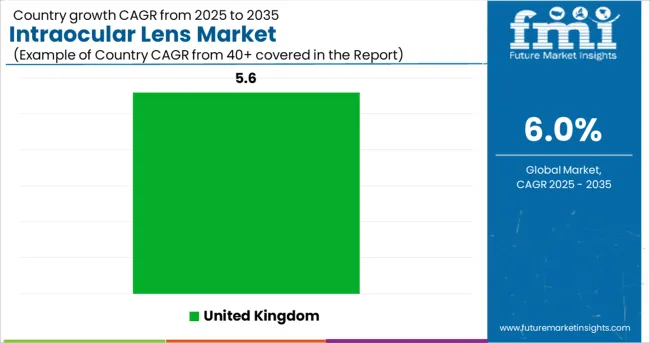
The intraocular lens market in the United Kingdom is expected to reach a valuation of USD 9.7 Million by 2035, growing at a CAGR of 5.6% from 2025 to 2035. There are over 2.3 Million people living in the United Kingdom who are classified as having moderate-sever vision loss. With these statistics, the market in the United Kingdom swells.
Japan Market Analysis
Glaucoma, diabetic retinopathy, degenerative myopia, age-related macular degeneration, and cataract accounts for 24.3%, 20.6%, 12.2%, 10.9%, and 7.2% visual impairments in Japan. Besides, there exists a large population with moderate vision loss. These figures take the Japanese Intraocular Lens Market projection to USD 518 Million by 2035.
South Korea Market Analysis
The South Korean intraocular lens market is projected to reach a valuation of USD 5.4 Million, growing at a CAGR of 7.3% from 2025 to 2035.
Due to the benefits that multifocal intraocular lenses provide, such as high precision and improved visualization, the multifocal intraocular lens segment dominated the intraocular lens market in 2024.
Furthermore, since they provide three vision zones, multifocal intraocular lenses are effective in treating patients with complex disorders and multiple retinal issues. In comparison to traditional mono-focal lenses, these vision zones allow patients to see far, intermediate, and close distances more efficiently and precisely.
The toric intraocular lens, which is beneficial specifically for patients with moderate to high astigmatism, was the second-largest segment in 2024 and is expected to grow at a lucrative rate over the forecast period. Astigmatism causes either hypermetropia, myopia, or both in patients.
Toric intraocular lenses are designed specifically for such patients. Furthermore, toric IOLs are designed to eliminate the need for incision implants, which were previously required during astigmatism surgical procedures, increasing their popularity among people.
The rapid growth of the geriatric population and associated eye disorders, the rising prevalence of eye diseases and diabetes in the overall population globally, technological advancements in intraocular lenses, and increasing government initiatives to control and treat cataract-related blindness are the key factors driving this category forward.
Companies' increasing focus on emerging markets, as well as a gradual shift towards newer technologies, are providing significant growth opportunities for intraocular lens manufacturers.
In 2024, the intraocular lens market revenue through hospitals accounted for a revenue share of over 50.6% and was valued at USD 2.1 billion. Although the majority of cataract and vision-repair surgeries are carried out in hospitals, individual ophthalmic clinics are increasing in number in developing countries.
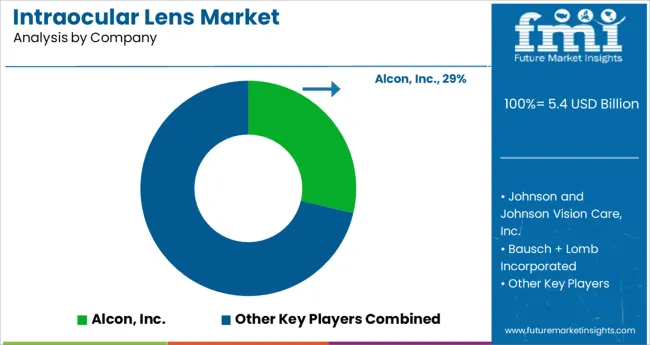
Alcon, Inc. (a Novartis AG division), Johnson & Johnson, Valeant, Carl Zeiss Meditec AG, Rayner, EyeKon Medical, Inc., Lenstec, Inc., Human Optics AG, and Physiol are the key players in the intraocular lens market. The intraocular lens market is consolidated, with a few key players accounting for the majority of revenue.
The key players are concentrating their efforts on completing acquisitions that will help them strengthen their market position. Furthermore, key players are forming alliances with non-profit organizations to raise awareness about cataracts and other eye diseases.
Manufacturers are also showing a keen interest in introducing new products to the market, which will help them maintain a strong product portfolio.
Companies are concentrating on low-cost surgical advancements for ophthalmic disorders.
Some of the recent developments of key players in the Intraocular Lens Market are as follows:
Similarly, recent developments related to companies offering Intraocular Lens have been tracked by the team at Future Market Insights, which are available in the full report.
The global intraocular lens market is estimated to be valued at USD 5.4 billion in 2025.
It is projected to reach USD 9.7 billion by 2035.
The market is expected to grow at a 6.0% CAGR between 2025 and 2035.
The key product types are monofocal intraocular lens, multifocal intraocular lens, toric intraocular lens and accommodative intraocular lens.
hospitals segment is expected to dominate with a 46.1% industry share in 2025.


Full Research Suite comprises of:
Market outlook & trends analysis
Interviews & case studies
Strategic recommendations
Vendor profiles & capabilities analysis
5-year forecasts
8 regions and 60+ country-level data splits
Market segment data splits
12 months of continuous data updates
DELIVERED AS:
PDF EXCEL ONLINE
Phakic Intraocular Lenses (IOL) Market Analysis - Size, Share & Forecast 2025 to 2035
Intraocular Lymphoma Treatment Market Insights by Drug Class, Mode of Administration, Distribution Channel, End User, and Region through 2035
Lens Analyzer Market Size and Share Forecast Outlook 2025 to 2035
Camera Lens Market Size and Share Forecast Outlook 2025 to 2035
Contact-lens Induced Infections Market Size and Share Forecast Outlook 2025 to 2035
Contact Lens Inspection Equipment Market Size and Share Forecast Outlook 2025 to 2035
Optical Lens Materials Market Size and Share Forecast Outlook 2025 to 2035
Contact Lens Industry Analysis in GCC Size and Share Forecast Outlook 2025 to 2035
Scleral Lenses Market Size and Share Forecast Outlook 2025 to 2035
Contact Lenses Market – Trends, Growth & Forecast 2025 to 2035
Contact Lens Solution Market Analysis by Product Type, Volume, Purpose, Distribution Channel, and Region through 2035
Acrylic Lenses Market
Anti-Fog Lens Market Insights - Size, Trends & Forecast 2025 to 2035
Global Spectacle Lens Market Analysis – Size, Share & Forecast 2024-2034
Aspherical Lens Market Size and Share Forecast Outlook 2025 to 2035
Collimating Lens Market – Growth & Technology Trends 2025 to 2035
IR Corrected Lenses Market Size and Share Forecast Outlook 2025 to 2035
Key Companies & Market Share in the Prescription Lens Industry
Smart Contact Lens Market Size and Share Forecast Outlook 2025 to 2035
Digital Vision Lenses Market

Thank you!
You will receive an email from our Business Development Manager. Please be sure to check your SPAM/JUNK folder too.
Chat With
MaRIA