Intellectual Property Software Market Overview (2022 to 2032)

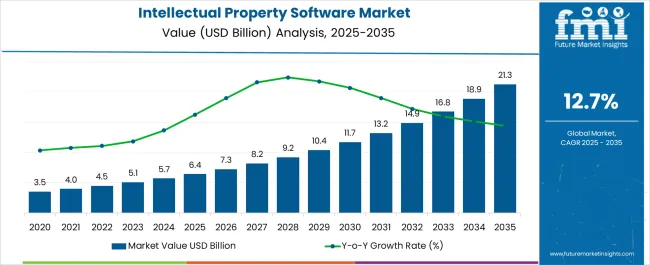
[323 Pages Report] According to Future Market Insights research, the intellectual property software market is likely to register a CAGR of 12.7% during the forecast period (2022 to 2032). The intellectual property software market is projected to be valued at US$ 4.5 Billion in 2022 and is expected to reach US$ 14.9 Billion by 2032. This growth can be attributed to the following factors:

  • The increasing need for a safe and well-documented approach to managing intellectual property inside a company
  • Software for managing intellectual property (IP) helps owners of IP to effectively preserve and safeguard their IP under copyrights, trademarks, program patents, or proprietary information.
  • Additionally, it makes it easier for them to access their intellectual property data.
Attributes Details
Intellectual Property Software Market CAGR (2022 to 2032) 12.7%
Intellectual Property Software Market Value (2022) US$ 4.5 Billion
Intellectual Property Software Market Value (2032) US$ 14.9 Billion

Individual and commercial end-users are likely to become more aware of and use Intellectual Property (IP) rights, which is anticipated to boost demand for intellectual property software.

The sales of intellectual property software are projected to grow due to rising demand for a well-documented and secure method to handle intellectual property within an organization.

Don't pay for what you don't need

Customize your report by selecting specific countries or regions and save 30%!

Patent Intellectual Property Management will propel growth

In recent years, the administration of patent IP has noticed a substantial movement in favor of digitalization. The number of patent applications dramatically rose in 2021. NTT, with 790 domestic filings that had the patent publication granted as of May 2021, was the leading firm based on the total number of AI-related patent applications in Japan, as per a Japan Patent Office analysis published in August 2021. Other significant Japanese businesses like Hitachi, Fujitsu, and Canon came after NTT.

One of the commonly used measures for gauging inventive activity, the number of foreign patent applications submitted under the Patent Cooperation Treaty (PCT) of the WIPO increased by 0.92% in 2021 to reach 275,500 applications, according to a study released in February 2022. As the major source of foreign patent applications, Asia demonstrated its dominance, accounting for 54.1% of all applications in 2021, increasing from 38.5% in 2011.

Huawei Technologies, a Chinese telecom behemoth, was the top filer in 2021 with 6,962 filed PCT applications, winning the title for a fourth straight year. Following it was Samsung Electronics of the Republic of Korea, Qualcomm Inc. of the US (3,931), LG Electronics Inc. of the Republic of Korea, and Mitsubishi Electric Corp. of Japan (2,673). In 2021, the number of published applications increased at the quickest rate (+80.9%), which helped Qualcomm Inc. rise from fifth place in 2020 to second place in 2021. The number of digital communication-related filings by Qualcomm nearly quadrupled, reaching 1,486. Thus, with such increasing numbers, the demand for intellectual property software is on the rise too.

Asia Pacific to gain the Maximum Demand by 2032

China is the main driver of global growth in demand for intellectual property (IP) rights, and Asia has established itself as the major source of foreign patentability, accounting for 54% of all application domains in 2021, up from 38.5% in 2021. Asia-Pacific was home to four of the leading five PCT filers at WIPO in 2021. The largest filer in 2021 was indeed the Chinese telecom giant Huawei Technologies, which had 6,962 published PCT applications.

On the other hand, in 2021 the Chinese Patent Office recorded close to 815,000 anomalies in patent applications. For instance, the China National Intellectual Property Administration discovered four batches totaling 815,000 erroneous patent applications in December 2021. The first three batches' rate of return as of right now is 93.1%. As there were over 5.2 million patent applications filed in 2020, this would suggest that approximately 15% of all Chinese patent applications were irregular (or aberrant). Additionally, there were 376,000 fraudulent trademark registration applications during the press conference.

As IT sectors become virtual, the pandemic accelerated the rate of technology adoption, according to the CEO and Managing Director of Tech Mahindra. As a result, for the information technology-enabled services (ITeS) sector in India, which has been at the forefront of technological transformation and organizations, cloud-based technology services would empower hybrid workspaces, improve agility, and encourage intellectual property (IP)-led innovation.

Sudip Saha
Sudip Saha

Principal Consultant

Talk to Analyst

Find your sweet spots for generating winning opportunities in this market.

What is the Key Dynamics Governing the Growth of the Intellectual Property Software Market

The shift of industries to paperless or cloud-based business models, the adoption of AI technology, decreased data storage costs, the expansion of Blockchain technology, and a high growth rate of data are likely to propel the global intellectual property software market forward. The incorporation of advanced AI and aided algorithms in intellectual property are major drivers boosting the demand for intellectual property software.

The demand for intellectual property software is growing as end users are increasingly using intellectual property software to secure and establish a brand, keep their work exclusive and private, and protect the exclusive tenure of their works in order to obtain a competitive advantage in the intellectual property software market.

The Ministry of Micro, Small, and Medium Enterprises (SMEs) has exclusive rights to the use of their creative designs, inventive original or new goods, and brands owing to intellectual property rights. The demand for intellectual property software is also rising as many private enterprises have made intellectual property protection and administration a primary concern, particularly in areas such as the arts, culture, and technology.

The sales of intellectual property software are rising as it is both efficient and equitable and can assist businesses in realizing the potential of intellectual property as a catalyst for cultural and social well-being as well as economic development.

Intellectual property assets contribute to economic development in a variety of ways, as many businesses earn royalties by licensing their IP assets to third parties. As a result, increased emphasis on intellectual property protection and management is projected to drive intellectual property software market growth during the forecast period.

In the evolution of information and communication technologies, intellectual property plays a critical role. Companies may reach out to markets at a lower cost and in a much shorter time frame, thanks to ICT. Furthermore, IP systems are crucial for SMEs to employ in order to take benefit of ICT.

The intellectual property software market competitiveness of SMEs is predicted to improve with the integration of intellectual property protection and information and communication technology. As a result of this, the demand for intellectual property software is predicted to rise rapidly.

A number of businesses intend to develop new products with a variety of services in order to suit the diverse demands of intellectual property software market clients. As a result of the availability of such technology, SMEs are implementing IP systems to safeguard their tangible and intangible assets in order to remain competitive and boost the sales of intellectual property software.

What is the Segmentation Outlook for the Intellectual Property Software Market

In 2021, the on-premise segment dominated the intellectual property software market, accounting for nearly 50.9 percent of total revenue. An organization's internal infrastructure is used to install and run this software. Individuals who file a patent can also track and manage their applications using the intellectual property software on their PC. Internal teams can use the on-premise deployment to patch problems and detect faults in the systems.

Get the data you need at a Fraction of the cost

Personalize your report by choosing insights you need
and save 40%!

Which Segment is likely to Lead the Intellectual Property Software Market by Component

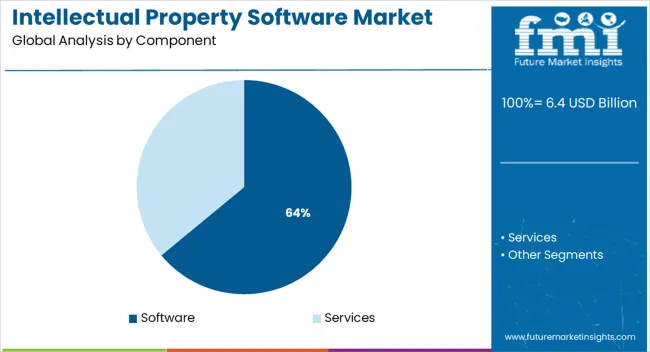
In 2021, the software segment led the intellectual property software market with a CAGR of 13.5%. The increased adoption of intellectual property management software in many industries, such as BFSI, IT and telecom, technology, automotive, healthcare, and jewelry, can be related to the segment's rise. These industries rely on software to apply for and manage their intellectual property rights

Which Segment is likely to Lead the Intellectual Property Software Market by Application

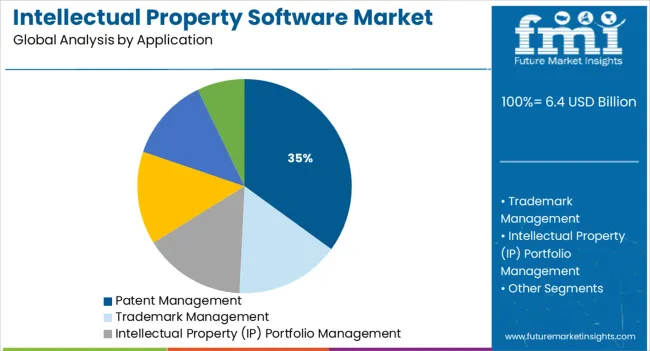
From 2022 to 2032, the patent management segment is expected to lead the intellectual property software market with a CAGR of 11.5%. The growth is due to a rise in the number of patent applications filed over time. According to Nasscom data, India saw a six-fold increase in the number of Internet of Things (IoT) applications in June 2020, with approximately 80 percent of patents relating to Industry 4.0.

What is the Regional Analysis for the Intellectual Property Software Market

Regions CAGR (2022 to 2032)
USA Market 11.1%
UK Market 13.2%
China Market 13.4%
Japan Market 12.7%
India Market 15.5%

During the forecast period, North America is predicted to dominate the intellectual property software market. The USA intellectual property software market is growing at a CAGR of 11.1%.

The region's rise can be ascribed to end-user knowledge of intellectual property and its management, a large number of internet users in the USA and Canada, and the presence of businesses like Anaqua Inc., CPA Global, and Questel in the USA.

In addition, the growing number of intellectual property offices in the region is aiding the intellectual property software market expansion. According to data supplied by the World Intellectual Property Organization (WIPO), intellectual property offices in North America accounted for more than one-fifth of all IP offices worldwide in 2019.

Meanwhile, from 2022 to 2032, the Asia Pacific market is expected to grow at the fastest rate. The region's market growth is expected to be boosted by an increase in the number of IT and telecom enterprises, as well as numerous automobile manufacturing units in nations like India and China.

India’s intellectual property software market is projected to grow at the fastest rate in APAC with a CAGR of 15.5%.

How is the Competition in the Intellectual Property Software Market

Major players in the intellectual property software market are concentrating on business expansion in order to strengthen their market position. In order to acquire a competitive advantage in the industry, key market players are forming partnerships and collaborations.

Recent Developments in the Intellectual Property Software Market

  • Dennemeyer Group opened a new local office in Moscow in January 2017. This office assists the company's existing customers in protecting their intellectual property rights in the Russian Federation and Eurasia, as well as helping Dennemeyer & Associates established itself as a high-quality law and regulation firm for local businesses.
  • Gridlogics Technologies Pvt. Ltd. partnered with ProQuest Dialog, a company based in North Carolina, in March 2017. Clients of ProQuest Dialog got access to PatSeer, Gridlogics' web-based platform, where they may search 42 full-text patent authorities and use visualization tools and strong analytics to analyze the results.
  • In January 2020, Questel confirmed the acquisition of the NRI Cyber Patent in Japan. NRI Cyber Patent is an intellectual asset management and IP business intelligence service and solutions provider. The acquisition enabled Questel to expand its business offerings.
  • Similarly, in October 2020, Clarivate, an insights and analytics firm, announced the integration of Darts-ip case law data with Innography IP intelligence and analytics solution to improve strategic decision-making across the intellectual property lifecycle.

Key Players

  • Aistemos Ltd
  • Anaqua Inc
  • Clarivate Analytics
  • Dennemeyer Group
  • Innovation Asset Group Inc
  • LexisNexis Legal & Professional
  • Patrix AB

Key Segments

By Component:

  • Software
    • Cloud-based
    • On-Premise
  • Services
    • Development & Implementation Services
    • Consulting Services
    • Maintenance & Support Services

By Application:

  • Patent Management
  • Trademark Management
  • Intellectual Property (IP) Portfolio Management
  • Intellectual Property (IP) Licensing
  • Intellectual Property (IP) Reporting & Analytics
  • Others

By End-use:

  • Individuals (independent Inventors)
  • Enterprises
    • Banking, Financial Institutions, and Insurance (BFSI)
    • Government
    • Healthcare
    • IT & Telecommunication
    • Electronics
    • Manufacturing
    • Others

By Region:

  • North America
  • Europe
  • Asia Pacific
  • Middle East and Africa
  • South America

Frequently Asked Questions

What is the CAGR of the Intellectual Property Software Market?

The intellectual property software market is projected to register a CAGR of 12.7% during the forecast period (2022 to 2032).

Which is the Leading Region in the Intellectual Property Software Market?

North America is predicted to dominate the intellectual property software market.

Which Segment leads in the Intellectual Property Software Market by Application?

The patent management segment is likely to lead the intellectual property software market with a CAGR of 11.5% through 2032

What is the Growth Estimated for the Intellectual Property Software Market by 2032?

The intellectual property software market is projected to be valued at US$ 14.9 Billion by 2032.

Which Region has the Highest Growth Potential?

The Asia Pacific market is expected to grow at the fastest rate.

Table of Content

1. Preface | Intellectual Property Software Market

    1.1. Market Definition and Scope

    1.2. Market Segmentation

    1.3. Key Research Objectives

    1.4. Research Highlights

2. Assumptions and Research Methodology

3. Executive Summary: Global Market

4. Market Overview

    4.1. Introduction

    4.2. Market Dynamics

        4.2.1. Drivers

        4.2.2. Restraints

        4.2.3. Opportunities

    4.3. Key Market Indicators

        4.3.1. Use Cases/ Case Studies across the industries

        4.3.2. Adoption Analysis of Intellectual Property Software across End-use Applications - Independent Inventors Vs Other IP Management Companies

            4.3.2.1. Challenging factors for Independent Inventors

    4.4. Global Market Analysis and Forecasts, 2015 to 2032

        4.4.1. Market Revenue Projections (US$ Million)

        4.4.2. Market Year-on-Year (Y-o-Y) Growth (Value %)

    4.5. Porter’s Five Force Analysis

    4.6. Ecosystem Analysis

    4.7. Market Outlook

5. Product Overview

    5.1. Software Products Overview (Top 20)

        5.1.1. Products Overview

        5.1.2. Features

        5.1.3. Deployment

        5.1.4. Applications (User Base)

        5.1.5. Developments

        5.1.6. Profit Model

    5.2. Intellectual Property (IP) Lifecycle (Top 20)

        5.2.1. Product Positioning Matrix across IP Lifecycle

    5.3. End-use Application/ Consumer Analysis

        5.3.1. Demand Analysis

        5.3.2. Profit Models

        5.3.3. Historic Roadmap

        5.3.4. Recent Developments

    5.4. Product Competition Matrix

6. Global Market Analysis and Forecast, by Component

    6.1. Overview & Definitions

    6.2. Key Trends

    6.3. Market Size (US$ Million) Forecast by Component, 2015 to 2032

        6.3.1. Software

            6.3.1.1. Cloud-based

            6.3.1.2. On-Premise

        6.3.2. Services

            6.3.2.1. Development & Implementation Services

            6.3.2.2. Consulting Services

            6.3.2.3. Maintenance & Support Services

    6.4. Component Comparison Matrix

    6.5. Market Attractiveness by Component

7. Global Market Analysis and Forecast, by Application

    7.1. Overview & Definition

    7.2. Key Trends

    7.3. Market Size (US$ Million) Forecast by Application, 2015 to 2032

        7.3.1. Patent Management

        7.3.2. Trademark Management

        7.3.3. Intellectual Property (IP) Portfolio Management

        7.3.4. Intellectual Property (IP) Licensing

        7.3.5. Intellectual Property (IP) Reporting & Analytics

        7.3.6. Others

    7.4. Application Comparison Matrix

    7.5. Market Attractiveness by Application

8. Global Market Analysis and Forecast, by End-user Industry

    8.1. Overview & Definition

    8.2. Key Trends

    8.3. Market Size (US$ Million) Forecast by End-user Industry, 2015 to 2032

        8.3.1. Individuals (independent Inventors)

        8.3.2. Enterprises

            8.3.2.1. Banking, Financial Institutions, and Insurance (BFSI)

            8.3.2.2. Government

            8.3.2.3. Healthcare

            8.3.2.4. IT & Telecommunication

            8.3.2.5. Electronics

            8.3.2.6. Manufacturing

            8.3.2.7. Others

    8.4. End-user Industry Comparison Matrix

    8.5. Market Attractiveness by End-user Industry

9. Global Market Analysis and Forecast, by Region

    9.1. Key Findings

    9.2. Policies and Regulations

    9.3. Market Size (US$ Million) Forecast by Region, 2015 to 2032

        9.3.1. North America

        9.3.2. Europe

        9.3.3. Asia Pacific

        9.3.4. Middle East and Africa

        9.3.5. South America

    9.4. Market Attractiveness by Region

10. North America Market Analysis and Forecast

    10.1. Key Findings

    10.2. Key Trends

    10.3. Market Size (US$ Million) Forecast by Component, 2015 to 2032

        10.3.1. Software

            10.3.1.1. Cloud-based

            10.3.1.2. On-Premise

        10.3.2. Services

            10.3.2.1. Development & Implementation Services

            10.3.2.2. Consulting Services

            10.3.2.3. Maintenance & Support Services

    10.4. Market Size (US$ Million) Forecast by Application, 2015 to 2032

        10.4.1. Patent Management

        10.4.2. Trademark Management

        10.4.3. Intellectual Property (IP) Portfolio Management

        10.4.4. Intellectual Property (IP) Licensing

        10.4.5. Intellectual Property (IP) Reporting & Analytics

        10.4.6. Others

    10.5. Market Size (US$ Million) Forecast by End-user Industry, 2015 to 2032

        10.5.1. Individuals (independent Inventors)

        10.5.2. Enterprises

            10.5.2.1. Banking, Financial Institutions, and Insurance (BFSI)

            10.5.2.2. Government

            10.5.2.3. Healthcare

            10.5.2.4. IT & Telecommunication

            10.5.2.5. Electronics

            10.5.2.6. Manufacturing

            10.5.2.7. Others

    10.6. Market Size (US$ Million) Forecast by Country, 2015 to 2032

        10.6.1. The USA

        10.6.2. Canada

        10.6.3. Rest of North America

    10.7. Market Attractiveness Analysis

        10.7.1. By Country

        10.7.2. By Component

        10.7.3. By Application

        10.7.4. By End-user Industry

11. Europe Market Analysis and Forecast

    11.1. Key Findings

    11.2. Key Trends

    11.3. Market Size (US$ Million) Forecast by Component, 2015 to 2032

        11.3.1. Software

            11.3.1.1. Cloud-based

            11.3.1.2. On-Premise

        11.3.2. Services

            11.3.2.1. Development & Implementation Services

            11.3.2.2. Consulting Services

            11.3.2.3. Maintenance & Support Services

    11.4. Market Size (US$ Million) Forecast by Application, 2015 to 2032

        11.4.1. Patent Management

        11.4.2. Trademark Management

        11.4.3. Intellectual Property (IP) Portfolio Management

        11.4.4. Intellectual Property (IP) Licensing

        11.4.5. Intellectual Property (IP) Reporting & Analytics

        11.4.6. Others

    11.5. Market Size (US$ Million) Forecast by End-user Industry, 2015 to 2032

        11.5.1. Individuals (independent Inventors)

        11.5.2. Enterprises

            11.5.2.1. Banking, Financial Institutions, and Insurance (BFSI)

            11.5.2.2. Government

            11.5.2.3. Healthcare

            11.5.2.4. IT & Telecommunication

            11.5.2.5. Electronics

            11.5.2.6. Manufacturing

            11.5.2.7. Others

    11.6. Market Size (US$ Million) Forecast by Country, 2015 to 2032

        11.6.1. Germany

        11.6.2. France

        11.6.3. The UK

        11.6.4. Italy

        11.6.5. Spain

        11.6.6. Rest of Europe

    11.7. Market Attractiveness Analysis

        11.7.1. By Country

        11.7.2. By Component

        11.7.3. By Application

        11.7.4. By End-user Industry

12. Asia Pacific Market Analysis and Forecast

    12.1. Key Findings

    12.2. Key Trends

    12.3. Market Size (US$ Million) Forecast by Component, 2015 to 2032

        12.3.1. Software

            12.3.1.1. Cloud-based

            12.3.1.2. On-Premise

        12.3.2. Services

            12.3.2.1. Development & Implementation Services

            12.3.2.2. Consulting Services

            12.3.2.3. Maintenance & Support Services

    12.4. Market Size (US$ Million) Forecast by Application, 2015 to 2032

        12.4.1. Patent Management

        12.4.2. Trademark Management

        12.4.3. Intellectual Property (IP) Portfolio Management

        12.4.4. Intellectual Property (IP) Licensing

        12.4.5. Intellectual Property (IP) Reporting & Analytics

        12.4.6. Others

    12.5. Market Size (US$ Million) Forecast by End-user Industry, 2015 to 2032

        12.5.1. Individuals (independent Inventors)

        12.5.2. Enterprises

            12.5.2.1. Banking, Financial Institutions, and Insurance (BFSI)

            12.5.2.2. Government

            12.5.2.3. Healthcare

            12.5.2.4. IT & Telecommunication

            12.5.2.5. Electronics

            12.5.2.6. Manufacturing

            12.5.2.7. Others

    12.6. Market Size (US$ Million) Forecast by Country, 2015 to 2032

        12.6.1. China

        12.6.2. Japan

        12.6.3. India

        12.6.4. Australia

        12.6.5. Rest of Asia Pacific

    12.7. Market Attractiveness Analysis

        12.7.1. By Country

        12.7.2. By Component

        12.7.3. By Application

        12.7.4. By End-user Industry

13. Middle East and Africa (MEA) Market Analysis and Forecast

    13.1. Key Findings

    13.2. Key Trends

    13.3. Market Size (US$ Million) Forecast by Component, 2015 to 2032

        13.3.1. Software

            13.3.1.1. Cloud-based

            13.3.1.2. On-Premise

        13.3.2. Services

            13.3.2.1. Development & Implementation Services

            13.3.2.2. Consulting Services

            13.3.2.3. Maintenance & Support Services

    13.4. Market Size (US$ Million) Forecast by Application, 2015 to 2032

        13.4.1. Patent Management

        13.4.2. Trademark Management

        13.4.3. Intellectual Property (IP) Portfolio Management

        13.4.4. Intellectual Property (IP) Licensing

        13.4.5. Intellectual Property (IP) Reporting & Analytics

        13.4.6. Others

    13.5. Market Size (US$ Million) Forecast by End-user Industry, 2015 to 2032

        13.5.1. Individuals (independent Inventors)

        13.5.2. Enterprises

            13.5.2.1. Banking, Financial Institutions, and Insurance (BFSI)

            13.5.2.2. Government

            13.5.2.3. Healthcare

            13.5.2.4. IT & Telecommunication

            13.5.2.5. Electronics

            13.5.2.6. Manufacturing

            13.5.2.7. Others

    13.6. Market Size (US$ Million) Forecast by Country, 2015 to 2032

        13.6.1. United Arab Emirates (UAE)

        13.6.2. Saudi Arabia

        13.6.3. South Africa

        13.6.4. Rest of MEA

    13.7. Market Attractiveness Analysis

        13.7.1. By Country

        13.7.2. By Component

        13.7.3. By Application

        13.7.4. By End-user Industry

14. South America Market Analysis and Forecast

    14.1. Key Findings

    14.2. Key Trends

    14.3. Market Size (US$ Million) Forecast by Component, 2015 to 2032

        14.3.1. Software

            14.3.1.1. Cloud-based

            14.3.1.2. On-Premise

        14.3.2. Services

            14.3.2.1. Development & Implementation Services

            14.3.2.2. Consulting Services

            14.3.2.3. Maintenance & Support Services

    14.4. Market Size (US$ Million) Forecast by Application, 2015 to 2032

        14.4.1. Patent Management

        14.4.2. Trademark Management

        14.4.3. Intellectual Property (IP) Portfolio Management

        14.4.4. Intellectual Property (IP) Licensing

        14.4.5. Intellectual Property (IP) Reporting & Analytics

        14.4.6. Others

    14.5. Market Size (US$ Million) Forecast by End-user Industry, 2015 to 2032

        14.5.1. Individuals (independent Inventors)

        14.5.2. Enterprises

            14.5.2.1. Banking, Financial Institutions, and Insurance (BFSI)

            14.5.2.2. Government

            14.5.2.3. Healthcare

            14.5.2.4. IT & Telecommunication

            14.5.2.5. Electronics

            14.5.2.6. Manufacturing

            14.5.2.7. Others

    14.6. Market Size (US$ Million) Forecast by Country, 2015 to 2032

        14.6.1. Brazil

        14.6.2. Rest of South America

    14.7. Market Attractiveness Analysis

        14.7.1. By Country

        14.7.2. By Component

        14.7.3. By Application

        14.7.4. By End-user Industry

15. Competition Landscape

    15.1. Market Player - Competition Matrix

    15.2. Market Share Analysis by Company (2021)

    15.3. Market Share Analysis by Application (2021)

    15.4. Company Profiles

        15.4.1. Aistemos

            15.4.1.1. Company Details (Headquarter, Foundation Year, & Employee Strength)

            15.4.1.2. Company Description

            15.4.1.3. SWOT Analysis

            15.4.1.4. Annual Revenue

            15.4.1.5. Strategic Overview

        15.4.2. Ambercite

            15.4.2.1. Company Details (Headquarter, Foundation Year, & Employee Strength)

            15.4.2.2. Company Description

            15.4.2.3. SWOT Analysis

            15.4.2.4. Annual Revenue

            15.4.2.5. Strategic Overview

        15.4.3. Anaqua, Inc.

            15.4.3.1. Company Details (Headquarter, Foundation Year, & Employee Strength)

            15.4.3.2. Company Description

            15.4.3.3. SWOT Analysis

            15.4.3.4. Annual Revenue

            15.4.3.5. Strategic Overview

        15.4.4. Clarivate Analytics

            15.4.4.1. Company Details (Headquarter, Foundation Year, & Employee Strength)

            15.4.4.2. Company Description

            15.4.4.3. SWOT Analysis

            15.4.4.4. Annual Revenue

            15.4.4.5. Strategic Overview

        15.4.5. Dennemeyer

            15.4.5.1. Company Details (Headquarter, Foundation Year, & Employee Strength)

            15.4.5.2. Company Description

            15.4.5.3. SWOT Analysis

            15.4.5.4. Annual Revenue

            15.4.5.5. Strategic Overview

        15.4.6. Evalueserve Netherlands B.V.

            15.4.6.1. Company Details (Headquarter, Foundation Year, & Employee Strength)

            15.4.6.2. Company Description

            15.4.6.3. SWOT Analysis

            15.4.6.4. Annual Revenue

            15.4.6.5. Strategic Overview

        15.4.7. Gemalto NV

            15.4.7.1. Company Details (Headquarter, Foundation Year, & Employee Strength)

            15.4.7.2. Company Description

            15.4.7.3. SWOT Analysis

            15.4.7.4. Annual Revenue

            15.4.7.5. Strategic Overview

        15.4.8. Gridlogics

            15.4.8.1. Company Details (Headquarter, Foundation Year, & Employee Strength)

            15.4.8.2. Company Description

            15.4.8.3. SWOT Analysis

            15.4.8.4. Annual Revenue

            15.4.8.5. Strategic Overview

        15.4.9. Innography, Inc.

            15.4.9.1. Company Details (Headquarter, Foundation Year, & Employee Strength)

            15.4.9.2. Company Description

            15.4.9.3. SWOT Analysis

            15.4.9.4. Annual Revenue

            15.4.9.5. Strategic Overview

        15.4.10. Innovation Asset Group, Inc.

            15.4.10.1. Company Details (Headquarter, Foundation Year, & Employee Strength)

            15.4.10.2. Company Description

            15.4.10.3. SWOT Analysis

            15.4.10.4. Annual Revenue

            15.4.10.5. Strategic Overview

        15.4.11. Inteum Company, LLC

            15.4.11.1. Company Details (Headquarter, Foundation Year, & Employee Strength)

            15.4.11.2. Company Description

            15.4.11.3. SWOT Analysis

            15.4.11.4. Annual Revenue

            15.4.11.5. Strategic Overview

        15.4.12. Iolite Softwares Inc.

            15.4.12.1. Company Details (Headquarter, Foundation Year, & Employee Strength)

            15.4.12.2. Company Description

            15.4.12.3. SWOT Analysis

            15.4.12.4. Annual Revenue

            15.4.12.5. Strategic Overview

        15.4.13. IP Checkups, Inc.

            15.4.13.1. Company Details (Headquarter, Foundation Year, & Employee Strength)

            15.4.13.2. Company Description

            15.4.13.3. SWOT Analysis

            15.4.13.4. Annual Revenue

            15.4.13.5. Strategic Overview

        15.4.14. IP Street Holdings, LLC

            15.4.14.1. Company Details (Headquarter, Foundation Year, & Employee Strength)

            15.4.14.2. Company Description

            15.4.14.3. SWOT Analysis

            15.4.14.4. Annual Revenue

            15.4.14.5. Strategic Overview

        15.4.15. LexisNexis

            15.4.15.1. Company Details (Headquarter, Foundation Year, & Employee Strength)

            15.4.15.2. Company Description

            15.4.15.3. SWOT Analysis

            15.4.15.4. Annual Revenue

            15.4.15.5. Strategic Overview

        15.4.16. Minesoft Ltd

            15.4.16.1. Company Details (Headquarter, Foundation Year, & Employee Strength)

            15.4.16.2. Company Description

            15.4.16.3. SWOT Analysis

            15.4.16.4. Annual Revenue

            15.4.16.5. Strategic Overview

        15.4.17. O P Solutions, Inc.

            15.4.17.1. Company Details (Headquarter, Foundation Year, & Employee Strength)

            15.4.17.2. Company Description

            15.4.17.3. SWOT Analysis

            15.4.17.4. Annual Revenue

            15.4.17.5. Strategic Overview

        15.4.18. Patrix AB

            15.4.18.1. Company Details (Headquarter, Foundation Year, & Employee Strength)

            15.4.18.2. Company Description

            15.4.18.3. SWOT Analysis

            15.4.18.4. Annual Revenue

            15.4.18.5. Strategic Overview

        15.4.19. PatSnap Pte. Ltd.

            15.4.19.1. Company Details (Headquarter, Foundation Year, & Employee Strength)

            15.4.19.2. Company Description

            15.4.19.3. SWOT Analysis

            15.4.19.4. Annual Revenue

            15.4.19.5. Strategic Overview

        15.4.20. Questel

            15.4.20.1. Company Details (Headquarter, Foundation Year, & Employee Strength)

            15.4.20.2. Company Description

            15.4.20.3. SWOT Analysis

            15.4.20.4. Annual Revenue

            15.4.20.5. Strategic Overview

        15.4.21. TORViC Technologies, Inc.

            15.4.21.1. Company Details (Headquarter, Foundation Year, & Employee Strength)

            15.4.21.2. Company Description

            15.4.21.3. SWOT Analysis

            15.4.21.4. Annual Revenue

            15.4.21.5. Strategic Overview

        15.4.22. VajraSoft Inc.

            15.4.22.1. Company Details (Headquarter, Foundation Year, & Employee Strength)

            15.4.22.2. Company Description

            15.4.22.3. SWOT Analysis

            15.4.22.4. Annual Revenue

            15.4.22.5. Strategic Overview

        15.4.23. Wellspring Worldwide

            15.4.23.1. Company Details (Headquarter, Foundation Year, & Employee Strength)

            15.4.23.2. Company Description

            15.4.23.3. SWOT Analysis

            15.4.23.4. Annual Revenue

            15.4.23.5. Strategic Overview

        15.4.24. XLPAT

            15.4.24.1. Company Details (Headquarter, Foundation Year, & Employee Strength)

            15.4.24.2. Company Description

            15.4.24.3. SWOT Analysis

            15.4.24.4. Annual Revenue

            15.4.24.5. Strategic Overview

16. Key Takeaway

Recommendations

Technology

Enterprise Intellectual Property (IP) Management Software Market

July 2023

REP-GB-1573

342 pages

Technology

South Korea Intellectual Property Market

May 2023

REP-GB-14449

315 pages

Technology

Property Management Software Market

February 2023

REP-GB-12187

295 pages

Explore Technology Insights

View Reports
Future Market Insights

Intellectual Property Software Market

Schedule a Call