Integrated 3D Radar Market Size and Share Forecast Outlook 2025 to 2035

The Integrated 3D Radar Market is estimated to be valued at USD 24.9 billion in 2025 and is projected to reach USD 78.8 billion by 2035, registering a compound annual growth rate (CAGR) of 12.2% over the forecast period.
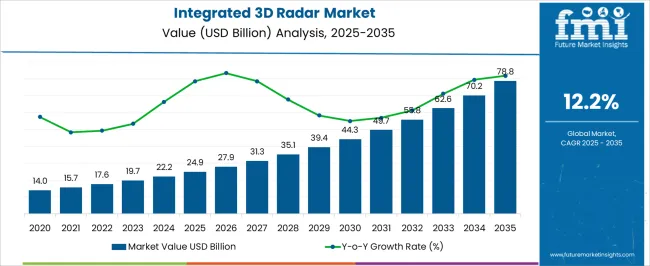
Quick Stats for Integrated 3D Radar Market

  • Integrated 3D Radar Market Industry Value (2025): USD 24.9 billion
  • Integrated 3D Radar Market Forecast Value (2035): USD 78.8 billion
  • Integrated 3D Radar Market Forecast CAGR: 12.2%
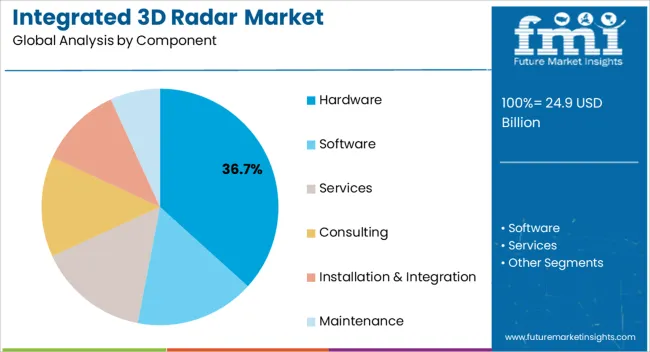
  • Leading Segment in Integrated 3D Radar Market in 2025: Hardware (36.7%)
  • Key Growth Region in Integrated 3D Radar Market: North America, Asia-Pacific, Europe
  • Top Key Players in Integrated 3D Radar Market: Airbus Defense and Space, Bae Systems, Harris Corporation, Honeywell International, Leonardo SpA, Northrop Grumman, Raytheon, Saab, Thales Group, Teledyne Technologies
Integrated 3d Radar Market Market Value Analysis
Metric Value
Integrated 3D Radar Market Estimated Value in (2025 E) USD 24.9 billion
Integrated 3D Radar Market Forecast Value in (2035 F) USD 78.8 billion
Forecast CAGR (2025 to 2035) 12.2%

Rationale for Segmental Growth in the Integrated 3D Radar Market

The integrated 3D radar market is experiencing strong momentum as demand rises for advanced surveillance, navigation, and safety systems across both defense and civilian applications. Increasing emphasis on real time situational awareness and the need for multi dimensional target tracking are driving adoption.

Technological improvements in radar signal processing, digital beamforming, and sensor fusion are enhancing accuracy and reliability. Governments and industries are investing heavily in radar systems that can operate effectively in complex environments with minimal interference.

Integration with autonomous platforms, smart infrastructure, and intelligent transportation systems is further accelerating adoption. The outlook remains favorable as radar systems become increasingly vital in supporting security, transportation safety, and smart city development initiatives worldwide.
Segmental Analysis

Insights into the Hardware Component Segment

Integrated 3d Radar Market Analysis By Component

The hardware segment is projected to hold 36.70% of total market revenue by 2025 within the component category, making it the leading segment. Growth is supported by the critical role of antennas, transmitters, and receivers in ensuring system performance and reliability.

Hardware investments are being prioritized due to rising demand for high precision modules and compact radar units that can be deployed across diverse platforms. Advancements in semiconductor technology and cost efficient manufacturing processes are further strengthening adoption.

As organizations emphasize durable and scalable radar solutions, the hardware segment continues to dominate in terms of revenue contribution.
Insights into the HF and VHF Radar Frequency Band Segment

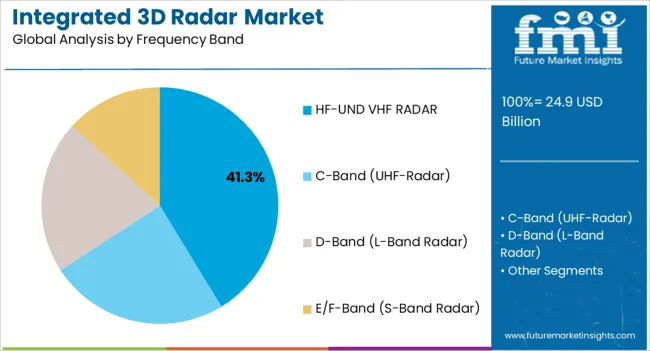
Integrated 3d Radar Market Analysis By Frequency Band

The HF and VHF radar segment is anticipated to represent 41.30% of the market within the frequency band category by 2025. This dominance is attributed to the ability of HF and VHF radars to provide long range detection and resilience in adverse weather conditions.

Their widespread adoption in both defense surveillance and large scale infrastructure monitoring underscores their strategic importance. Investments in improving bandwidth efficiency and integrating digital signal processing have reinforced their reliability.

As the need for long range monitoring and border security intensifies, HF and VHF radars remain the most deployed frequency band, securing their leadership position in the market.

What are the Key Drivers and Restraints for the Growth of the Market?

Lately, the war between Russia and Ukraine has not stopped the sales of integrated 3D radar systems but pushed the sales of it. Regions in the neighborhood are spending more on their air security and monitoring systems, including integrated 3D radar systems.

The significant factors that help the integrated 3D radar market thrive are increasing military budgets worldwide, substantial private investment in the aviation industry, new flying zones opening up, and technological advancements integrating with radar systems.

As a threat to a nation's security is a huge concern for the government, military expenditure needs to cover each aspect that military forces ask for. An integrated 3D radar system is required in order to monitor the airspace, sea space, and land space in different formats. It gives information about the positioning, size, and speed of any object that is under surveillance.

This way, the security forces get a vivid idea about the object that enters the territory. For instance, Tata Power has signed a deal with the Indian government to provide 23 ship-borne 3D radar systems to the Indian Navy over the next ten years.

Another factor is the high consumption of integrated 3D radar systems in aviation industries, including airspaces and airports. The 3D radar system is used in air traffic management systems to ensure that the airspace is clear for the aircraft to fly. It also makes sure if the climate and air are suitable for flying or not.

Integration of advanced technologies like AI and machine learning along with these 3D radar systems is helping ATM systems forecast favorable conditions by going through different patterns and historical data. This integrated 3D radar helps in supporting infrastructure for detecting trespassing objects and ensures the passenger's safety.

Companies work in the direction of making these 3D radar systems in a way that they have long-lasting life. This is because these systems are mostly implemented in the remotest areas where maintenance is a near-impossible phenomenon. Vendors supplying huge batches of security and monitoring equipment to countries that are going through a civil war or rebellion are also fueling the sales of integrated 3D radar systems.

The only restraints that affect the market's growth are the high implementation cost, maintenance cost, and incompetent operators that need skillful workshops to learn about the frequent upgrades in the system. This also is not less in terms of cost. As Covid-19 has already broken the backbone of the aviation industry, aviation companies are not ready to spend massive capital on radar systems.

Country-wise Insights

Country United States
Revenue Share % (2025) 18.5%
Country Germany
Revenue Share % (2025) 12.4%
Country Japan
Revenue Share % (2025) 6.3%
Country Australia
Revenue Share % (2025) 2.4%
Country North America
Revenue Share % (2025) 30.6%
Country Europe
Revenue Share % (2025) 23.2%

The integrated 3D radar market is divided into regions; North America, Latin America, Asia Pacific, Middle East and Africa (MEA), and Europe. The significant market is the United States, thriving at a CAGR of 11.3% between 2025 to 2035.

The region is expected to hold a market revenue of USD 78.8 billion by the end of 2035. The market held a leading share of 18.5% in 2025, while overall, North America held a share of 30.6% in 2025. The growth is attributed to government initiatives to enhance the security and safety of the borders of the region. Indian region grows at a substantial growth rate and is expected to hold USD 3 billion by the end of 2035 as it thrives on a robust CAGR of 14.4% between 2025 to 2035.

China also grows along with India, with the forecasted value of USD 4.4 billion (2035) at a CAGR of 10.4% between 2025 to 2035, while the United Kingdom has a revenue of USD 4 billion (2035) at a CAGR of 12.1%.

Key regional Trends

  • The United States holds a considerable portion of the integrated 3D radar market.
  • India is a leading market in the Asia Pacific region. Moreover, China and Japan also record stronger CAGRs of 14.4% in the forecast period (2025 to 2035).
  • Rising tensions and border disputes between countries such as Russia and Ukraine are flourishing the market along with cutting-edge technological advancements to ensure enhanced scanning is pushing sales in Asian countries like India and China.

Category-wise Landscape

Category By Component Type
Leading Segment Hardware
Market Share (2025) 25.8%
Category By Frequency Band Type
Leading Segment D-Band (L Band Radar)
Market Share (2025) 30.5%

What is the Segmentation Outlook for the Integrated 3D Radar Market?

The integrated 3D radar market is categorized by Component, Frequency Band, Industry, and Platform. These categories are further divided into small segments that expand their channels in multiple market spaces. These segments perform differently in various markets as they have a stronghold in numerous regions.

According to a component category, the segments are; Hardware, Software, and Services, while the frequency band is divided into HF-UND VHF-RADAR, C-Band (UHF-Radar), D-Band (L-Band Radar), E/F- Band (S-Band Radar). The industry category is divided into automotive & public infrastructure, energy & utilities, and government, while the platform category is divided into airborne, ground, and naval.

Which Segment is likely to Lead the Integrated 3D Radar Market by Component?

By component, the FMI study finds that the hardware component has the highest sales potential through 2035. The application of hardware-integrated radar components is high and is likely to record a CAGR of 12.5% during the forecast period. The segment held a market share of 25.8 in 2025.

Consumer demand for hardware systems is attributed to their nature of working well without any outside source or software, easy implementation, and dynamic price range. In the forecast period, sales of hardware components of integrated 3D radar systems are estimated to grow excessively in order to provide better monitoring and scanning experience, security, and flexibility. This pushes the sales of integrated 3D radar systems in the new regions.

Which Segment is likely to Lead the Integrated 3D Radar Market by Frequency Band?

By frequency band, D-Band (L Band Radar) is the leading segment in the integrated 3D radar market and is expected to hold a significant portion in the forecast period. The segment is thriving at a robust CAGR of 12.9% between 2025 and 2035. The segment held a market share of 30.5% in 2025.

The factors behind the growth of this segment are the high consumption of it in military aircraft, civil airfields, and unmanned aerial vehicles (UAVs), fueling the sales of instant payment platforms.
Competition Scenario

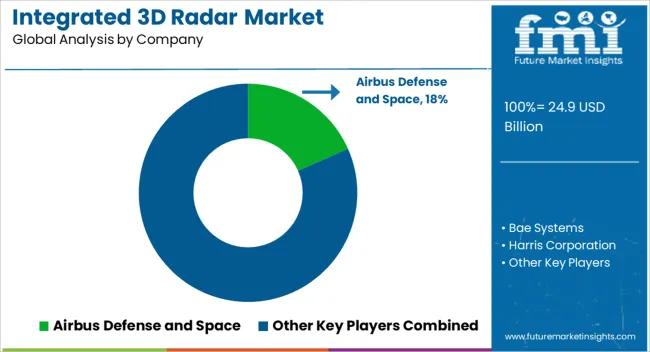
Integrated 3d Radar Market Analysis By Company

The competitive landscape of integrated 3D radar is diversified and makes the market more exclusive for new players. Vendors are trying to make their platforms more flexible for technological advancements while improving the bandwidth.

Companies also compete to get the government’s projects. The vendor companies also focus on mergers and collaborations to expand their distribution channels in new regions.

Market Developments

  • Airbus Defense & Space has introduced its integrated 3D radar that may enhance detection capabilities and suppression of interference signals on airport surveillance radar, fueling the sales of integrated 3D radar systems.
  • Bae Systems plc has introduced its Artisan 3D radar system and has completed sea-based acceptance trials, fueling the sales of the integrated 3D radar systems.
  • Indra installs the navel version of Lanza 3D integrated radar on an Indian Navy front-line ship. The brand is expected to install 23 radar systems in the coming time.

Key Players

  • Airbus Defense & Space
  • Bae Systems Plc
  • Harris Corporation
  • Honeywell International Inc
  • Leonardo S.p.a

Key Segments Covered

By Component:

  • Hardware
  • Software
  • Services
  • Consulting
  • Installation & Integration
  • Maintenance

By Frequency Band:

  • HF-UND VHF-RADAR
  • C-Band (UHF-Radar)
  • D-Band (L-Band Radar)
  • E/F-Band (S-Band Radar)

By Industry:

  • Automotive & Public Infrastructure
  • Energy and Utilities
  • Government

By Platform:

  • Airborne
  • Ground
  • Navel

Key Regions Covered:

  • North America
    • United States
    • Canada
  • Latin America
    • Brazil
    • Mexico
    • Rest of Latin America
  • Europe
    • Germany
    • The United Kingdom
    • France
    • Spain
    • Russia
    • Rest of Europe
  • Japan
  • Asia Pacific Excluding Japan
    • China
    • India
    • Malaysia
    • Singapore
    • Australia
    • Rest of Asia Pacific Excluding Japan (APEJ)
  • The Middle East and Africa
    • GCC Countries
    • Israel
    • South Africa
    • Middle East and Africa (MEA)

Table of Content

  1. Executive Summary
    • Global Market Outlook
    • Demand-side Trends
    • Supply-side Trends
    • Technology Roadmap Analysis
    • Analysis and Recommendations
  2. Market Overview
    • Market Coverage / Taxonomy
    • Market Definition / Scope / Limitations
  3. Market Background
    • Market Dynamics
      • Drivers
      • Restraints
      • Opportunity
      • Trends
    • Scenario Forecast
      • Demand in Optimistic Scenario
      • Demand in Likely Scenario
      • Demand in Conservative Scenario
    • Opportunity Map Analysis
    • Product Life Cycle Analysis
    • Supply Chain Analysis
    • Investment Feasibility Matrix
    • Value Chain Analysis
    • PESTLE and Porter’s Analysis
    • Regulatory Landscape
    • Regional Parent Market Outlook
    • Production and Consumption Statistics
    • Import and Export Statistics
  4. Global Integrated 3D Radar Market Analysis 2020-2024 and Forecast, 2025-2035
    • Historical Market Size Value (USD Mn) Analysis, 2020-2024
    • Current and Future Market Size Value (USD Mn) Projections, 2025-2035
      • Y-o-Y Growth Trend Analysis
      • Absolute $ Opportunity Analysis
  5. Global Integrated 3D Radar Market Pricing Analysis 2020-2024 and Forecast 2025-2035
  6. Global Integrated 3D Radar Market Analysis 2020-2024 and Forecast 2025-2035, By Component
    • Introduction / Key Findings
    • Historical Market Size Value (USD Mn) Analysis By Component , 2020-2024
    • Current and Future Market Size Value (USD Mn) Analysis and Forecast By Component , 2025-2035
      • Hardware
      • Software
      • Services
      • Consulting
      • Installation & Integration
      • Maintenance
    • Y-o-Y Growth Trend Analysis By Component , 2020-2024
    • Absolute $ Opportunity Analysis By Component , 2025-2035
  7. Global Integrated 3D Radar Market Analysis 2020-2024 and Forecast 2025-2035, By Frequency Band
    • Introduction / Key Findings
    • Historical Market Size Value (USD Mn) Analysis By Frequency Band, 2020-2024
    • Current and Future Market Size Value (USD Mn) Analysis and Forecast By Frequency Band, 2025-2035
      • HF-UND VHF RADAR
      • C-Band (UHF-Radar)
      • D-Band (L-Band Radar)
      • E/F-Band (S-Band Radar)
    • Y-o-Y Growth Trend Analysis By Frequency Band, 2020-2024
    • Absolute $ Opportunity Analysis By Frequency Band, 2025-2035
  8. Global Integrated 3D Radar Market Analysis 2020-2024 and Forecast 2025-2035, By Industry
    • Introduction / Key Findings
    • Historical Market Size Value (USD Mn) Analysis By Industry, 2020-2024
    • Current and Future Market Size Value (USD Mn) Analysis and Forecast By Industry, 2025-2035
      • Automotive & Public Infrastructure
      • Energy And Utilities
      • Government
    • Y-o-Y Growth Trend Analysis By Industry, 2020-2024
    • Absolute $ Opportunity Analysis By Industry, 2025-2035
  9. Global Integrated 3D Radar Market Analysis 2020-2024 and Forecast 2025-2035, By Platform
    • Introduction / Key Findings
    • Historical Market Size Value (USD Mn) Analysis By Platform, 2020-2024
    • Current and Future Market Size Value (USD Mn) Analysis and Forecast By Platform, 2025-2035
      • Airborne
      • Ground
      • Navel
    • Y-o-Y Growth Trend Analysis By Platform, 2020-2024
    • Absolute $ Opportunity Analysis By Platform, 2025-2035
  10. Global Integrated 3D Radar Market Analysis 2020-2024 and Forecast 2025-2035, By Region
    • Introduction
    • Historical Market Size Value (USD Mn) Analysis By Region, 2020-2024
    • Current Market Size Value (USD Mn) Analysis and Forecast By Region, 2025-2035
      • North America
      • Latin America
      • Western Europe
      • Eastern Europe
      • East Asia
      • South Asia and Pacific
      • Middle East & Africa
    • Market Attractiveness Analysis By Region
  11. North America Integrated 3D Radar Market Analysis 2020-2024 and Forecast 2025-2035, By Country
    • Historical Market Size Value (USD Mn) Trend Analysis By Market Taxonomy, 2020-2024
    • Market Size Value (USD Mn) Forecast By Market Taxonomy, 2025-2035
      • By Country
        • USA
        • Canada
        • Mexico
      • By Component
      • By Frequency Band
      • By Industry
      • By Platform
    • Market Attractiveness Analysis
      • By Country
      • By Component
      • By Frequency Band
      • By Industry
      • By Platform
    • Key Takeaways
  12. Latin America Integrated 3D Radar Market Analysis 2020-2024 and Forecast 2025-2035, By Country
    • Historical Market Size Value (USD Mn) Trend Analysis By Market Taxonomy, 2020-2024
    • Market Size Value (USD Mn) Forecast By Market Taxonomy, 2025-2035
      • By Country
        • Brazil
        • Chile
        • Rest of Latin America
      • By Component
      • By Frequency Band
      • By Industry
      • By Platform
    • Market Attractiveness Analysis
      • By Country
      • By Component
      • By Frequency Band
      • By Industry
      • By Platform
    • Key Takeaways
  13. Western Europe Integrated 3D Radar Market Analysis 2020-2024 and Forecast 2025-2035, By Country
    • Historical Market Size Value (USD Mn) Trend Analysis By Market Taxonomy, 2020-2024
    • Market Size Value (USD Mn) Forecast By Market Taxonomy, 2025-2035
      • By Country
        • Germany
        • UK
        • Italy
        • Spain
        • France
        • Nordic
        • BENELUX
        • Rest of Western Europe
      • By Component
      • By Frequency Band
      • By Industry
      • By Platform
    • Market Attractiveness Analysis
      • By Country
      • By Component
      • By Frequency Band
      • By Industry
      • By Platform
    • Key Takeaways
  14. Eastern Europe Integrated 3D Radar Market Analysis 2020-2024 and Forecast 2025-2035, By Country
    • Historical Market Size Value (USD Mn) Trend Analysis By Market Taxonomy, 2020-2024
    • Market Size Value (USD Mn) Forecast By Market Taxonomy, 2025-2035
      • By Country
        • Russia
        • Poland
        • Hungary
        • Balkan & Baltic
        • Rest of Eastern Europe
      • By Component
      • By Frequency Band
      • By Industry
      • By Platform
    • Market Attractiveness Analysis
      • By Country
      • By Component
      • By Frequency Band
      • By Industry
      • By Platform
    • Key Takeaways
  15. East Asia Integrated 3D Radar Market Analysis 2020-2024 and Forecast 2025-2035, By Country
    • Historical Market Size Value (USD Mn) Trend Analysis By Market Taxonomy, 2020-2024
    • Market Size Value (USD Mn) Forecast By Market Taxonomy, 2025-2035
      • By Country
        • China
        • Japan
        • South Korea
      • By Component
      • By Frequency Band
      • By Industry
      • By Platform
    • Market Attractiveness Analysis
      • By Country
      • By Component
      • By Frequency Band
      • By Industry
      • By Platform
    • Key Takeaways
  16. South Asia and Pacific Integrated 3D Radar Market Analysis 2020-2024 and Forecast 2025-2035, By Country
    • Historical Market Size Value (USD Mn) Trend Analysis By Market Taxonomy, 2020-2024
    • Market Size Value (USD Mn) Forecast By Market Taxonomy, 2025-2035
      • By Country
        • India
        • ASEAN
        • Australia & New Zealand
        • Rest of South Asia and Pacific
      • By Component
      • By Frequency Band
      • By Industry
      • By Platform
    • Market Attractiveness Analysis
      • By Country
      • By Component
      • By Frequency Band
      • By Industry
      • By Platform
    • Key Takeaways
  17. Middle East & Africa Integrated 3D Radar Market Analysis 2020-2024 and Forecast 2025-2035, By Country
    • Historical Market Size Value (USD Mn) Trend Analysis By Market Taxonomy, 2020-2024
    • Market Size Value (USD Mn) Forecast By Market Taxonomy, 2025-2035
      • By Country
        • Kingdom of Saudi Arabia
        • Other GCC Countries
        • Turkiye
        • South Africa
        • Other African Union
        • Rest of Middle East & Africa
      • By Component
      • By Frequency Band
      • By Industry
      • By Platform
    • Market Attractiveness Analysis
      • By Country
      • By Component
      • By Frequency Band
      • By Industry
      • By Platform
    • Key Takeaways
  18. Key Countries Integrated 3D Radar Market Analysis
    • USA
      • Pricing Analysis
      • Market Share Analysis, 2024
        • By Component
        • By Frequency Band
        • By Industry
        • By Platform
    • Canada
      • Pricing Analysis
      • Market Share Analysis, 2024
        • By Component
        • By Frequency Band
        • By Industry
        • By Platform
    • Mexico
      • Pricing Analysis
      • Market Share Analysis, 2024
        • By Component
        • By Frequency Band
        • By Industry
        • By Platform
    • Brazil
      • Pricing Analysis
      • Market Share Analysis, 2024
        • By Component
        • By Frequency Band
        • By Industry
        • By Platform
    • Chile
      • Pricing Analysis
      • Market Share Analysis, 2024
        • By Component
        • By Frequency Band
        • By Industry
        • By Platform
    • Germany
      • Pricing Analysis
      • Market Share Analysis, 2024
        • By Component
        • By Frequency Band
        • By Industry
        • By Platform
    • UK
      • Pricing Analysis
      • Market Share Analysis, 2024
        • By Component
        • By Frequency Band
        • By Industry
        • By Platform
    • Italy
      • Pricing Analysis
      • Market Share Analysis, 2024
        • By Component
        • By Frequency Band
        • By Industry
        • By Platform
    • Spain
      • Pricing Analysis
      • Market Share Analysis, 2024
        • By Component
        • By Frequency Band
        • By Industry
        • By Platform
    • France
      • Pricing Analysis
      • Market Share Analysis, 2024
        • By Component
        • By Frequency Band
        • By Industry
        • By Platform
    • India
      • Pricing Analysis
      • Market Share Analysis, 2024
        • By Component
        • By Frequency Band
        • By Industry
        • By Platform
    • ASEAN
      • Pricing Analysis
      • Market Share Analysis, 2024
        • By Component
        • By Frequency Band
        • By Industry
        • By Platform
    • Australia & New Zealand
      • Pricing Analysis
      • Market Share Analysis, 2024
        • By Component
        • By Frequency Band
        • By Industry
        • By Platform
    • China
      • Pricing Analysis
      • Market Share Analysis, 2024
        • By Component
        • By Frequency Band
        • By Industry
        • By Platform
    • Japan
      • Pricing Analysis
      • Market Share Analysis, 2024
        • By Component
        • By Frequency Band
        • By Industry
        • By Platform
    • South Korea
      • Pricing Analysis
      • Market Share Analysis, 2024
        • By Component
        • By Frequency Band
        • By Industry
        • By Platform
    • Russia
      • Pricing Analysis
      • Market Share Analysis, 2024
        • By Component
        • By Frequency Band
        • By Industry
        • By Platform
    • Poland
      • Pricing Analysis
      • Market Share Analysis, 2024
        • By Component
        • By Frequency Band
        • By Industry
        • By Platform
    • Hungary
      • Pricing Analysis
      • Market Share Analysis, 2024
        • By Component
        • By Frequency Band
        • By Industry
        • By Platform
    • Kingdom of Saudi Arabia
      • Pricing Analysis
      • Market Share Analysis, 2024
        • By Component
        • By Frequency Band
        • By Industry
        • By Platform
    • Turkiye
      • Pricing Analysis
      • Market Share Analysis, 2024
        • By Component
        • By Frequency Band
        • By Industry
        • By Platform
    • South Africa
      • Pricing Analysis
      • Market Share Analysis, 2024
        • By Component
        • By Frequency Band
        • By Industry
        • By Platform
  19. Market Structure Analysis
    • Competition Dashboard
    • Competition Benchmarking
    • Market Share Analysis of Top Players
      • By Regional
      • By Component
      • By Frequency Band
      • By Industry
      • By Platform
  20. Competition Analysis
    • Competition Deep Dive
      • Airbus Defense and Space
        • Overview
        • Product Portfolio
        • Profitability by Market Segments (Product/Age /Sales Channel/Region)
        • Sales Footprint
        • Strategy Overview
          • Marketing Strategy
          • Product Strategy
          • Channel Strategy
      • Bae Systems
      • Harris Corporation
      • Honeywell International
      • Leonardo SpA
      • Northrop Grumman
      • Raytheon
      • Saab
      • Thales Group
      • Teledyne Technologies
  21. Assumptions & Acronyms Used
  22. Research Methodology

List of Tables

  • Table 1: Global Integrated 3D Radar Market Value (USD Mn) Forecast by Region, 2020-2035
  • Table 2: Global Integrated 3D Radar Market Value (USD Mn) Forecast by Component , 2020-2035
  • Table 3: Global Integrated 3D Radar Market Value (USD Mn) Forecast by Frequency Band, 2020-2035
  • Table 4: Global Integrated 3D Radar Market Value (USD Mn) Forecast by Industry, 2020-2035
  • Table 5: Global Integrated 3D Radar Market Value (USD Mn) Forecast by Platform, 2020-2035
  • Table 6: North America Integrated 3D Radar Market Value (USD Mn) Forecast by Country, 2020-2035
  • Table 7: North America Integrated 3D Radar Market Value (USD Mn) Forecast by Component , 2020-2035
  • Table 8: North America Integrated 3D Radar Market Value (USD Mn) Forecast by Frequency Band, 2020-2035
  • Table 9: North America Integrated 3D Radar Market Value (USD Mn) Forecast by Industry, 2020-2035
  • Table 10: North America Integrated 3D Radar Market Value (USD Mn) Forecast by Platform, 2020-2035
  • Table 11: Latin America Integrated 3D Radar Market Value (USD Mn) Forecast by Country, 2020-2035
  • Table 12: Latin America Integrated 3D Radar Market Value (USD Mn) Forecast by Component , 2020-2035
  • Table 13: Latin America Integrated 3D Radar Market Value (USD Mn) Forecast by Frequency Band, 2020-2035
  • Table 14: Latin America Integrated 3D Radar Market Value (USD Mn) Forecast by Industry, 2020-2035
  • Table 15: Latin America Integrated 3D Radar Market Value (USD Mn) Forecast by Platform, 2020-2035
  • Table 16: Western Europe Integrated 3D Radar Market Value (USD Mn) Forecast by Country, 2020-2035
  • Table 17: Western Europe Integrated 3D Radar Market Value (USD Mn) Forecast by Component , 2020-2035
  • Table 18: Western Europe Integrated 3D Radar Market Value (USD Mn) Forecast by Frequency Band, 2020-2035
  • Table 19: Western Europe Integrated 3D Radar Market Value (USD Mn) Forecast by Industry, 2020-2035
  • Table 20: Western Europe Integrated 3D Radar Market Value (USD Mn) Forecast by Platform, 2020-2035
  • Table 21: Eastern Europe Integrated 3D Radar Market Value (USD Mn) Forecast by Country, 2020-2035
  • Table 22: Eastern Europe Integrated 3D Radar Market Value (USD Mn) Forecast by Component , 2020-2035
  • Table 23: Eastern Europe Integrated 3D Radar Market Value (USD Mn) Forecast by Frequency Band, 2020-2035
  • Table 24: Eastern Europe Integrated 3D Radar Market Value (USD Mn) Forecast by Industry, 2020-2035
  • Table 25: Eastern Europe Integrated 3D Radar Market Value (USD Mn) Forecast by Platform, 2020-2035
  • Table 26: East Asia Integrated 3D Radar Market Value (USD Mn) Forecast by Country, 2020-2035
  • Table 27: East Asia Integrated 3D Radar Market Value (USD Mn) Forecast by Component , 2020-2035
  • Table 28: East Asia Integrated 3D Radar Market Value (USD Mn) Forecast by Frequency Band, 2020-2035
  • Table 29: East Asia Integrated 3D Radar Market Value (USD Mn) Forecast by Industry, 2020-2035
  • Table 30: East Asia Integrated 3D Radar Market Value (USD Mn) Forecast by Platform, 2020-2035
  • Table 31: South Asia and Pacific Integrated 3D Radar Market Value (USD Mn) Forecast by Country, 2020-2035
  • Table 32: South Asia and Pacific Integrated 3D Radar Market Value (USD Mn) Forecast by Component , 2020-2035
  • Table 33: South Asia and Pacific Integrated 3D Radar Market Value (USD Mn) Forecast by Frequency Band, 2020-2035
  • Table 34: South Asia and Pacific Integrated 3D Radar Market Value (USD Mn) Forecast by Industry, 2020-2035
  • Table 35: South Asia and Pacific Integrated 3D Radar Market Value (USD Mn) Forecast by Platform, 2020-2035
  • Table 36: Middle East & Africa Integrated 3D Radar Market Value (USD Mn) Forecast by Country, 2020-2035
  • Table 37: Middle East & Africa Integrated 3D Radar Market Value (USD Mn) Forecast by Component , 2020-2035
  • Table 38: Middle East & Africa Integrated 3D Radar Market Value (USD Mn) Forecast by Frequency Band, 2020-2035
  • Table 39: Middle East & Africa Integrated 3D Radar Market Value (USD Mn) Forecast by Industry, 2020-2035
  • Table 40: Middle East & Africa Integrated 3D Radar Market Value (USD Mn) Forecast by Platform, 2020-2035

List of Figures

  • Figure 1: Global Integrated 3D Radar Market Pricing Analysis
  • Figure 2: Global Integrated 3D Radar Market Value (USD Mn) Forecast 2020–2035
  • Figure 3: Global Integrated 3D Radar Market Value Share and BPS Analysis by Component , 2025 and 2035
  • Figure 4: Global Integrated 3D Radar Market Y-o-Y Growth Comparison by Component , 2025–2035
  • Figure 5: Global Integrated 3D Radar Market Attractiveness Analysis by Component
  • Figure 6: Global Integrated 3D Radar Market Value Share and BPS Analysis by Frequency Band, 2025 and 2035
  • Figure 7: Global Integrated 3D Radar Market Y-o-Y Growth Comparison by Frequency Band, 2025–2035
  • Figure 8: Global Integrated 3D Radar Market Attractiveness Analysis by Frequency Band
  • Figure 9: Global Integrated 3D Radar Market Value Share and BPS Analysis by Industry, 2025 and 2035
  • Figure 10: Global Integrated 3D Radar Market Y-o-Y Growth Comparison by Industry, 2025–2035
  • Figure 11: Global Integrated 3D Radar Market Attractiveness Analysis by Industry
  • Figure 12: Global Integrated 3D Radar Market Value Share and BPS Analysis by Platform, 2025 and 2035
  • Figure 13: Global Integrated 3D Radar Market Y-o-Y Growth Comparison by Platform, 2025–2035
  • Figure 14: Global Integrated 3D Radar Market Attractiveness Analysis by Platform
  • Figure 15: Global Integrated 3D Radar Market Value (USD Mn) Share and BPS Analysis by Region, 2025 and 2035
  • Figure 16: Global Integrated 3D Radar Market Y-o-Y Growth Comparison by Region, 2025–2035
  • Figure 17: Global Integrated 3D Radar Market Attractiveness Analysis by Region
  • Figure 18: North America Integrated 3D Radar Market Incremental Dollar Opportunity, 2025–2035
  • Figure 19: Latin America Integrated 3D Radar Market Incremental Dollar Opportunity, 2025–2035
  • Figure 20: Western Europe Integrated 3D Radar Market Incremental Dollar Opportunity, 2025–2035
  • Figure 21: Eastern Europe Integrated 3D Radar Market Incremental Dollar Opportunity, 2025–2035
  • Figure 22: East Asia Integrated 3D Radar Market Incremental Dollar Opportunity, 2025–2035
  • Figure 23: South Asia and Pacific Integrated 3D Radar Market Incremental Dollar Opportunity, 2025–2035
  • Figure 24: Middle East & Africa Integrated 3D Radar Market Incremental Dollar Opportunity, 2025–2035
  • Figure 25: North America Integrated 3D Radar Market Value Share and BPS Analysis by Country, 2025 and 2035
  • Figure 26: North America Integrated 3D Radar Market Value Share and BPS Analysis by Component , 2025 and 2035
  • Figure 27: North America Integrated 3D Radar Market Y-o-Y Growth Comparison by Component , 2025–2035
  • Figure 28: North America Integrated 3D Radar Market Attractiveness Analysis by Component
  • Figure 29: North America Integrated 3D Radar Market Value Share and BPS Analysis by Frequency Band, 2025 and 2035
  • Figure 30: North America Integrated 3D Radar Market Y-o-Y Growth Comparison by Frequency Band, 2025–2035
  • Figure 31: North America Integrated 3D Radar Market Attractiveness Analysis by Frequency Band
  • Figure 32: North America Integrated 3D Radar Market Value Share and BPS Analysis by Industry, 2025 and 2035
  • Figure 33: North America Integrated 3D Radar Market Y-o-Y Growth Comparison by Industry, 2025–2035
  • Figure 34: North America Integrated 3D Radar Market Attractiveness Analysis by Industry
  • Figure 35: North America Integrated 3D Radar Market Value Share and BPS Analysis by Platform, 2025 and 2035
  • Figure 36: North America Integrated 3D Radar Market Y-o-Y Growth Comparison by Platform, 2025–2035
  • Figure 37: North America Integrated 3D Radar Market Attractiveness Analysis by Platform
  • Figure 38: Latin America Integrated 3D Radar Market Value Share and BPS Analysis by Country, 2025 and 2035
  • Figure 39: Latin America Integrated 3D Radar Market Value Share and BPS Analysis by Component , 2025 and 2035
  • Figure 40: Latin America Integrated 3D Radar Market Y-o-Y Growth Comparison by Component , 2025–2035
  • Figure 41: Latin America Integrated 3D Radar Market Attractiveness Analysis by Component
  • Figure 42: Latin America Integrated 3D Radar Market Value Share and BPS Analysis by Frequency Band, 2025 and 2035
  • Figure 43: Latin America Integrated 3D Radar Market Y-o-Y Growth Comparison by Frequency Band, 2025–2035
  • Figure 44: Latin America Integrated 3D Radar Market Attractiveness Analysis by Frequency Band
  • Figure 45: Latin America Integrated 3D Radar Market Value Share and BPS Analysis by Industry, 2025 and 2035
  • Figure 46: Latin America Integrated 3D Radar Market Y-o-Y Growth Comparison by Industry, 2025–2035
  • Figure 47: Latin America Integrated 3D Radar Market Attractiveness Analysis by Industry
  • Figure 48: Latin America Integrated 3D Radar Market Value Share and BPS Analysis by Platform, 2025 and 2035
  • Figure 49: Latin America Integrated 3D Radar Market Y-o-Y Growth Comparison by Platform, 2025–2035
  • Figure 50: Latin America Integrated 3D Radar Market Attractiveness Analysis by Platform
  • Figure 51: Western Europe Integrated 3D Radar Market Value Share and BPS Analysis by Country, 2025 and 2035
  • Figure 52: Western Europe Integrated 3D Radar Market Value Share and BPS Analysis by Component , 2025 and 2035
  • Figure 53: Western Europe Integrated 3D Radar Market Y-o-Y Growth Comparison by Component , 2025–2035
  • Figure 54: Western Europe Integrated 3D Radar Market Attractiveness Analysis by Component
  • Figure 55: Western Europe Integrated 3D Radar Market Value Share and BPS Analysis by Frequency Band, 2025 and 2035
  • Figure 56: Western Europe Integrated 3D Radar Market Y-o-Y Growth Comparison by Frequency Band, 2025–2035
  • Figure 57: Western Europe Integrated 3D Radar Market Attractiveness Analysis by Frequency Band
  • Figure 58: Western Europe Integrated 3D Radar Market Value Share and BPS Analysis by Industry, 2025 and 2035
  • Figure 59: Western Europe Integrated 3D Radar Market Y-o-Y Growth Comparison by Industry, 2025–2035
  • Figure 60: Western Europe Integrated 3D Radar Market Attractiveness Analysis by Industry
  • Figure 61: Western Europe Integrated 3D Radar Market Value Share and BPS Analysis by Platform, 2025 and 2035
  • Figure 62: Western Europe Integrated 3D Radar Market Y-o-Y Growth Comparison by Platform, 2025–2035
  • Figure 63: Western Europe Integrated 3D Radar Market Attractiveness Analysis by Platform
  • Figure 64: Eastern Europe Integrated 3D Radar Market Value Share and BPS Analysis by Country, 2025 and 2035
  • Figure 65: Eastern Europe Integrated 3D Radar Market Value Share and BPS Analysis by Component , 2025 and 2035
  • Figure 66: Eastern Europe Integrated 3D Radar Market Y-o-Y Growth Comparison by Component , 2025–2035
  • Figure 67: Eastern Europe Integrated 3D Radar Market Attractiveness Analysis by Component
  • Figure 68: Eastern Europe Integrated 3D Radar Market Value Share and BPS Analysis by Frequency Band, 2025 and 2035
  • Figure 69: Eastern Europe Integrated 3D Radar Market Y-o-Y Growth Comparison by Frequency Band, 2025–2035
  • Figure 70: Eastern Europe Integrated 3D Radar Market Attractiveness Analysis by Frequency Band
  • Figure 71: Eastern Europe Integrated 3D Radar Market Value Share and BPS Analysis by Industry, 2025 and 2035
  • Figure 72: Eastern Europe Integrated 3D Radar Market Y-o-Y Growth Comparison by Industry, 2025–2035
  • Figure 73: Eastern Europe Integrated 3D Radar Market Attractiveness Analysis by Industry
  • Figure 74: Eastern Europe Integrated 3D Radar Market Value Share and BPS Analysis by Platform, 2025 and 2035
  • Figure 75: Eastern Europe Integrated 3D Radar Market Y-o-Y Growth Comparison by Platform, 2025–2035
  • Figure 76: Eastern Europe Integrated 3D Radar Market Attractiveness Analysis by Platform
  • Figure 77: East Asia Integrated 3D Radar Market Value Share and BPS Analysis by Country, 2025 and 2035
  • Figure 78: East Asia Integrated 3D Radar Market Value Share and BPS Analysis by Component , 2025 and 2035
  • Figure 79: East Asia Integrated 3D Radar Market Y-o-Y Growth Comparison by Component , 2025–2035
  • Figure 80: East Asia Integrated 3D Radar Market Attractiveness Analysis by Component
  • Figure 81: East Asia Integrated 3D Radar Market Value Share and BPS Analysis by Frequency Band, 2025 and 2035
  • Figure 82: East Asia Integrated 3D Radar Market Y-o-Y Growth Comparison by Frequency Band, 2025–2035
  • Figure 83: East Asia Integrated 3D Radar Market Attractiveness Analysis by Frequency Band
  • Figure 84: East Asia Integrated 3D Radar Market Value Share and BPS Analysis by Industry, 2025 and 2035
  • Figure 85: East Asia Integrated 3D Radar Market Y-o-Y Growth Comparison by Industry, 2025–2035
  • Figure 86: East Asia Integrated 3D Radar Market Attractiveness Analysis by Industry
  • Figure 87: East Asia Integrated 3D Radar Market Value Share and BPS Analysis by Platform, 2025 and 2035
  • Figure 88: East Asia Integrated 3D Radar Market Y-o-Y Growth Comparison by Platform, 2025–2035
  • Figure 89: East Asia Integrated 3D Radar Market Attractiveness Analysis by Platform
  • Figure 90: South Asia and Pacific Integrated 3D Radar Market Value Share and BPS Analysis by Country, 2025 and 2035
  • Figure 91: South Asia and Pacific Integrated 3D Radar Market Value Share and BPS Analysis by Component , 2025 and 2035
  • Figure 92: South Asia and Pacific Integrated 3D Radar Market Y-o-Y Growth Comparison by Component , 2025–2035
  • Figure 93: South Asia and Pacific Integrated 3D Radar Market Attractiveness Analysis by Component
  • Figure 94: South Asia and Pacific Integrated 3D Radar Market Value Share and BPS Analysis by Frequency Band, 2025 and 2035
  • Figure 95: South Asia and Pacific Integrated 3D Radar Market Y-o-Y Growth Comparison by Frequency Band, 2025–2035
  • Figure 96: South Asia and Pacific Integrated 3D Radar Market Attractiveness Analysis by Frequency Band
  • Figure 97: South Asia and Pacific Integrated 3D Radar Market Value Share and BPS Analysis by Industry, 2025 and 2035
  • Figure 98: South Asia and Pacific Integrated 3D Radar Market Y-o-Y Growth Comparison by Industry, 2025–2035
  • Figure 99: South Asia and Pacific Integrated 3D Radar Market Attractiveness Analysis by Industry
  • Figure 100: South Asia and Pacific Integrated 3D Radar Market Value Share and BPS Analysis by Platform, 2025 and 2035
  • Figure 101: South Asia and Pacific Integrated 3D Radar Market Y-o-Y Growth Comparison by Platform, 2025–2035
  • Figure 102: South Asia and Pacific Integrated 3D Radar Market Attractiveness Analysis by Platform
  • Figure 103: Middle East & Africa Integrated 3D Radar Market Value Share and BPS Analysis by Country, 2025 and 2035
  • Figure 104: Middle East & Africa Integrated 3D Radar Market Value Share and BPS Analysis by Component , 2025 and 2035
  • Figure 105: Middle East & Africa Integrated 3D Radar Market Y-o-Y Growth Comparison by Component , 2025–2035
  • Figure 106: Middle East & Africa Integrated 3D Radar Market Attractiveness Analysis by Component
  • Figure 107: Middle East & Africa Integrated 3D Radar Market Value Share and BPS Analysis by Frequency Band, 2025 and 2035
  • Figure 108: Middle East & Africa Integrated 3D Radar Market Y-o-Y Growth Comparison by Frequency Band, 2025–2035
  • Figure 109: Middle East & Africa Integrated 3D Radar Market Attractiveness Analysis by Frequency Band
  • Figure 110: Middle East & Africa Integrated 3D Radar Market Value Share and BPS Analysis by Industry, 2025 and 2035
  • Figure 111: Middle East & Africa Integrated 3D Radar Market Y-o-Y Growth Comparison by Industry, 2025–2035
  • Figure 112: Middle East & Africa Integrated 3D Radar Market Attractiveness Analysis by Industry
  • Figure 113: Middle East & Africa Integrated 3D Radar Market Value Share and BPS Analysis by Platform, 2025 and 2035
  • Figure 114: Middle East & Africa Integrated 3D Radar Market Y-o-Y Growth Comparison by Platform, 2025–2035
  • Figure 115: Middle East & Africa Integrated 3D Radar Market Attractiveness Analysis by Platform
  • Figure 116: Global Integrated 3D Radar Market – Tier Structure Analysis
  • Figure 117: Global Integrated 3D Radar Market – Company Share Analysis

Frequently Asked Questions

How big is the integrated 3D radar market in 2025?

The global integrated 3D radar market is estimated to be valued at USD 24.9 billion in 2025.

What will be the size of integrated 3D radar market in 2035?

The market size for the integrated 3D radar market is projected to reach USD 78.8 billion by 2035.

How much will be the integrated 3D radar market growth between 2025 and 2035?

The integrated 3D radar market is expected to grow at a 12.2% CAGR between 2025 and 2035.

What are the key product types in the integrated 3D radar market?

The key product types in integrated 3D radar market are hardware, software, services, consulting, installation & integration and maintenance.

Which frequency band segment to contribute significant share in the integrated 3D radar market in 2025?

In terms of frequency band, hf-und vhf radar segment to command 41.3% share in the integrated 3D radar market in 2025.

Explore Similar Insights

Future Market Insights

Integrated 3D Radar Market

Chat With MaRIA

Chat With

MaRIA

Hi There, I am MaRIA, Your Market Research Intelligence Assistant. How may I help you?