The global Insulated Wires & Cables market is expected to grow steadily as demand for reliable and durable electrical transmission infrastructure increases. Insulated Wires & Cables, essential for protecting electrical currents and minimizing energy losses, are used across a wide range of applications, from power distribution and industrial automation to telecommunications and consumer electronics.
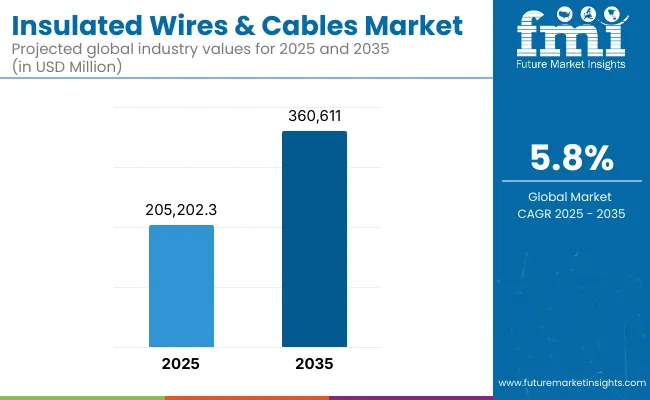
The market is supported by rising energy needs, expanding renewable energy projects, and the ongoing electrification of transportation. In 2025, the global Insulated Wires & Cables market is estimated to be valued at approximately USD 205,202.3 Million. By 2035, it is projected to grow to around USD 360,611.0 Million, reflecting a compound annual growth rate (CAGR) of 5.8%.
In addition, the adoption of advanced insulation materials and innovations in cable design are helping improve efficiency, safety, and durability, further driving market growth. As infrastructure projects and smart grid initiatives gain momentum worldwide, the Insulated Wires & Cables market is poised for consistent expansion through 2035.
Demand remains strong in North America, as infrastructure upgrades, renewable energy developments and continually accelerating uptake in electric vehicles drive demand. The demand for Insulated Wires & Cables is also extremely strong in the USA, Canada, and in residential, commercial and (especially) industrial applications.
Europe is another key market with high renewable energy investments, well developed manufacturing sectors and high safety standards. Germany, UK, France are among the leading countries that are adopting high-performance insulated cables for use in renewable power generation, smart grid system, automotive applications.
The Asia-Pacific region is the fastest-growing region due to rapid urbanization, industrialization, and energy demand. China, India, and Japan have increasing demand for Insulated Wires & Cables owing to an expansion of their power grids, renewable energy capacities, and telecommunications networks. Further, the emphasis on modernizing infrastructure along with the need for power transmission to be energy efficient is likely to support the overall growth of market in the region in the coming years.
Challenges
Raw Material Volatility, Installation Complexity, and Counterfeit Products
The insulated wires & cables market doesn't come without its fair share of challenges, including volatile prices of raw materials - particularly those of copper, aluminum, and polymers (PVC, XLPE, Teflon, etc.) - that have a profound impact on production and pricing strategies. Furthermore, installation complexity and infrastructure limitations, especially in aging electrical grids and developing nations, impede smooth deployment.
New drastically restricting industry standards are a global issue, especially for the construction, automotive and industrial applications industries, particularly with outside manufacturers using low-grade and counterfeit cables that don't meet local standards, degrading safety, performance and compliance with regulation. These issues affect end-user trust and necessitate robust quality control and certification processes throughout supply chains.
Opportunities
Renewable Energy Expansion, Smart Infrastructure, and EV Adoption
These challenges notwithstanding, strong growth prospects for the insulated wires & cables market exist, driven in large part by the overall growth of renewable energy systems (solar, wind, hydropower) and smart grid projects, both of which require high-performance, heat-resistant, and weather-proof insulated cables. growing adoption of electric vehicles (EVs) will further energize the demand for high voltage & specialty insulated cables with enhanced thermal & electromagnetic shielding capabilities.
Moreover, global urban electrification, 5G infrastructure rollout, and data center development are driving fiber optic and high-bandwidth insulated cable demand, also benefiting high-frequency and low-loss applications.
| Market Shift | 2020 to 2024 Trends |
|---|---|
| Regulatory Landscape | Compliance with RoHS, REACH, and IEC/ISO safety standards for insulation materials. |
| Consumer Trends | Demand for durable, energy-efficient, and environmentally safe insulated cables. |
| Industry Adoption | Used across construction, utilities, telecom, and transportation sectors. |
| Supply Chain and Sourcing | Dependent on metal markets, petrochemical insulation producers, and traditional cable OEMs. |
| Market Competition | Dominated by Prysmian, Nexans, Sumitomo, Southwire, LS Cable & System, and General Cable. |
| Market Growth Drivers | Fueled by urbanization, energy infrastructure expansion, and telecom network upgrades. |
| Sustainability and Environmental Impact | Moderate shift to halogen-free, recyclable, and lightweight insulation materials. |
| Integration of Smart Technologies | Limited use of smart testing and quality control systems. |
| Advancements in Insulation Materials | Use of PVC, PE, XLPE, and rubber-based insulation. |
| Market Shift | 2025 to 2035 Projections |
|---|---|
| Regulatory Landscape | Stricter fire-resistant, low-smoke zero-halogen (LSZH), and recyclable insulation regulations. |
| Consumer Trends | Growth in smart cables with real-time diagnostics, flexible installation, and circular economy designs. |
| Industry Adoption | Expansion into EV charging infrastructure, offshore wind energy, and AI-powered grid systems. |
| Supply Chain and Sourcing | Shift toward biopolymer insulation, local material sourcing, and AI-driven inventory optimization. |
| Market Competition | Entry of specialty cable startups, nanotech insulation providers, and green wire innovators. |
| Market Growth Drivers | Accelerated by 5G densification, electrification of transport, and renewable grid connectivity. |
| Sustainability and Environmental Impact | Major focus on eco-labeling, insulation lifecycle tracking, and zero-waste manufacturing. |
| Integration of Smart Technologies | Growth in smart insulated cables with embedded sensors, predictive maintenance, and digital twin simulations. |
| Advancements in Insulation Materials | Evolution toward graphene-infused, nano-coatings, fire-retardant biocomposites, and self-healing polymers. |
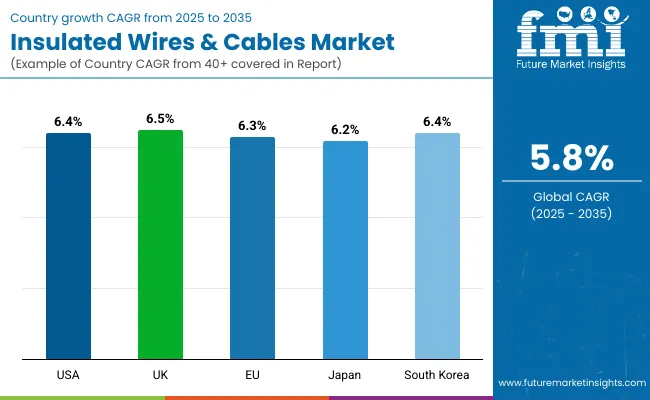
United States consumers are gradually transitioning to energy-efficient power distribution such as insulated wires & cables, further enabling growth in the insulated wires & cables market in the USA. In addition, demand for high-performance insulated cables for both power and communication applications is being driven by expansion in data centers, the rollout of 5G but also the growth in electric vehicle (EV) adoption.
| Country | CAGR (2025 to 2035) |
|---|---|
| USA | 6.4% |
In the UK, the market is benefiting from government-backed infrastructure upgrades, the rollout of EV charging stations, and smart grid implementation. In building construction and retrofitting projects, the growing requirement for fire-retardant and low-smoke insulated wires is also expected to boost the market growth.
| Country | CAGR (2025 to 2035) |
|---|---|
| UK | 6.5% |
EU driven for insulated wires & cables market through disclosure of energy efficiency laws, rapid expansion of renewable energy systems and rising electrification of transportation as well as industrial systems. Demand for high-insulation, low-loss cabling solutions is also propelled by the growing installation of smart buildings and digital infrastructure.
| Country | CAGR (2025 to 2035) |
|---|---|
| European Union (EU) | 6.3% |
Japan is witnessing stable growth for insulated wires & cables market owing to high economic growth infrastructure upgrades of aging grids, growing deployment of robotics across manufacturing and trends towards expanding fiber optic and broadband networks. Increasing use of high-temperature and high-voltage insulated cables for industrial applications.
| Country | CAGR (2025 to 2035) |
|---|---|
| Japan | 6.2% |
In South Korea, the market is steadily growing with the increasing smart manufacturing, semiconductor plants, and energy transmission networks, the growing investment in electrified vehicle infrastructure and high-speed rail systems. There is also increased demand for flexible and compact insulated cables for next-generation electronics.
| Country | CAGR (2025 to 2035) |
|---|---|
| South Korea | 6.4% |
The insulated wires & cables market is witnessing an upward tendency with increasing investments that span across electrification, digital infrastructure, smart cities and integration of renewable energy. Wires and cables are insulated to ensure the safety, durability, and efficiency of electricity and data transmission, and they are vital components of a variety of telecommunication, power distribution, electronics, and construction sectors.
In the effort to ramp up performance, while observing regulatory and sustainability norms across industries, manufacturers are concentrating on next-generation optical fiber apparatus and advanced developments in insulation materials as high-speed connectivity and sustainable infrastructure gain traction. The market has been divided based on Type (Metal, Plastics, Optical Fibre) and End-Use (Telecommunication, Power, Electronics, Construction and Others).
| Type | Market Share (2025) |
|---|---|
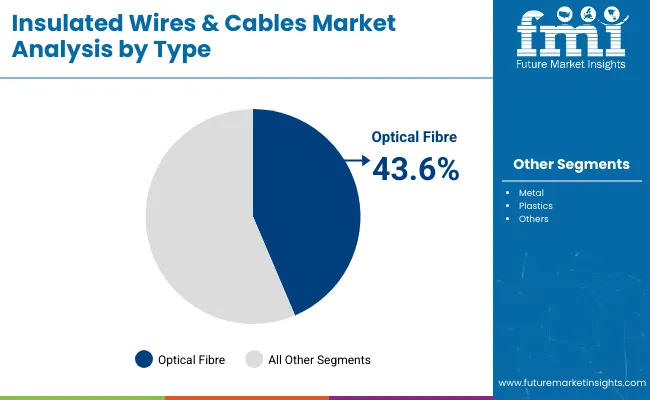
| Optical Fibre | 43.6% |
Based on type, optical fibre segmented dominated the insulated wires & cables market with a share of 43.6% in the global market by 2025. This growth has been mainly driven by the demonstrated fiber-to-the-home (FTTH) growth, and maturity, 5G and the rollout of supporting data centres, and cloud computing infrastructure. Optical fibers allow greater bandwidth, have a faster transfer speed, and are more resistant to electromagnetic interference, giving them an edge in modern telecommunication and internet backbones.
| End Use | Market Share (2025) |
|---|---|
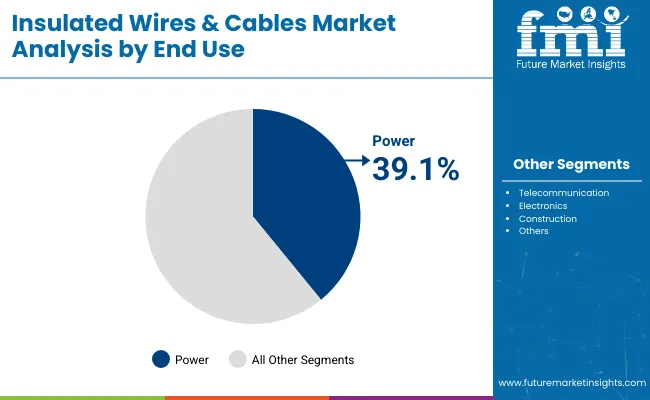
| Power | 39.1% |
The insulated wires & cables market for the power end-use segment is estimated to hold 39.1% market share, followed by building & construction each by value, by 2025. This part of the market benefits from the global push to improve electricity access, upgrade transmission grids and incorporate renewable energy into the grid. In electrically conducting networks, insulated cables are used to supply electricity to local and/or regional distribution networks, substations, and energy storage systems.
Manufacturers are witnessing an increase in demand for heat resistant, flame retardant and high-capacity insulated cables amid growing adoption of electric vehicles, smart grids and high-voltage transmission. The power sector’s domination of cable consumption is being strengthened by ongoing infrastructure projects in Asia Pacific, Africa and Latin America and rising retrofit demand in developed economies.
The insulated wires & cables market has also been fueled by the rising demand in the power transmission, telecom, automotive, and construction industries as well. Significant growth drivers are urban electrification, grid modernization, 5G rollout, and EV adoption. Thermally resistant insulation, Artificial Intelligence-integrated quality testing, flame-retardant material components, and sustainable cable production.
Market Share Analysis by Company
| Company Name | Estimated Market Share (%) |
|---|---|
| Prysmian Group | 18-22% |
| Nexans S.A. | 14-18% |
| Southwire Company, LLC | 10-14% |
| LS Cable & System Ltd. | 8-12% |
| Sumitomo Electric Industries, Ltd. | 6-9% |
| Other Companies (combined) | 25-30% |
| Company Name | Key Offerings/Activities |
|---|---|
| Prysmian Group | In 2024, expanded production of high-voltage submarine insulated cables for renewable energy projects. In 2025, integrated AI-based fault detection systems across its HV cable range. |
| Nexans S.A. | In 2024, launched halogen-free insulated cables for data centers and building infrastructure. In 2025, opened a fully automated smart cable plant with sustainable production lines in Europe. |
| Southwire Company | In 2024, introduced dual-layer insulated power cables for underground grid modernization in North America. In 2025, implemented recyclable polymer insulation solutions across its low-voltage line. |
| LS Cable & System Ltd. | In 2024, began delivery of insulated 5G fiber hybrid cables for smart cities in Southeast Asia. In 2025, upgraded its AI-driven testing lab for HVDC and EV cables. |
| Sumitomo Electric | In 2024, scaled production of heat-resistant insulated cables for EV and hybrid vehicles. In 2025, commercialized next-gen eco-insulated cables for industrial automation. |
Key Company Insights
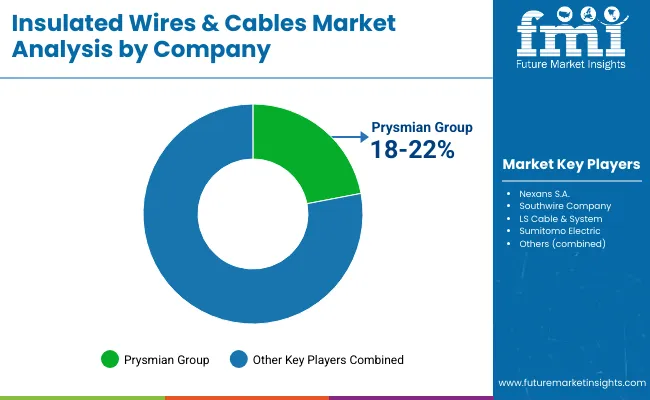
Prysmian Group (18-22%)
Prysmian leads the global market with a strong portfolio across HV, MV, and LV insulated cables. It remains a top supplier for offshore wind farms, smart grids, and AI-monitored infrastructure cabling.
Nexans S.A. (14-18%)
Nexans focuses on energy-efficient and flame-retardant insulation technologies, especially in green buildings, data infrastructure, and electrification of transport systems.
Southwire Company (10-14%)
Southwire holds a strong presence in the North American utility and construction markets, with innovations in sustainable insulation, modular cabling, and AI-assisted cable testing.
LS Cable & System (8-12%)
LS Cable is growing rapidly in Asia-Pacific and the Middle East, with expertise in fiber-insulated telecom and EV cables, and expanding applications in smart infrastructure.
Sumitomo Electric (6-9%)
Sumitomo delivers high-performance heat- and oil-resistant insulation systems for EV, robotics, and automation, with a strong R&D pipeline for green material integration.
Other Key Players (25-30% Combined)
The overall market size for the insulated wires & cables market was USD 205,202.3 Million in 2025.
The insulated wires & cables market is expected to reach USD 360,611.0 Million in 2035.
Growth is driven by the rapid urbanization and industrialization, increasing investment in smart grid and renewable energy infrastructure, rising demand for high-speed data transmission, and advancements in insulation materials for safety and efficiency.
The top 5 countries driving the development of the insulated wires & cables market are China, the USA, India, Germany, and Japan.
Optical Fibre and Power Sector are expected to command a significant share over the assessment period.


Our Research Products

The "Full Research Suite" delivers actionable market intel, deep dives on markets or technologies, so clients act faster, cut risk, and unlock growth.

The Leaderboard benchmarks and ranks top vendors, classifying them as Established Leaders, Leading Challengers, or Disruptors & Challengers.

Locates where complements amplify value and substitutes erode it, forecasting net impact by horizon

We deliver granular, decision-grade intel: market sizing, 5-year forecasts, pricing, adoption, usage, revenue, and operational KPIs—plus competitor tracking, regulation, and value chains—across 60 countries broadly.

Spot the shifts before they hit your P&L. We track inflection points, adoption curves, pricing moves, and ecosystem plays to show where demand is heading, why it is changing, and what to do next across high-growth markets and disruptive tech

Real-time reads of user behavior. We track shifting priorities, perceptions of today’s and next-gen services, and provider experience, then pace how fast tech moves from trial to adoption, blending buyer, consumer, and channel inputs with social signals (#WhySwitch, #UX).

Partner with our analyst team to build a custom report designed around your business priorities. From analysing market trends to assessing competitors or crafting bespoke datasets, we tailor insights to your needs.
Supplier Intelligence
Discovery & Profiling
Capacity & Footprint
Performance & Risk
Compliance & Governance
Commercial Readiness
Who Supplies Whom
Scorecards & Shortlists
Playbooks & Docs
Category Intelligence
Definition & Scope
Demand & Use Cases
Cost Drivers
Market Structure
Supply Chain Map
Trade & Policy
Operating Norms
Deliverables
Buyer Intelligence
Account Basics
Spend & Scope
Procurement Model
Vendor Requirements
Terms & Policies
Entry Strategy
Pain Points & Triggers
Outputs
Pricing Analysis
Benchmarks
Trends
Should-Cost
Indexation
Landed Cost
Commercial Terms
Deliverables
Brand Analysis
Positioning & Value Prop
Share & Presence
Customer Evidence
Go-to-Market
Digital & Reputation
Compliance & Trust
KPIs & Gaps
Outputs
Full Research Suite comprises of:
Market outlook & trends analysis
Interviews & case studies
Strategic recommendations
Vendor profiles & capabilities analysis
5-year forecasts
8 regions and 60+ country-level data splits
Market segment data splits
12 months of continuous data updates
DELIVERED AS:
PDF EXCEL ONLINE
Insulated Products Market Size and Share Forecast Outlook 2025 to 2035
Insulated Packaging Market Size and Share Forecast Outlook 2025 to 2035
Insulated Concrete Form (ICF) Market Size and Share Forecast Outlook 2025 to 2035
Insulated Bins Market Size and Share Forecast Outlook 2025 to 2035
Insulated Tumblers Market Size and Share Forecast Outlook 2025 to 2035
Insulated Corrugated Boxes Market Size and Share Forecast Outlook 2025 to 2035
Insulated Drum Covers Market Size and Share Forecast Outlook 2025 to 2035
Insulated Glass Market Growth – Trends & Forecast 2025 to 2035
Insulated Shipping Boxes Market Innovations & Growth 2025-2035
Insulated Coolers Market Insights - Growth & Forecast 2025 to 2035
Insulated Cup Sleeves Market Analysis – Size, Growth & Forecast 2025 to 2035
Insulated Food Delivery Bags Market Analysis – Growth & Forecast 2025 to 2035
Insulated Gate Bipolar Transistors Market Growth - Trends & Forecast 2025 to 2035
Market Share Breakdown of Leading Insulated Corrugated Boxes Manufacturers
Industry Share Analysis for Insulated Styrofoam Shipping Boxes Companies
Market Share Insights for Insulated Tumblers Providers
Insulated Styrofoam Shipping Boxes Market Growth & Forecast 2025 to 2035
Insulated Food Containers Market
Insulated Envelops Market
Insulated Paper Bags Market

Thank you!
You will receive an email from our Business Development Manager. Please be sure to check your SPAM/JUNK folder too.
Chat With
MaRIA