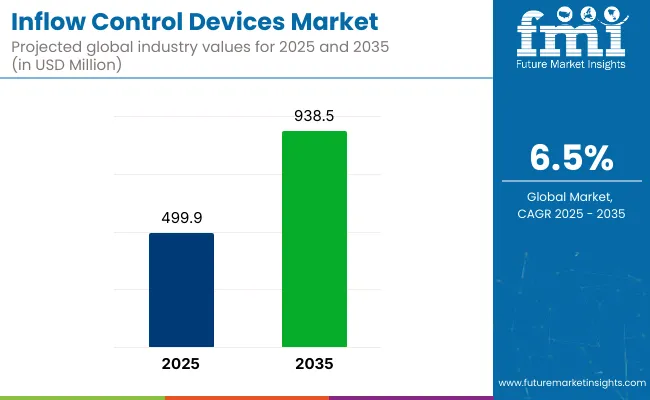
The global inflow control devices market size is projected to reach a valuation of US$ 827.4 million by 2033. It is set to expand at a CAGR of 6.5% in the forecast period from 2023 to 2033. The market is likely to surge by surpassing a valuation of US$ 441.9 million in 2023.
Increasing complexity and maturity of oil & gas fields worldwide have necessitated more efficient reservoir management techniques. Inflow control devices (ICDs) play a crucial role in optimizing production and enhancing recovery rates by regulating fluid flow in the reservoir. This has led to a growing recognition of ICDs as a valuable tool for maximizing reservoir performance.
Another contributing factor to the rising demand for ICDs is depletion of conventional oil & gas reserves. As operators explore unconventional resources such as shale gas and tight oil, they might face unique production challenges.
For instance, the United States Energy Information Administration mentioned that domestic output of petroleum products and lease condensate in the United States fell by 1% in 2021. The state with the biggest net rise in proved reserves in 2021 was Texas, which has the most established stocks of lease condensate and crude oil.
Unconventional reservoirs often exhibit significant variations in permeability and heterogeneity. These can make it difficult to achieve uniform production across the entire reservoir. ICDs might offer a solution by redistributing fluid flow, mitigating unwanted fluid influx, and preventing premature water or gas breakthroughs.
Global push for improved environmental sustainability has further prompted adoption of more advanced reservoir management techniques. ICDs are seen as an environmentally friendly option due to their ability to reduce the carbon footprint of oil & gas production.
By effectively managing fluid flow, ICDs can help minimize water and gas production, reducing the need for costly and environmentally damaging separation processes. This is set to align with growing emphasis on responsible resource extraction practices. It can further help support the sector’s commitment to mitigating its environmental impact.
Increasing demand for ICDs can also be attributed to advancements in technology and innovation. Ongoing research & development efforts have led to the introduction of new and improved ICD designs and materials.
Ongoing advancements have enhanced the reliability, durability, and performance of ICDs. These have also made them more attractive to operators seeking long-term production optimization solutions.
Development of smart ICDs equipped with sensors and data analytics capabilities has further bolstered their appeal. They are capable of providing real-time monitoring and control of reservoir performance.
Rising demand for ICDs can be attributed to growing number of mature oil and gas fields globally. Several of these fields are experiencing declining production rates.
Operators are increasingly turning to ICDs as a cost-effective method to revive and extend the lifespan of these assets. By effectively managing fluid flow and preventing unwanted inflows, ICDs can help maintain reservoir pressure. At the same time, these can delay water or gas breakthroughs and extract the remaining hydrocarbons more efficiently.
Don't pay for what you don't need
Customize your report by selecting specific countries or regions and save 30%!
Attributes | Key Insights |
---|---|
Inflow Control Devices Market Estimated Size (2023E) | US$ 441.9 million |
Projected Market Valuation (2033F) | US$ 827.4 million |
Value-based CAGR (2023 to 2033) | 6.5% |
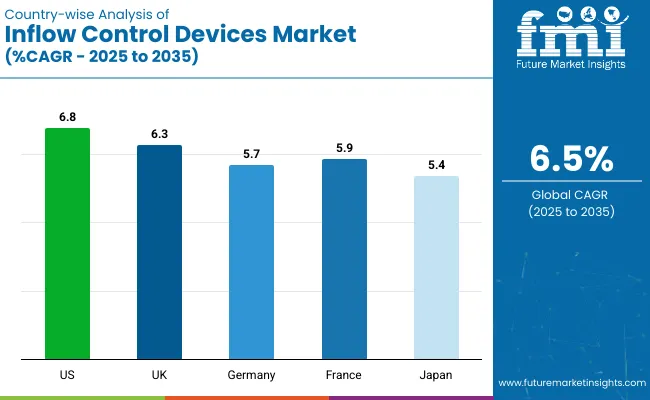
Japan Value-based CAGR (2023 to 2033) | 6.3% |
South Korea Value-based CAGR (2023 to 2033) | 5.9% |
As per Future Market Insights (FMI), the global inflow control devices market is expected to witness a CAGR of 6.5% in the assessment period. It expanded at a decent CAGR of 7.8% in the historical period between 2018 to 2022. Multiple key factors were responsible for the market’s growth in the last 5 years.
As oil & gas fields have become more complex and challenging, there has been a growing need for advanced reservoir management techniques. Several reservoirs exhibit variations in permeability, heterogeneity, and fluid mobility.
Such variations might often lead to uneven fluid flow patterns. ICDs can address these challenges by regulating flow rates and redistributing fluids within the reservoir. Such characteristics might result in more efficient and balanced production.
With depletion of conventional oil & gas reserves, the sector has shifted its focus toward maximizing recovery from existing fields. ICDs have proven to be effective tools for enhancing hydrocarbon recovery rates.
By controlling inflow and managing fluid movement, ICDs can enable operators to delay unwanted water or gas breakthroughs. They can further help optimize sweep efficiency and extract a larger portion of the remaining reserves.
Environmental sustainability has gained prominence in the oil & gas sector. ICDs are likely to contribute to environmentally friendly practices by reducing water and gas production.
It can help to minimize the need for costly separation processes and decrease carbon footprint. Growing environmental concerns and stricter regulations have pushed the adoption of ICDs as part of responsible production practices.
ICDs also offer cost optimization benefits for oil and gas operators. By maintaining reservoir pressure and delaying water or gas breakthroughs, they can help extend the economic life of fields.
They can further reduce the need for costly intervention & workovers and improve production efficiency. These cost-saving advantages have also contributed to the rising demand for ICDs.
Get the data you need at a Fraction of the cost
Personalize your report by choosing insights you need
and save 40%!
Increasing Shale Oil & Gas Exploration in the United States to Boost Demand for Flow Control Devices
The United States inflow control devices market is projected to exceed a valuation of US$ 140.8 million by 2033. It is anticipated to record a CAGR of 6.4% from 2023 to 2033.
The United States has experienced a significant boom in shale oil and gas production in recent years. Shale formations such as the Permian Basin and the Eagle Ford Shale are characterized by low permeability and complex reservoir structures.
As per the United States Energy Information Administration, about 28.5 trillion cubic feet, or 80% of the nation's total production of dry natural gas in 2021, was produced in the United States from shale deposits.
ICDs are increasingly being used in these formations to manage fluid flow, optimize production, and mitigate unwanted fluid influx. As the shale sector continues to expand, demand for ICDs rises to improve the efficiency and profitability of operations.
Multiple oil & gas fields in the United States have also reached a mature stage, with declining production rates. To extract the remaining hydrocarbons effectively and extend lifespan of these fields, operators are employing advanced reservoir management techniques.
It also includes the use of inflow control devices. By controlling inflow and managing fluid distribution, ICDs can help maintain reservoir pressure, delay water or gas breakthroughs, and enhance production efficiency.
Offshore oil and gas production in the United States is gaining prominence. It is expected to be driven by technological advancements and exploration activities in deep water and ultra-deep water regions of the Gulf of Mexico.
Offshore reservoirs might often present challenges such as varying permeability and heterogeneity. ICDs can enable operators to achieve better control over fluid flow. They can further help in improving sweep efficiency and maximizing hydrocarbon recovery from these offshore fields.
Concerns of Water Scarcity in China to Fuel Sales of Water Flow Control Devices
China inflow control devices market is expected to create an absolute dollar opportunity of US$ 76.7 million in the assessment period. It is estimated to register a CAGR of 6.4% during the same period.
China has been actively expanding its domestic oil & gas production to meet growing energy demands. As exploration and production activities increase, there is a greater need for advanced reservoir management techniques, including the use of ICDs. By optimizing fluid flow and controlling inflow, ICDs can help improve production rates and enhance recovery efficiency in China’s oil & gas fields.
The country has substantial unconventional resources, including shale gas and tight oil formations. These resources often present complex reservoir conditions that require specialized production techniques.
The United States Energy Information Administration states that since 2017, development of shale gas has risen substantially in China, expanding about 21% annually. Shale gas output came in at 2.2 Bcf/d in 2021, falling short of the government's goal of 2.9 Bcf/d by 2020.
ICDs can effectively address numerous challenges associated with unconventional reservoirs such as controlling fluid influx and managing heterogeneity. It is further expected to lead to increased interest and potential demand for these devices in China.
Water scarcity and need for effective water management are significant concerns in China's oil & gas sector. ICDs play a vital role in minimizing water production and optimizing fluid flow.
They can help to conserve water resources and reduce the costs associated with water treatment & disposal. Given the focus on sustainable practices and water conservation, ICDs can be a valuable tool for operators, potentially driving sales in China.
The oil & gas sector in China is increasingly recognizing the importance of reservoir management optimization for maximizing production efficiency and economic returns. ICDs are considered a key component of effective reservoir management strategies.
Inflow control device demand is likely to rise as an integral part of optimization efforts among China-based operators. This is attributed to their rising focus on enhancing production rates, extending field life, and improving recovery factors.
Demand for Autonomous Inflow Control Devices to Surge at a Rapid Pace
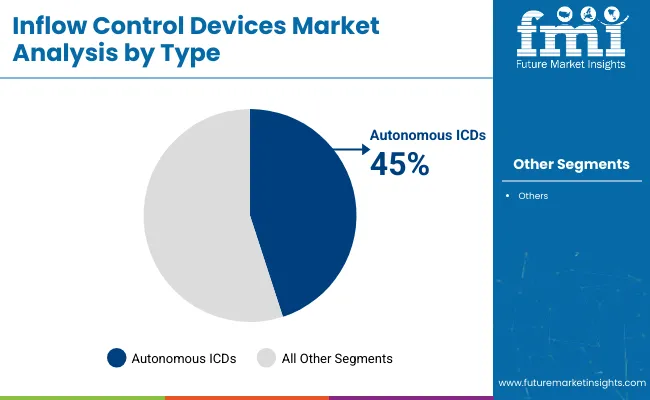
In terms of type, the autonomous inflow control devices (AICD) segment is expected to witness a CAGR of 6.4% in the analysis period. It registered around 7.7% CAGR in the historical period from 2018 to 2022.
AICDs offer advanced capabilities for real-time monitoring and adaptive flow control within the reservoir. By autonomously adjusting flow rates based on dynamic reservoir conditions, these can optimize production efficiency and improve reservoir management. Ability to adapt to changing reservoir parameters and maintain optimal flow distribution might propel demand for AICDs.
Increasing adoption of remote operations and digitalization in the oil & gas sector is also expected to augment demand. AICDs play a crucial role in facilitating remote monitoring and control of reservoir performance.
AICDs equipped with sensors and data analytics capabilities might enable operators to gather valuable reservoir data and make informed decisions remotely. They can hence lead to improved operational efficiency and reduced costs.
Reservoirs with complex geological characteristics such as high heterogeneity or varying permeability pose challenges for traditional inflow control devices. AICDs can provide a dynamic solution to such challenges.
They can help by autonomously adapting to the changing reservoir conditions. This adaptability would allow AICDs to effectively manage fluid flow and mitigate the impact of reservoir complexities, making them increasingly sought after.
Inflow Control Valves to Witness High Demand from Onshore Oil & Gas Reservoirs
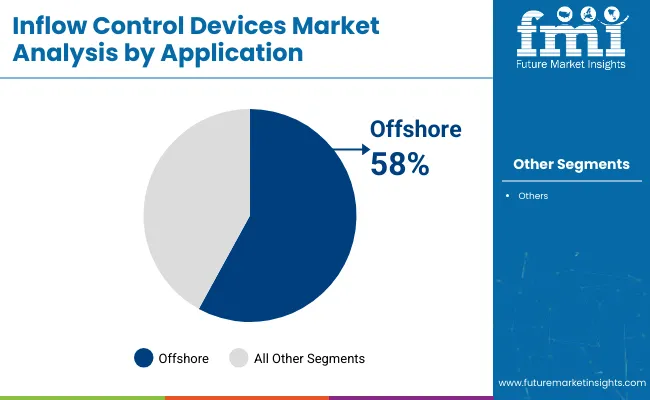
Based on application, the onshore segment is likely to showcase a CAGR of 6.2% in the review period. It exhibited a CAGR of 7.5% in the preceding age.
Onshore oil & gas reservoirs can exhibit complex characteristics such as heterogeneous formations and varying permeability. ICDs are valuable tools in managing fluid flow and mitigating production challenges in such reservoirs.
By controlling inflow rates and optimizing fluid distribution, ICDs can help maintain reservoir pressure. Their ability to improve sweep efficiency and maximize hydrocarbon recovery might also propel demand.
As onshore fields mature, operators face declining production rates and increased water or gas breakthroughs. ICDs offer effective solutions for production optimization.
They help delay unwanted fluid influx, minimize the production of unwanted fluids and maintain stable production rates. This optimization potential is likely to augment demand for ICDs in onshore applications.
Advances in ICD design, materials, and manufacturing processes have further improved the performance and reliability of these devices. Manufacturers have introduced innovative features such as autonomous or smart ICDs equipped with sensors and data analytics capabilities. These advancements have made ICDs more efficient, reliable, and suitable for onshore applications, fueling their increased demand.
Inflow control device (ICD) manufacturers are adopting several strategies to meet the growing demand for their products and stay competitive in the market. To differentiate themselves in the market, they are investing in research & development to innovate and improve their product offerings.
It includes developing advanced designs, materials, and technologies that enhance performance, reliability, and efficiency of ICDs. Manufacturers are constantly exploring new features such as integrated sensors, data analytics capabilities, and adaptive flow control mechanisms. They are aiming to provide more intelligent and effective reservoir management solutions.
They understand that different reservoirs have unique characteristics and production challenges. To address this, they are increasingly focusing on providing customized ICD solutions tailored to specific reservoir conditions.
By collaborating closely with operators and reservoir engineers, manufacturers can design and optimize ICDs to meet specific needs and challenges of individual fields. This strategy might help maximize the effectiveness of ICDs in improving production and recovery rates.
A few prominent players in the inflow control devices market are:
Attributes | Details |
---|---|
Estimated Market Size (2023) | US$ 441.9 million |
Projected Market Valuation (2033) | US$ 827.4 million |
Value-based CAGR (2023 to 2033) | 6.5% |
Historical Data | 2018 to 2022 |
Forecast Period | 2023 to 2033 |
Quantitative Units | Value (US$ million) |
Segments Covered | Type, Application, Region |
Key Countries Covered | North America; Latin America; Western Europe; Eastern Europe; South Asia and Pacific; East Asia; Middle East & Africa |
Key Companies Profiled | Anton Oilfield Services; Baker Hughes Company; China Oilfield Services; Halliburton; Middle East Oilfield Services |
Report Coverage | Revenue Forecast, Volume Forecast, Company Ranking, Competitive Landscape, Growth Factors, Trends and Pricing Analysis |
The market is valued at US$ 441.9 million in 2023.
The growth potential of the market is 6.5%.
The United States market is projected to exceed a valuation of US$ 140.8 million by 2033.
The market is expected to reach US$ 827.4 million by 2033.
United States is expected to expand at a CAGR of 6.4% over the forecast period.
1. Executive Summary
1.1. Global Market Outlook
1.2. Demand-side Trends
1.3. Supply-side Trends
1.4. Technology Roadmap Analysis
1.5. Analysis and Recommendations
2. Market Overview
2.1. Market Coverage / Taxonomy
2.2. Market Definition / Scope / Limitations
3. Market Background
3.1. Market Dynamics
3.1.1. Drivers
3.1.2. Restraints
3.1.3. Opportunity
3.1.4. Trends
3.2. Scenario Forecast
3.2.1. Demand in Optimistic Scenario
3.2.2. Demand in Likely Scenario
3.2.3. Demand in Conservative Scenario
3.3. Opportunity Map Analysis
3.4. Product Life Cycle Analysis
3.5. Supply Chain Analysis
3.5.1. Supply Side Participants and their Roles
3.5.1.1. Producers
3.5.1.2. Mid-Level Participants (Traders/ Agents/ Brokers)
3.5.1.3. Wholesalers and Distributors
3.5.2. Value Added and Value Created at Node in the Supply Chain
3.5.3. List of Raw Material Suppliers
3.5.4. List of Existing and Potential Buyer’s
3.6. Investment Feasibility Matrix
3.7. Value Chain Analysis
3.7.1. Profit Margin Analysis
3.7.2. Wholesalers and Distributors
3.7.3. Retailers
3.8. PESTLE and Porter’s Analysis
3.9. Regulatory Landscape
3.9.1. By Key Regions
3.9.2. By Key Countries
3.10. Regional Parent Market Outlook
3.11. Production and Consumption Statistics
3.12. Import and Export Statistics
4. Global Market Analysis 2018 to 2022 and Forecast, 2023 to 2033
4.1. Historical Market Size Value (US$ million) & Volume (Units) Analysis, 2018 to 2022
4.2. Current and Future Market Size Value (US$ million) & Volume (Units) Projections, 2023 to 2033
4.2.1. Y-o-Y Growth Trend Analysis
4.2.2. Absolute $ Opportunity Analysis
5. Global Market Analysis 2018 to 2022 and Forecast 2023 to 2033, By Type
5.1. Introduction / Key Findings
5.2. Historical Market Size Value (US$ million) & Volume (Units) Analysis By Type, 2018 to 2022
5.3. Current and Future Market Size Value (US$ million) & Volume (Units) Analysis and Forecast By Type, 2023 to 2033
5.3.1. Autonomous (AICD)
5.3.2. Passive (PICD)
5.3.3. Active (AICD)
5.4. Y-o-Y Growth Trend Analysis By Type, 2018 to 2022
5.5. Absolute $ Opportunity Analysis By Type, 2023 to 2033
6. Global Market Analysis 2018 to 2022 and Forecast 2023 to 2033, By Application
6.1. Introduction / Key Findings
6.2. Historical Market Size Value (US$ million) & Volume (Units) Analysis By Application, 2018 to 2022
6.3. Current and Future Market Size Value (US$ million) & Volume (Units) Analysis and Forecast By Application, 2023 to 2033
6.3.1. Onshore
6.3.2. Offshore
6.4. Y-o-Y Growth Trend Analysis By Application, 2018 to 2022
6.5. Absolute $ Opportunity Analysis By Application, 2023 to 2033
7. Global Market Analysis 2018 to 2022 and Forecast 2023 to 2033, By Region
7.1. Introduction
7.2. Historical Market Size Value (US$ million) & Volume (Units) Analysis By Region, 2018 to 2022
7.3. Current Market Size Value (US$ million) & Volume (Units) Analysis and Forecast By Region, 2023 to 2033
7.3.1. North America
7.3.2. Latin America
7.3.3. Western Europe
7.3.4. Eastern Europe
7.3.5. South Asia and Pacific
7.3.6. East Asia
7.3.7. Middle East and Africa
7.4. Market Attractiveness Analysis By Region
8. North America Market Analysis 2018 to 2022 and Forecast 2023 to 2033, By Country
8.1. Historical Market Size Value (US$ million) & Volume (Units) Trend Analysis By Market Taxonomy, 2018 to 2022
8.2. Market Size Value (US$ million) & Volume (Units) Forecast By Market Taxonomy, 2023 to 2033
8.2.1. By Country
8.2.1.1. United States
8.2.1.2. Canada
8.2.2. By Type
8.2.3. By Application
8.3. Market Attractiveness Analysis
8.3.1. By Country
8.3.2. By Type
8.3.3. By Application
8.4. Key Takeaways
9. Latin America Market Analysis 2018 to 2022 and Forecast 2023 to 2033, By Country
9.1. Historical Market Size Value (US$ million) & Volume (Units) Trend Analysis By Market Taxonomy, 2018 to 2022
9.2. Market Size Value (US$ million) & Volume (Units) Forecast By Market Taxonomy, 2023 to 2033
9.2.1. By Country
9.2.1.1. Brazil
9.2.1.2. Mexico
9.2.1.3. Rest of Latin America
9.2.2. By Type
9.2.3. By Application
9.3. Market Attractiveness Analysis
9.3.1. By Country
9.3.2. By Type
9.3.3. By Application
9.4. Key Takeaways
10. Western Europe Market Analysis 2018 to 2022 and Forecast 2023 to 2033, By Country
10.1. Historical Market Size Value (US$ million) & Volume (Units) Trend Analysis By Market Taxonomy, 2018 to 2022
10.2. Market Size Value (US$ million) & Volume (Units) Forecast By Market Taxonomy, 2023 to 2033
10.2.1. By Country
10.2.1.1. Germany
10.2.1.2. United Kingdom
10.2.1.3. France
10.2.1.4. Spain
10.2.1.5. Italy
10.2.1.6. Rest of Western Europe
10.2.2. By Type
10.2.3. By Application
10.3. Market Attractiveness Analysis
10.3.1. By Country
10.3.2. By Type
10.3.3. By Application
10.4. Key Takeaways
11. Eastern Europe Market Analysis 2018 to 2022 and Forecast 2023 to 2033, By Country
11.1. Historical Market Size Value (US$ million) & Volume (Units) Trend Analysis By Market Taxonomy, 2018 to 2022
11.2. Market Size Value (US$ million) & Volume (Units) Forecast By Market Taxonomy, 2023 to 2033
11.2.1. By Country
11.2.1.1. Poland
11.2.1.2. Russia
11.2.1.3. Czech Republic
11.2.1.4. Romania
11.2.1.5. Rest of Eastern Europe
11.2.2. By Type
11.2.3. By Application
11.3. Market Attractiveness Analysis
11.3.1. By Country
11.3.2. By Type
11.3.3. By Application
11.4. Key Takeaways
12. South Asia and Pacific Market Analysis 2018 to 2022 and Forecast 2023 to 2033, By Country
12.1. Historical Market Size Value (US$ million) & Volume (Units) Trend Analysis By Market Taxonomy, 2018 to 2022
12.2. Market Size Value (US$ million) & Volume (Units) Forecast By Market Taxonomy, 2023 to 2033
12.2.1. By Country
12.2.1.1. India
12.2.1.2. Bangladesh
12.2.1.3. Australia
12.2.1.4. New Zealand
12.2.1.5. Rest of South Asia and Pacific
12.2.2. By Type
12.2.3. By Application
12.3. Market Attractiveness Analysis
12.3.1. By Country
12.3.2. By Type
12.3.3. By Application
12.4. Key Takeaways
13. East Asia Market Analysis 2018 to 2022 and Forecast 2023 to 2033, By Country
13.1. Historical Market Size Value (US$ million) & Volume (Units) Trend Analysis By Market Taxonomy, 2018 to 2022
13.2. Market Size Value (US$ million) & Volume (Units) Forecast By Market Taxonomy, 2023 to 2033
13.2.1. By Country
13.2.1.1. China
13.2.1.2. Japan
13.2.1.3. South Korea
13.2.2. By Type
13.2.3. By Application
13.3. Market Attractiveness Analysis
13.3.1. By Country
13.3.2. By Type
13.3.3. By Application
13.4. Key Takeaways
14. Middle East and Africa Market Analysis 2018 to 2022 and Forecast 2023 to 2033, By Country
14.1. Historical Market Size Value (US$ million) & Volume (Units) Trend Analysis By Market Taxonomy, 2018 to 2022
14.2. Market Size Value (US$ million) & Volume (Units) Forecast By Market Taxonomy, 2023 to 2033
14.2.1. By Country
14.2.1.1. GCC Countries
14.2.1.2. South Africa
14.2.1.3. Israel
14.2.1.4. Rest of Middle East & Africa
14.2.2. By Type
14.2.3. By Application
14.3. Market Attractiveness Analysis
14.3.1. By Country
14.3.2. By Type
14.3.3. By Application
14.4. Key Takeaways
15. Key Countries Market Analysis
15.1. United States
15.1.1. Pricing Analysis
15.1.2. Market Share Analysis, 2022
15.1.2.1. By Type
15.1.2.2. By Application
15.2. Canada
15.2.1. Pricing Analysis
15.2.2. Market Share Analysis, 2022
15.2.2.1. By Type
15.2.2.2. By Application
15.3. Brazil
15.3.1. Pricing Analysis
15.3.2. Market Share Analysis, 2022
15.3.2.1. By Type
15.3.2.2. By Application
15.4. Mexico
15.4.1. Pricing Analysis
15.4.2. Market Share Analysis, 2022
15.4.2.1. By Type
15.4.2.2. By Application
15.5. Germany
15.5.1. Pricing Analysis
15.5.2. Market Share Analysis, 2022
15.5.2.1. By Type
15.5.2.2. By Application
15.6. United Kingdom
15.6.1. Pricing Analysis
15.6.2. Market Share Analysis, 2022
15.6.2.1. By Type
15.6.2.2. By Application
15.7. France
15.7.1. Pricing Analysis
15.7.2. Market Share Analysis, 2022
15.7.2.1. By Type
15.7.2.2. By Application
15.8. Spain
15.8.1. Pricing Analysis
15.8.2. Market Share Analysis, 2022
15.8.2.1. By Type
15.8.2.2. By Application
15.9. Italy
15.9.1. Pricing Analysis
15.9.2. Market Share Analysis, 2022
15.9.2.1. By Type
15.9.2.2. By Application
15.10. Poland
15.10.1. Pricing Analysis
15.10.2. Market Share Analysis, 2022
15.10.2.1. By Type
15.10.2.2. By Application
15.11. Russia
15.11.1. Pricing Analysis
15.11.2. Market Share Analysis, 2022
15.11.2.1. By Type
15.11.2.2. By Application
15.12. Czech Republic
15.12.1. Pricing Analysis
15.12.2. Market Share Analysis, 2022
15.12.2.1. By Type
15.12.2.2. By Application
15.13. Romania
15.13.1. Pricing Analysis
15.13.2. Market Share Analysis, 2022
15.13.2.1. By Type
15.13.2.2. By Application
15.14. India
15.14.1. Pricing Analysis
15.14.2. Market Share Analysis, 2022
15.14.2.1. By Type
15.14.2.2. By Application
15.15. Bangladesh
15.15.1. Pricing Analysis
15.15.2. Market Share Analysis, 2022
15.15.2.1. By Type
15.15.2.2. By Application
15.16. Australia
15.16.1. Pricing Analysis
15.16.2. Market Share Analysis, 2022
15.16.2.1. By Type
15.16.2.2. By Application
15.17. New Zealand
15.17.1. Pricing Analysis
15.17.2. Market Share Analysis, 2022
15.17.2.1. By Type
15.17.2.2. By Application
15.18. China
15.18.1. Pricing Analysis
15.18.2. Market Share Analysis, 2022
15.18.2.1. By Type
15.18.2.2. By Application
15.19. Japan
15.19.1. Pricing Analysis
15.19.2. Market Share Analysis, 2022
15.19.2.1. By Type
15.19.2.2. By Application
15.20. South Korea
15.20.1. Pricing Analysis
15.20.2. Market Share Analysis, 2022
15.20.2.1. By Type
15.20.2.2. By Application
15.21. GCC Countries
15.21.1. Pricing Analysis
15.21.2. Market Share Analysis, 2022
15.21.2.1. By Type
15.21.2.2. By Application
15.22. South Africa
15.22.1. Pricing Analysis
15.22.2. Market Share Analysis, 2022
15.22.2.1. By Type
15.22.2.2. By Application
15.23. Israel
15.23.1. Pricing Analysis
15.23.2. Market Share Analysis, 2022
15.23.2.1. By Type
15.23.2.2. By Application
16. Market Structure Analysis
16.1. Competition Dashboard
16.2. Competition Benchmarking
16.3. Market Share Analysis of Top Players
16.3.1. By Regional
16.3.2. By Type
16.3.3. By Application
17. Competition Analysis
17.1. Competition Deep Dive
17.1.1. Anton Oilfield Services
17.1.1.1. Overview
17.1.1.2. Product Portfolio
17.1.1.3. Profitability by Market Segments
17.1.1.4. Sales Footprint
17.1.1.5. Strategy Overview
17.1.1.5.1. Marketing Strategy
17.1.1.5.2. Product Strategy
17.1.1.5.3. Channel Strategy
17.1.2. Baker Hughes Company
17.1.2.1. Overview
17.1.2.2. Product Portfolio
17.1.2.3. Profitability by Market Segments
17.1.2.4. Sales Footprint
17.1.2.5. Strategy Overview
17.1.2.5.1. Marketing Strategy
17.1.2.5.2. Product Strategy
17.1.2.5.3. Channel Strategy
17.1.3. China Oilfield Services
17.1.3.1. Overview
17.1.3.2. Product Portfolio
17.1.3.3. Profitability by Market Segments
17.1.3.4. Sales Footprint
17.1.3.5. Strategy Overview
17.1.3.5.1. Marketing Strategy
17.1.3.5.2. Product Strategy
17.1.3.5.3. Channel Strategy
17.1.4. Halliburton
17.1.4.1. Overview
17.1.4.2. Product Portfolio
17.1.4.3. Profitability by Market Segments
17.1.4.4. Sales Footprint
17.1.4.5. Strategy Overview
17.1.4.5.1. Marketing Strategy
17.1.4.5.2. Product Strategy
17.1.4.5.3. Channel Strategy
17.1.5. KATT GmbH
17.1.5.1. Overview
17.1.5.2. Product Portfolio
17.1.5.3. Profitability by Market Segments
17.1.5.4. Sales Footprint
17.1.5.5. Strategy Overview
17.1.5.5.1. Marketing Strategy
17.1.5.5.2. Product Strategy
17.1.5.5.3. Channel Strategy
17.1.6. MiddleEast Oilfield Services
17.1.6.1. Overview
17.1.6.2. Product Portfolio
17.1.6.3. Profitability by Market Segments
17.1.6.4. Sales Footprint
17.1.6.5. Strategy Overview
17.1.6.5.1. Marketing Strategy
17.1.6.5.2. Product Strategy
17.1.6.5.3. Channel Strategy
17.1.7. Mitchell Industries
17.1.7.1. Overview
17.1.7.2. Product Portfolio
17.1.7.3. Profitability by Market Segments
17.1.7.4. Sales Footprint
17.1.7.5. Strategy Overview
17.1.7.5.1. Marketing Strategy
17.1.7.5.2. Product Strategy
17.1.7.5.3. Channel Strategy
17.1.8. Oil States International
17.1.8.1. Overview
17.1.8.2. Product Portfolio
17.1.8.3. Profitability by Market Segments
17.1.8.4. Sales Footprint
17.1.8.5. Strategy Overview
17.1.8.5.1. Marketing Strategy
17.1.8.5.2. Product Strategy
17.1.8.5.3. Channel Strategy
17.1.9. RGL Reservoir Management
17.1.9.1. Overview
17.1.9.2. Product Portfolio
17.1.9.3. Profitability by Market Segments
17.1.9.4. Sales Footprint
17.1.9.5. Strategy Overview
17.1.9.5.1. Marketing Strategy
17.1.9.5.2. Product Strategy
17.1.9.5.3. Channel Strategy
17.1.10. Schlumberger
17.1.10.1. Overview
17.1.10.2. Product Portfolio
17.1.10.3. Profitability by Market Segments
17.1.10.4. Sales Footprint
17.1.10.5. Strategy Overview
17.1.10.5.1. Marketing Strategy
17.1.10.5.2. Product Strategy
17.1.10.5.3. Channel Strategy
18. Assumptions & Acronyms Used
19. Research Methodology
Explore Industrial Automation Insights
View Reports