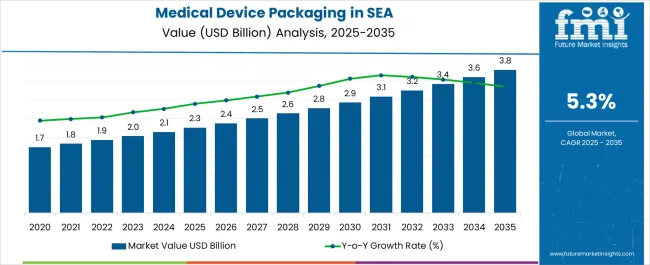
The Industry Analysis of Medical Device Packaging in Southeast Asia is estimated to be valued at USD 2.3 billion in 2025 and is projected to reach USD 3.8 billion by 2035, registering a compound annual growth rate (CAGR) of 5.3% over the forecast period.
| Metric | Value |
|---|---|
| Industry Analysis of Medical Device Packaging in Southeast Asia Estimated Value in (2025 E) | USD 2.3 billion |
| Industry Analysis of Medical Device Packaging in Southeast Asia Forecast Value in (2035 F) | USD 3.8 billion |
| Forecast CAGR (2025 to 2035) | 5.3% |
The medical device packaging market in Southeast Asia is witnessing robust growth. Rising demand for healthcare services, increasing medical device manufacturing, and stringent regulatory requirements for product safety and sterility are driving market expansion. Current dynamics are shaped by the adoption of advanced packaging technologies, growing awareness of infection control, and investment in healthcare infrastructure across emerging economies.
Market players are focusing on material innovation, process optimization, and compliance with international standards to enhance product reliability and shelf life. The future outlook is characterized by increasing demand for single-use devices, expansion of hospital and outpatient facilities, and adoption of eco-friendly and cost-efficient packaging solutions.
Growth rationale is anchored on the need for secure, durable, and compliant packaging that ensures device integrity Ongoing material advancements, flexible packaging formats, and strategic collaborations between manufacturers and healthcare providers are expected to sustain market development and broaden accessibility across Southeast Asian markets.
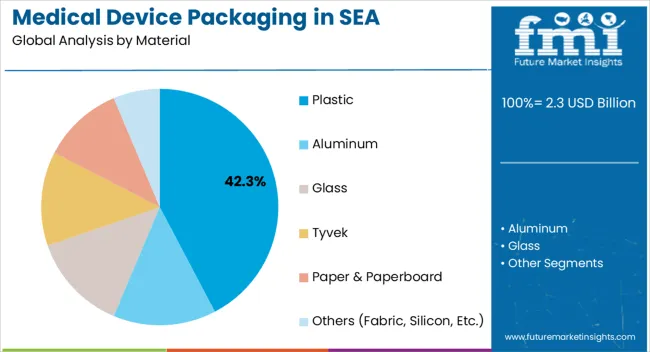
The plastic segment, accounting for 42.30% of the material category, has been leading due to its versatility, durability, and compatibility with sterilization processes. Its widespread adoption has been supported by cost-effectiveness, lightweight properties, and ease of molding into complex designs, which are essential for maintaining device integrity.
Regulatory compliance and consistent quality standards have reinforced market confidence, while innovations in recyclable and medical-grade plastics are addressing sustainability concerns. Supply chain reliability and availability of high-quality raw materials have enabled manufacturers to scale production efficiently.
Technological advancements in barrier properties and chemical resistance have enhanced product safety and performance The plastic segment’s leading position is expected to be maintained as manufacturers continue to invest in material enhancements and production efficiencies, supporting its dominant share within the Southeast Asian medical device packaging market.
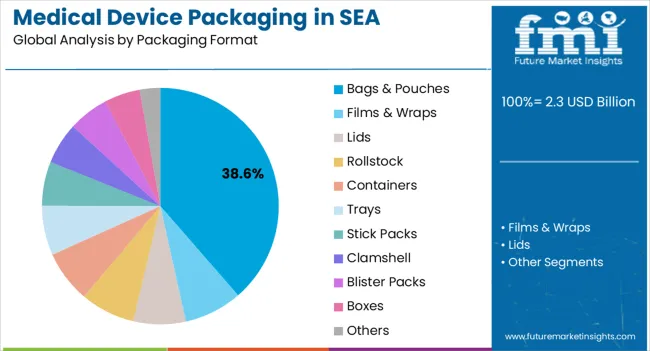
The bags and pouches segment, representing 38.60% of the packaging format category, has maintained prominence due to its adaptability for a wide range of medical devices and disposables. Its leading share has been reinforced by operational convenience, sterilization compatibility, and protective barrier properties that preserve product sterility.
Demand has been driven by both hospital and outpatient settings where flexible, space-efficient packaging is preferred. Production advancements, including heat-sealing technologies and multi-layer barrier films, have enhanced durability and shelf life.
Manufacturers’ focus on design innovation and compliance with regional standards has further strengthened adoption The segment’s growth trajectory is expected to continue as healthcare providers increasingly prioritize user-friendly, safe, and efficient packaging solutions for critical medical devices.
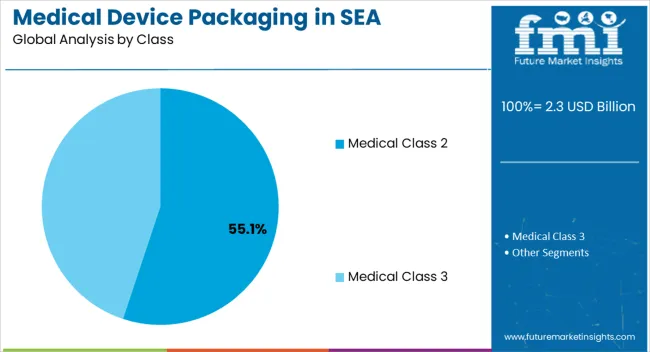
The Medical Class 2 segment, holding 55.10% of the class category, has emerged as the leading classification owing to the high prevalence of mid-risk medical devices requiring moderate regulatory control. Adoption has been driven by regulatory mandates ensuring safety, performance, and sterility for devices that pose moderate risk to patients.
Manufacturing practices, quality assurance protocols, and labeling compliance have contributed to market confidence. Distribution through hospitals, clinics, and specialized healthcare providers has supported widespread availability.
Advances in sterilization-compatible packaging and monitoring systems have further enhanced product reliability Continued emphasis on regulatory compliance, growing device usage, and increasing awareness among healthcare professionals are expected to sustain the segment’s dominance and drive incremental growth within the Southeast Asian medical device packaging market.
The medical device packaging ecosystem in Southeast Asia witnessed a CAGR of 4.6% during the historical period, reaching a value of USD 1,911 million in 2025 from USD 1,594.2 million in 2020. The demand for critical services has steadily grown with coordinated investment in infrastructure, medical services, and professional medical training.
This makes for a significant opportunity for life science companies to support aging populations in both developed and emerging economies.
The scale and complexity of these challenges suggest that opportunities for enhancement in healthcare systems from both the public and private sectors will likely emerge. To combat the issue of common but treatable health issues, governments play a critical role in increasing the knowledge of and accessibility to health treatments and tools.
In 2020, the Delhi Declaration on Improving Access to Essential Medical Products and the Region's Flagship priority program agreed on achieving universal health coverage. The WHO Southeast Asia chapter is committed to ensuring universal access to safe, effective, affordable, and high-quality medical products for all.
Efforts to minimize risks and dependency and enhance domestic output are ongoing to construct resilient supply chains. Southeast Asia region member countries were actively involved in global consultations that resulted in the passage of crucial World Health Assembly resolutions concerning this topic.
Southeast Asian countries, particularly Thailand and Singapore, have become prime destinations for medical tourism owing to affordable treatments and the availability of complete healthcare under one roof. More patients from developed and emerging economies have traveled to these countries for medical treatments, combining a holiday with an executive check-up or surgery.
Hospitals in these countries have advanced significantly in several medical specialties, including robotic endoscopic coronary bypass surgery, minimally invasive surgery, and heart surgery. This is because of improvements in regional invasive and non-invasive medical technologies, which are predicted to rise in this space.
The development of medical devices in the region is still in its infancy despite the frequent steps governments in Southeast Asia economies have taken to foster local innovation. For instance, the government of Thailand is attempting to boost research and development activity in the medical device sector as part of the new Thailand 4.0 development model by establishing an Intellectual Property Innovation-Driven Entrepreneurship Center (IPI-DE).
The center keeps a database of data and patent details available to small and medium-sized businesses (SMEs) working on any new technology. As a result, the Thai government aims to encourage Thai medical device firms to innovate and expand across domestic and foreign economies.
| Attributes | Key Factors |
|---|---|
| Latest Trends |
|
| Growth Hindrances |
|
| Upcoming Opportunities |
|
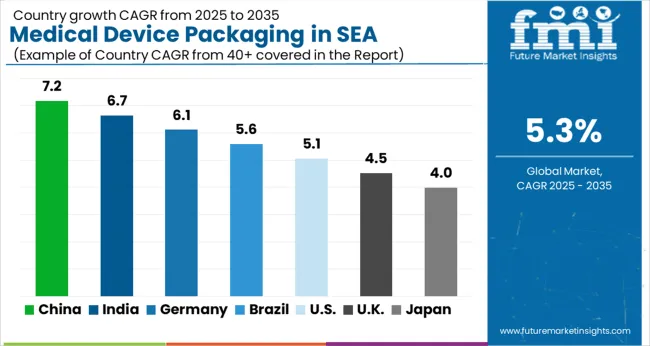
The table below explains the sales of medical device packaging in Southeast Asia by value and CAGRs of the top 5 countries for 2035. Among them, Malaysia is anticipated to remain at the forefront by registering USD 3.8 million. Thailand is expected to secure USD 429.2 million by 2035, less than Indonesia's USD 507.9 million.
| Countries | Market Value (2035) |
|---|---|
| Indonesia | USD 507.9 million |
| Malaysia | USD 3.8 million |
| Philippines | USD 413.5 million |
| Singapore | USD 318 million |
| Thailand | USD 429.2 million |
| Vietnam | USD 424.9 million |
The table below shows the CAGRs of the top 5 countries for the review period 2025 to 2035. Vietnam and Thailand are expected to remain dominant by exhibiting a CAGR of 8.0% and 6.6%, respectively. Singapore and the Philippines are likely to follow with CAGRs of 6.3% and 5.6%, respectively.
| Countries | Value CAGR |
|---|---|
| Indonesia | 3.7% |
| Malaysia | 4.5% |
| Philippines | 5.6% |
| Singapore | 6.3% |
| Thailand | 6.6% |
| Vietnam | 8.0% |
Medical device packaging industry in Singapore is estimated to grow at a CAGR of 6.3% during the forecast period. Singapore is expected to lead the Southeast Asia medical device packaging sales over the forecast period, generating revenue of USD 318 million by 2035.
According to the Economic Development Board of Singapore, Singapore's aging population and increasing demand for quality healthcare services, vital research and development capabilities, and innovation ecosystem fuel demand in Singapore. As the demand for critical services increases with coordinated investment in infrastructure, medical services, and professional medical training, life science companies have a significant opportunity. There is also a considerable scope to support the emerging industries.
The scale and complexity of these challenges suggest that there may be opportunities for enhancement in healthcare systems from both the public and private sectors. To combat the issue of common but treatable health issues, governments play a critical role in increasing the knowledge of and accessibility to health treatments and tools.
Medical device packaging industry in Indonesia is estimated to grow at a CAGR of 3.7% during the forecast period. Indonesia medical device packaging sales are projected to create a financial potential worth USD 166.8 million by 2035.
According to the International Trade Association, increased public awareness of the importance of healthcare, the expansion of public and private hospitals, and the establishment of Indonesia's public health insurance system in 2014 have all resulted in a greater demand for more complex and advanced medical technology. Healthcare is a national priority in Indonesia, and the central and provincial governments continue to create and modernize healthcare facilities.
Indonesia now has 2,925 hospitals, with around 63% privately run. Increasing per capita spending on healthcare services, followed by rising healthcare infrastructure in Indonesia and increasing medical tourism, will likely positively impact medical device packaging.
Malaysia is expected to surge at a CAGR of 4.5% by 2035. The country is distinguished by several reputable equipment manufacturing companies functioning locally and globally. Malaysia is a leading exporter of medical equipment worldwide and is in the lead of medical technology innovation and development. Due to these aspects, the demand for medical packaging in the country is projected to increase.
Malaysia holds the leading share due to its strength in the healthcare industry and many units operating in the healthcare sector. It has a competitive benefit in equipment, software development, technology, and high investment in research and development, leading to increased medical device production volumes. Due to Malaysia’s economic growth, a lot of investments are pouring into the healthcare sector.
The table below signifies leading sub-categories under packaging format and application type categories in the medical device packaging in Southeast Asia segment. Bags and pouches are expected to dominate by exhibiting a 4.7% CAGR in the evaluation period. Under the application type segment, the disposable medical supplies category is projected to lead at a 5.8% CAGR.
| Category | Forecast CAGR (2025 to 2035) |
|---|---|
| Bags and Pouches (Packaging Format) | 4.7% |
| Disposable Medical Supplies (Application Type) | 5.8% |
In terms of packaging, the bags and pouches segment is predicted to lead medical device packaging industry in Southeast Asia in the forecast period, offering a definite financial opportunity of USD 3.8 million by 2035. Bags and pouches in medical device packaging provide a barrier against contamination, ensuring that the medical device remains sterile until it is ready to be used.
Medical sector players prefer these bags and pouches since they are made of a sterile, durable, and flexible material, which is highly important in this sector. They are renowned to be able to withstand rigorous sterilization processes and package small, medium, and large medical devices efficiently.
The high product-to-package and small size ratio allow for easy handling and storage of medical devices, another factor driving their high sales. Manufacturers in this domain are focusing on creating bags and pouches from suitable materials, such as PET and LLDPE, to better enable protection from light, moisture, and gases.
The disposable medical supplies segment under application is estimated to generate high demand for medical device packaging solutions in Southeast Asia. The same segment is anticipated to create a potential financial opening worth USD 1,167 million by 2035.
The increasing need for disposable medical products is significantly driving sales expansion. Instead of reusable devices, end customers choose disposable medical equipment such as disposable anesthesia face masks. Disposable medical supplies help to keep diseases away.
Medical disposable materials are less likely to spread infections than reusable medical equipment. When compared to reusable equipment, disposable gadgets are more cost-effective and efficient.
Due to the growing emphasis on maintaining hygiene and protecting the health of hospital staff and patients, the use of reusable medical equipment, such as masks and gloves, in medical centers has expanded.
The increased focus of hospitals on accomplishing legal requirements is driving the demand for reusable medical equipment such as disposable needles, syringes, masks, drapes, and gowns. As a result, the industry for disposable medical supplies is rising.
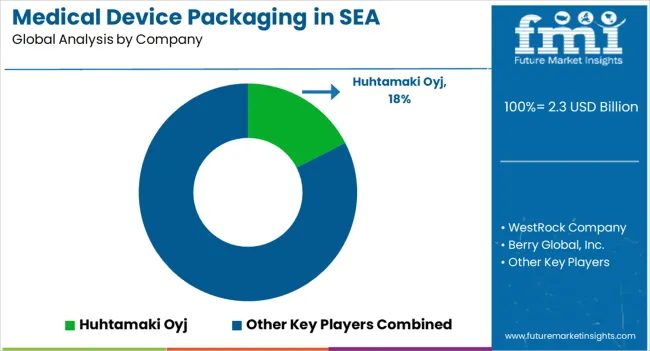
Manufacturers in the medical device packaging domain prioritize expanding their production capabilities in response to the rising demand in Southeast Asia. Furthermore, these key players are diversifying their product offerings to address the expanding segment for medical device packaging in Southeast Asia.
Key companies acquire other corporations to expand their product portfolio and surge their production capacity. The occurrence of globally renowned public companies is likely to lead to an increase in mergers and acquisitions cases as private and smaller companies cannot compete with companies in international markets regarding revenue generation.
For instance,
| Attribute | Details |
|---|---|
| Estimated Southeast Asia Medical Device Packaging Size (2025) | USD 2.3 billion |
| Projected Southeast Asia Medical Device Packaging Valuation (2035) | USD 3.8 billion |
| Value-based CAGR (2025 to 2035) | 5.3% |
| Historical Data | 2020 to 2025 |
| Forecast Period | 2025 to 2035 |
| Quantitative Units | Revenue in USD Million, Volume in Tonnes, and CAGR from 2025 to 2035 |
| Report Coverage | Revenue Forecast, Volume Forecast, Company Ranking, Competitive Landscape, Growth Factors, Trends and Pricing Analysis |
| Segments Covered | Material, Packaging Format, Class, Application, Region |
| Key Countries Covered | Indonesia, Malaysia, Philippines, Singapore, Thailand, Vietnam, Myanmar, Cambodia, Brunei, Timor-Leste, Laos |
| Key Companies Profiled | Huhtamaki Oyj; WestRock Company; Berry Global, Inc.; Tekni-Plex, Inc.; DuPont Inc; Graphic Packaging International, Inc.; Amcor Plc; Sonoco Products Company; Amcor plc; Berry Southeast Asia, Inc.; Huhtamaki Oyj; PAXXUS PTE LTD; Graphic Packaging International, Inc.; DuPont Inc; Steripack Group; ZACROS Group; Tekni-Plex, Inc.; Stora Enso Oyj; WestRock Company; Constantia Flexibles Group GmbH |
The global industry analysis of medical device packaging in Southeast Asia is estimated to be valued at USD 2.3 billion in 2025.
The market size for the industry analysis of medical device packaging in Southeast Asia is projected to reach USD 3.8 billion by 2035.
The industry analysis of medical device packaging in Southeast Asia is expected to grow at a 5.3% CAGR between 2025 and 2035.
The key product types in industry analysis of medical device packaging in Southeast Asia are plastic, _pe, _pp, _pet, _pvc, _bioplastics, _others (pa, evoh), aluminum, glass, tyvek, paper & paperboard, _coated, _uncoated and others (fabric, silicon, etc.).
In terms of packaging format, bags & pouches segment to command 38.6% share in the industry analysis of medical device packaging in Southeast Asia in 2025.


Full Research Suite comprises of:
Market outlook & trends analysis
Interviews & case studies
Strategic recommendations
Vendor profiles & capabilities analysis
5-year forecasts
8 regions and 60+ country-level data splits
Market segment data splits
12 months of continuous data updates
DELIVERED AS:
PDF EXCEL ONLINE
Industry 4.0 Market
Industry Analysis Non-commercial Acrylic Paint in the United States Size and Share Forecast Outlook 2025 to 2035
Industry Analysis of Outbound Tourism in Germany Size and Share Forecast Outlook 2025 to 2035
Industry Analysis of Syringe and Needle in GCC Size and Share Forecast Outlook 2025 to 2035
Industry Analysis of Paper Bag in North America Size and Share Forecast Outlook 2025 to 2035
Industry Analysis of Lidding Film in the United States Size and Share Forecast Outlook 2025 to 2035
Industry Analysis of Last-mile Delivery Software in Japan Size and Share Forecast Outlook 2025 to 2035
Industry Analysis of Automotive Lightweight Body Panel in the United States Size and Share Forecast Outlook 2025 to 2035
Industry Analysis of Electronic Skin in Japan Size and Share Forecast Outlook 2025 to 2035
Industry Analysis of Electronic Skin in Korea Size and Share Forecast Outlook 2025 to 2035
Industry Analysis of Electronic Skin in Western Europe Size and Share Forecast Outlook 2025 to 2035
Europe Second-hand Apparel Market Growth – Trends & Forecast 2024-2034
DOAS Industry Analysis in the United States Forecast and Outlook 2025 to 2035
FIBC Industry Analysis in Japan Size and Share Forecast Outlook 2025 to 2035
Pectin Industry Analysis in Japan Size and Share Forecast Outlook 2025 to 2035
Western Europe Pectin Market Analysis by Product Type, Application, and Country Through 2035
Mezcal Industry Analysis in Japan - Consumer Demand & Industry Trends in 2025
Mezcal Industry Analysis in Korea – Trends, Demand & Industry Growth
Mezcal Industry Analysis in Western Europe Report – Growth, Demand & Forecast 2025 to 2035
Asia Pacific Dental Market Analysis – Growth, Trends & Forecast 2024-2034

Thank you!
You will receive an email from our Business Development Manager. Please be sure to check your SPAM/JUNK folder too.
Chat With
MaRIA