Industrial and Institutional Cleaning Chemical Market Forecast and Outlook 2025 to 2035

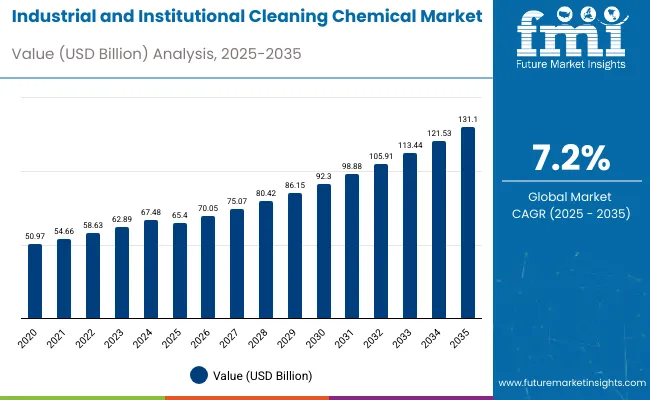
The industrial and institutional cleaning chemical market is projected to expand steadily from USD 65.4 billion in 2025 to USD 131.1 billion by 2035, advancing at a CAGR of 7.2%. This growth is driven by increasing hygiene awareness, stricter regulations, and expanding applications across healthcare, food processing, and industrial sectors.

Quick Stats for Industrial and Institutional Cleaning Chemical Market

  • Industrial and Institutional Cleaning Chemical Market Value (2025): USD 65.4 billion
  • Industrial and Institutional Cleaning Chemical Market Forecast Value (2035): USD 131.1 billion
  • Industrial and Institutional Cleaning Chemical Market Forecast CAGR: 7.2%
  • Leading Raw Material Segment in Industrial and Institutional Cleaning Chemical Market in 2025: Surfactants (34%)
  • Key Growth Regions in Industrial and Institutional Cleaning Chemical Market: Asia Pacific and Western Europe
  • Key Players in Industrial and Institutional Cleaning Chemical Market: Procter & Gamble, BASF SE, Henkel AG & Co. KGaA, Reckitt Benckiser Group plc, Croda International

Industrial And Institutional Cleaning Chemical Market

Metric Value
Market Value (2025) USD 65.4 billion
Market Forecast Value (2035) USD 131.1 billion
CAGR (2025 to 2035) 7.2%

Key segments such as surfactants and general-purpose cleaners dominate the market, while leading companies like Reckitt Benckiser Group plc and Procter & Gamble bolster their positions through innovation and capacity expansion.

By 2030, the market is forecasted to reach around USD 92.7 billion, showing a steady climb across the first half of the period. The absolute dollar growth between 2025 and 2035 is expected to be about USD 65.7 billion, indicating measured but reliable expansion. Growth is considered somewhat back-loaded as increased demand for eco-friendly and technologically advanced cleaning solutions in healthcare, food processing, and commercial sectors is anticipated to drive stronger market penetration in the latter half of the timeline.

Key companies such as Procter & Gamble, Reckitt Benckiser Group plc, BASF SE, Henkel AG & Co. KGaA, and Croda International are consolidating their positions by scaling production capacities and investing in innovative cleaning technologies. Their development pipelines emphasize eco-friendly formulations, advanced disinfectants, and multifunctional cleaning solutions aimed at industrial, healthcare, and foodservice sectors. Market performance is closely linked to regulatory compliance, environmental standards, and quality assurance, which will continue to influence competitive dynamics across global regions.

The market holds a significant share across various sectors, with commercial applications dominate with over 68% market share in 2024. Industrial and manufacturing uses account for the remaining share, but their demand is also rising due to stricter hygiene regulations. The market is expanding through innovations in eco-friendly cleaning products, advanced disinfectants, and automated cleaning technologies, impacting hygiene standards globally and reinforcing the positions of key players like Procter & Gamble, Reckitt Benckiser Group plc, and BASF SE.

The market is transforming with advancements in eco-friendly formulations and technological innovations that enhance cleaning efficacy and safety. Producers are expanding their product portfolios to include biodegradable, plant-based, and multifunctional cleaning agents, supported by growing demand from healthcare, food processing, and commercial sectors.

Why is Industrial and Institutional Cleaning Chemical Market Growing?

The industrial and institutional cleaning chemical market is growing due to increased awareness of hygiene and stringent health and safety regulations globally. The COVID-19 pandemic has heightened demand for effective cleaning and disinfectant products across healthcare, food processing, hospitality, and manufacturing sectors. Furthermore, advances in eco-friendly and biodegradable formulations, coupled with technological innovations like automated cleaning systems, are making cleaning processes safer and more efficient.

Strong regulatory frameworks and rising demand for sustainable cleaning solutions are driving manufacturers to innovate and expand product portfolios. The market growth is also supported by expanding applications in emerging economies, where urbanization and industrialization increase the need for cleanliness and sanitation. Leading companies are investing in research and development to offer multifunctional cleaning agents that meet evolving consumer and institutional standards. Additionally, collaborations with end-users and focus on product quality and environmental compliance are reshaping industry dynamics, promising robust market expansion from 2025 to 2035.

Industrial and Institutional Cleaning Chemical Market by Top Investment Segments

The market is segmented by raw material, product type, end use verticals, and region. By raw material, the market is divided into chlor-alkali (caustic soda, soda ash, and chlorine), surfactant (non-ionic, anionic, cationic, and amphoteric), solvents (alcohols, hydrocarbons, chlorinated, ethers, and others such as chelants, rheology modifiers, opacifiers, dispersants, ketones, esters), phosphates, biocides, and others. Based on product type, the market is categorized into general purpose cleaners, disinfectants and sanitizers, laundry care products, vehicle wash products, and others (specialty cleaners and warewashing products).

In terms of end use verticals, the market is bifurcated into commercial (food services, retail, healthcare, laundry care, institutional buildings, and others such as education, hospitality); manufacturing (food & beverage processing, metal manufacturing & fabrication, electronic components, and others such as automotive, chemical industries. Regionally, the market is classified into North America, Latin America, Western Europe, Eastern Europe, East Asia, South Asia and Pacific, and Middle East & Africa.
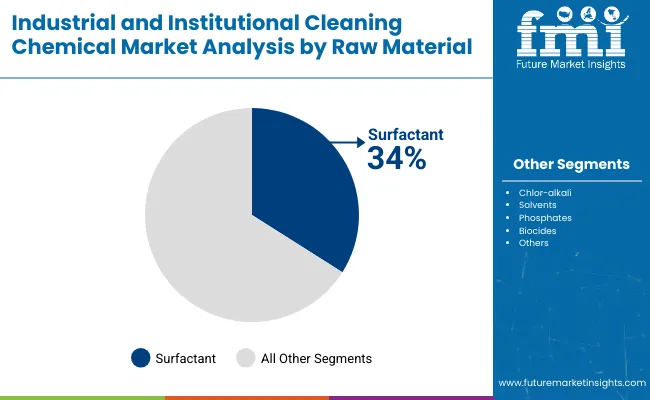
By Raw Material, Surfactant Accounts for 34% of the Market Share

Industrial And Institutional Cleaning Chemical Market By Raw Material

The leading share of segments in the market in 2025 is dominated by surfactants, capturing 34% of the market.Surfactants, which include non-ionic, anionic, cationic, and amphoteric types, function by reducing surface tension, enabling effective removal of dirt, oils, and contaminants. Anionic surfactants, widely used in detergents and cleaning products, are prized for their strong foaming and cleansing properties. Non-ionic surfactants excel in oil emulsification without leaving residues, making them crucial in fabric care and hard surface cleaners.

The growth in this segment is driven by rising demand for eco-friendly, bio-based surfactants and innovations targeting reduced environmental impact. Additionally, surfactants are essential in industrial cleaning due to their efficacy in low-foam formulations, critical for automated cleaning systems in food, pharmaceutical, and manufacturing sectors. The increasing urbanization, hygiene awareness, and regulatory push towards sustainability further propel the surfactants segment, with Asia Pacific as a dominant regional market.
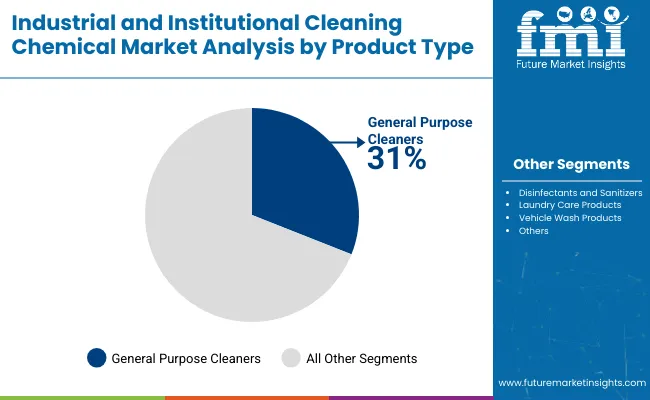
By Product Type, General Purpose Cleaners Accounts for 31% of the Market Share

Industrial And Institutional Cleaning Chemical Market By Product Type

General purpose cleaners hold the largest market share in the market in 2025, accounting for 31% of the total share. These cleaners are widely used because of their versatility and effectiveness in cleaning a broad spectrum of surfaces in various environments, including commercial buildings, healthcare facilities, educational institutions, and food processing units. Their multipurpose nature enables them to cater to diverse cleaning needs, from floors and walls to glass and countertops.

Innovations in eco-friendly and biodegradable formulations are also increasing their popularity. The high demand for general purpose cleaners is driven by growing awareness of hygiene standards and stringent regulations that necessitate regular and thorough cleaning. Moreover, their cost-effectiveness and ease of use make them a preferred choice across industries, supporting steady market growth and ensuring they remain the dominant segment within the market.

What are the Drivers, Restraints, and Key Trends of the Industrial and Institutional Cleaning Chemicals Market?

The market is expected to experience significant growth from 2025 to 2035, driven primarily by increasing awareness of hygiene and the rising demand for safer, eco-friendly cleaning products. Rising concerns about health and sanitation, especially in healthcare and food processing sectors, have pushed institutions to adopt advanced cleaning chemistries that offer both efficacy and reduced environmental impact. Innovation in formulation technologies such as enzyme-based, low-foam, and biodegradable chemicals is broadening market opportunities, enabling manufacturers to cater to evolving institutional needs and regulatory requirements.

Rising Institutional and Regulatory Focus Fuels Industrial and Institutional Cleaning Chemical Market Growth

The growing emphasis on stringent hygiene standards and regulatory compliance across healthcare, food processing, and commercial sectors has been a key driver of growth in the Industrial and Institutional Cleaning Chemical Market. In recent years, heightened sanitation protocols and infection control measures have pushed institutions globally to adopt advanced cleaning formulations that ensure safety and efficacy. By 2025, organizations are expected to increasingly utilize cleaning chemicals with proven antimicrobial and biodegradable properties, aligning with evolving regulatory requirements and environmental sustainability goals.

Innovation in Formulation and Technology Enhances Market Expansion Opportunities

In parallel, manufacturers are integrating advanced technologies such as enzyme-based and low-foam chemicals with automated dosing systems to optimize cleaning performance and reduce chemical waste. These innovations improve operational efficiency, reduce environmental impact, and enhance compliance with health and safety standards. By 2025, the adoption of sustainable cleaning formulations and smart dispensing technologies is anticipated to be a core element of institutional cleaning strategies, giving market leaders with superior product portfolios and delivery systems a significant competitive advantage.
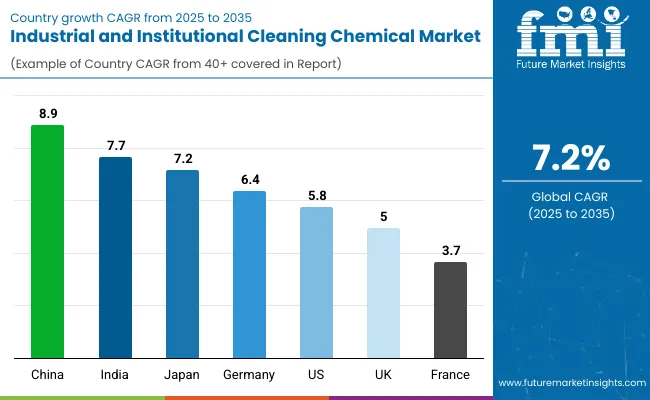
Industrial and Institutional Cleaning Chemicals Market Analysis by Key Countries

Country Wise Analysis Of Industrial And Institutional Cleaning Chemical Market

Countries CAGR (%)
China 8.9
India 7.7
Japan 7.2
Germany 6.4
USA 5.8
UK 5.0
France 3.7

The market shows varying growth rates across key countries. China leads with the highest CAGR of 8.9%, driven by rapid industrialization, expanding urban infrastructure, and strong government initiatives promoting sanitation and sustainable practices. India follows with a CAGR of 7.7%, supported by urban growth, sanitation campaigns, and rising demand in healthcare and hospitality sectors. Japan experiences a CAGR of 7.2%, propelled by stringent regulations, high healthcare standards, and innovations in biodegradable cleaning formulations.

Germany exhibits a steady CAGR of 6.4%, underpinned by its advanced industrial base, strict environmental policies, and emphasis on green chemistry. The U.S. market grows at 5.8% CAGR, fueled by rigorous hygiene standards, sustainable product adoption, and automated system integration. The U.K. sees 5% CAGR growth, supported by institutional investments and regulatory pressures for eco-friendly products. France, with a more moderate 3.7% CAGR, focuses on regulatory compliance, green formulations, and sustainable manufacturing.

The report covers an in-depth analysis of 40+ countries; seven top-performing OECD countries are highlighted below.

Production Capacity Trends in Industrial and Institutional Cleaning Chemicals Market in China

Revenue from industrial and institutional cleaning chemicals in Chinais expanding rapidly with a CAGR of 8.9%, driven by industrial growth and expanding urban infrastructure. Government initiatives focusing on sanitation and environmental sustainability are promoting the use of eco-friendly cleaning chemicals. The healthcare and food processing sectors notably contribute to demand with strict hygiene requirements

. Local manufacturers are investing heavily in enzyme- and solvent-based formulations to meet regulatory and consumer needs. Increasing public awareness and government subsidies support sustainable production practices. Policies targeting carbon neutrality further encourage green product development. The focus on research and innovation is strengthening China’s role as a global leader in this market.

  • China’s industrial growth drives increased demand for advanced cleaning chemicals.
  • Government initiatives promote sanitation and eco-friendly product use.
  • Expansion in healthcare and food processing boosts market need.

Output Expansion in Industrial and Institutional Cleaning Chemicals Market in India

Demand for industrial and institutional cleaning chemicals in India is growing at a CAGR of 7.7%, fueled by rapid urbanization and rising sanitation awareness. Government sanitation campaigns and increasing regulations in healthcare and educational institutions are key growth drivers. The hospitality sector also contributes to rising demand for specialized cleaning products.

Manufacturers are developing cost-effective and eco-friendly formulations to meet the needs of emerging markets. Growing commercial infrastructure and expanding institutional cleaning services support strong market growth. Online distribution channels aid product availability even in remote areas. Rising consumer concern over hygiene standards promotes adoption of advanced cleaning solutions.

  • Urbanization accelerates sanitation demand nationwide.
  • Government campaigns emphasize hygiene in public institutions.
  • Increasing hospitality growth drives cleaning chemical use.

Structural Adoption in Industrial and Institutional Cleaning Chemicals Market in Germany

Revenue from industrial and institutional cleaning chemicals in Germany demonstrates a CAGR of 6.4%, driven by its advanced industrial base and strict environmental regulations. The automotive and manufacturing industries are significant end-users demanding sustainable cleaning agents. The country emphasizes research into green chemistry and biodegradable products, aligning with European environmental standards.

Industrial sectors prioritize reducing chemical emissions and waste through better production methods. Strict regulatory frameworks foster innovation in formulation and compliance. Germany’s healthcare and hospitality markets complement steady demand in institutional cleaning. Increased awareness of environmental impact leads manufacturers to adopt sustainable sourcing and production strategies.

  • Germany’s strong industrial base drives steady chemical demand.
  • Environmental regulations push green chemistry innovation.
  • Automotive and manufacturing sectors require sustainable cleaning.

Market Expansion in Industrial and Institutional Cleaning Chemicals Market in Japan

Revenue from industrial and institutional cleaning chemicalsin Japan is growing at a CAGR of 7.2%, supported by stringent regulations and high healthcare standards. Demand is rising for biodegradable and enzyme-based cleaning formulations that comply with environmental policies. Automated cleaning technologies integrated with dosing systems enhance efficiency in sectors like food processing and pharmaceuticals.

Companies prioritize innovation to meet sustainability goals and regulatory compliance. Institutional segments, especially post-pandemic, enforce heightened hygiene standards. Japan’s research institutions and manufacturers lead innovation in eco-friendly, high-performance cleaning products, driving market growth. Growing public health awareness fuels ongoing demand for advanced sanitation solutions.

  • Strict regulations shape product innovation in Japan.
  • Healthcare sectors continue to demand higher hygiene standards.
  • Automated cleaning systems improve operational efficiency.

Growth Acceleration in Industrial and Institutional Cleaning Chemicals Market in the USA

Demand for industrial and institutional cleaning chemicals in the USA market grows at a CAGR of 5.8%, led by strict hygiene regulations in healthcare, foodservice, and educational sectors. Rising demand for sustainable formulations drives innovation. Adoption of automated cleaning systems reduces chemical waste and improves cleaning efficiency.

Leading manufacturers invest in product development emphasizing bio-based and non-toxic ingredients. Strict infection control practices post-pandemic increase demand for disinfectants and sanitizers. The commercial cleaning industry’s growth further propels market expansion, supported by partnerships and digital distribution methods. Corporate social responsibility initiatives stimulate market focus on green cleaning technologies.

  • The USA enforces rigorous hygiene standards in key sectors.
  • Sustainable and bio-based cleaning formulations are in high demand.
  • Automated cleaning systems optimize chemical usage.

Institutional Demand Growth in Industrial and Institutional Cleaning Chemicals Market in the UK

Demand for industrial and institutional cleaning chemicals in the UK is rising at a CAGR of 5%, bolstered by institutional investments in hygiene and stringent chemical regulations. Both public institutions and private enterprises increase adoption of eco-friendly cleaning products to meet legal requirements.

The food processing and healthcare sectors, in particular, uphold strict sanitation standards. The commercial cleaning service industry expands to accommodate growing hygiene awareness post-pandemic. Manufacturer collaborations with cleaning service providers optimize application and product delivery. Rising regulatory pressure encourages innovation in sustainable and efficient cleaning products. The UK's focus on environmental responsibility shapes future market trends.

  • Institutional hygiene investments are increasing across sectors.
  • Regulatory frameworks mandate eco-friendly chemicals.
  • Food processing and healthcare sectors maintain sanitation rigor.

Regulatory Focus in Industrial and Institutional Cleaning Chemicals Market in France

Revenue from industrial and institutional cleaning chemicals in France is projected to grow at a CAGR of 3.7%, driven by rigorous chemical safety laws and a focus on environmental sustainability. The healthcare and hospitality industries generate strong demand for cleaning chemicals that meet hygiene and eco-friendly standards.

Research emphasizes biodegradable products and green formulations as customers seek safer, sustainable options. Government campaigns reinforce public health awareness and sanitation practices. Waste minimization regulations compel manufacturers toward cleaner production techniques. Though growth is moderate, France’s adherence to strict quality and environmental standards positions it as a key player in Europe’s cleaning chemicals market. The balance of regulatory compliance and innovation maintains steady expansion.
  • France’s chemical regulations are among the strictest globally.
  • Demand for green and biodegradable products increases.
  • Waste reduction policies promote sustainable manufacturing.

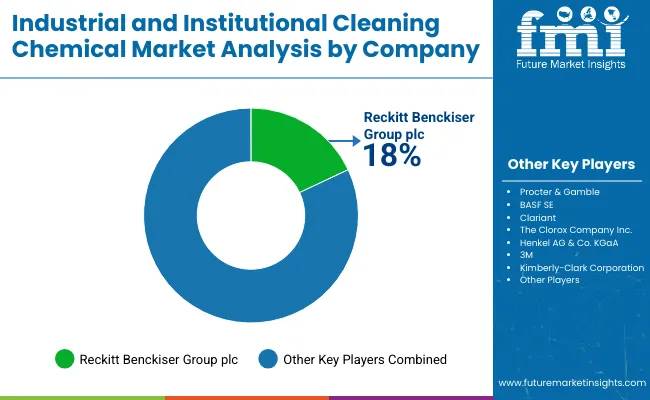
Competitive Landscape of the Industrial and Institutional Cleaning Chemicals Market

Industrial And Institutional Cleaning Chemical Market By Company

The market is moderately consolidated, with several key players holding significant shares through extensive production capabilities and product innovation. Leading companies such as Procter & Gamble, BASF SE, Ecolab, and Reckitt Benckiser command significant market shares by offering broad product portfolios that cater to diverse sectors including healthcare, food processing, and commercial facilities.

Companies like Dow Inc. and Clariant focus on cost-efficient production and supply chain optimization, facilitating competitive pricing and timely delivery. Regional firms emphasize local regulatory compliance, niche product customization, and sustainability initiatives to meet specific market demands, especially in emerging economies in Asia-Pacific and Latin America. Barriers to entry remain moderate due to the need for specialized chemical processing expertise, adherence to stringent environmental and safety regulations, and the ability to innovate continuously.

Scope of Report

Items Values
Quantitative Units (2025) USD 65.4 Billion
Raw Material Chlor -alkali (Caustic Soda, Soda Ash, Chlorine), Surfactants (Non-ionic, Anionic, Cationic, Amphoteric), Solvents (Alcohols, Hydrocarbons, Chlorinated, Ethers, Others), Phosphates, Biocides, Others (Chelants , Rheology Modifiers, Opacifiers , Dispersants, Ketones, Esters)
Product Type General Purpose Cleaners, Disinfectants and Sanitizers, Laundry Care Products, Vehicle Wash Products, Others (Specialty Cleaners, Warewashing Products)
End Use Verticals Commercial (Food Services, Retail, Healthcare, Laundry Care, Institutional Buildings, Others include offices, hotels, lodging, educational institutions, recreational areas, and public institutions such as courts and government buildings). Manufacturing (Food & Beverage Processing, Metal Manufacturing & Fabrication, Electronic Components, Others include textiles, pulp and paper industry, petrochemical industry, automotive manufacturing, and other specialized industrial processes).
Regions Covered North America, Latin America, Asia Pacific, Western Europe, Eastern Europe, Middle East & Africa
Countries Covered United States, China, India, Japan, Germany, United Kingdom, France, Brazil, Canada, South Korea, Mexico, Australia, and 40+ other countries
Key Companies Profiled Procter & Gamble, BASF SE, Clariant , The Clorox Company, Inc., Henkel AG & Co. KGaA , 3M, Kimberly-Clark Corporation, Reckitt Benckiser Group plc, Croda International PLC, Albemarle Corporation, Eastman Chemical Corporation, Huntsman International LLC, STEPAN Company, Westlake Chemicals Corporation, SOLVAY, Dow, Sasol.
Additional Attributes Dollar sales by product type and raw materials , i ncreasing demand for eco-friendly and biodegradable products, g rowth in automated cleaning systems, i nnovations in enzyme-based and low-foam technologies, r ising regulatory compliance, e xpanding use of sustainable sourcing and formulation standard s

Key Segments

By Raw Material:

In terms of Raw Material, the industry is divided into chlor-alkali, surfactant, solvents, phosphates, biocides, and others. The chlor-alkali segment is further divided into sub segments, as caustic soda, soda ash, and chlorine. The surfactant segment is divided as non-ionic, anionic, cationic, and amphoteric. The solvents segments consists of five sub-segments as alcohols, hydrocarbons, chlorinated, ethers, and others.

By Product Type:

In terms of Product Grade, the industry is divided into general purpose cleaners, disinfectants and sanitizers, laundry care products, vehicle wash products, and others.

By End Use Verticals:

In terms of End Use Verticals, the industry is divided into commercial and manufacturing. Commercial segment is further divided into food services, retail, healthcare, laundry care, institutional buildings and others. The manufacturing segment is divided into food and beverage processing, metal manufacturing and fabrication, electronic components and others.

By Region:

Key countries of North America, Latin America, Western Europe, Eastern Europe, East Asia, South Asia Pacific, and Middle East and Africa (MEA) have been covered in the report.

Table of Content

  1. Executive Summary
    • Global Market Outlook
    • Demand-side Trends
    • Supply-side Trends
    • Technology Roadmap Analysis
    • Analysis and Recommendations
  2. Market Overview
    • Market Coverage / Taxonomy
    • Market Definition / Scope / Limitations
  3. Market Background
    • Market Dynamics
      • Drivers
      • Restraints
      • Opportunity
      • Trends
    • Scenario Forecast
      • Demand in Optimistic Scenario
      • Demand in Likely Scenario
      • Demand in Conservative Scenario
    • Opportunity Map Analysis
    • Product Life Cycle Analysis
    • Supply Chain Analysis
      • Supply Side Participants and their Roles
        • Producers
        • Mid-Level Participants (Traders/ Agents/ Brokers)
        • Wholesalers and Distributors
      • Value Added and Value Created at Node in the Supply Chain
      • List of Raw Material Suppliers
      • List of Existing and Potential Buyer’s
    • Investment Feasibility Matrix
    • Value Chain Analysis
      • Profit Margin Analysis
      • Wholesalers and Distributors
      • Retailers
    • PESTLE and Porter’s Analysis
    • Regulatory Landscape
      • By Key Regions
      • By Key Countries
    • Regional Parent Market Outlook
    • Production and Consumption Statistics
    • Import and Export Statistics
  4. Global Market Analysis 2020 to 2024 and Forecast, 2025 to 2035
    • Historical Market Size Value (USD Billion) & Volume (Metric Tons) Analysis, 2020 to 2024
    • Current and Future Market Size Value (USD Billion) & Volume (Metric Tons) Projections, 2025 to 2035
      • Y-o-Y Growth Trend Analysis
      • Absolute $ Opportunity Analysis
  5. Global Market Pricing Analysis 2020 to 2024 and Forecast 2025 to 2035
  6. Global Market Analysis 2020 to 2024 and Forecast 2025 to 2035, By Raw Material
    • Introduction / Key Findings
    • Historical Market Size Value (USD Billion) & Volume (Metric Tons) Analysis By Raw Material, 2020 to 2024
    • Current and Future Market Size Value (USD Billion) & Volume (Metric Tons) Analysis and Forecast By Raw Material, 2025 to 2035
      • Chlor-alkali
        • Caustic Soda
        • Soda Ash
        • Chlorine
      • Surfactant
        • Non-ionic
        • Anionic
        • Cationic
        • Amphoteric
      • Solvents
        • Alcohols
        • Hydrocarbons
        • Chlorinated
        • Ethers
        • Others (Chelants, Rheology Modifiers, Opacifiers, Dispersants, Ketones, Esters)
      • Phosphates
      • Biocides
      • Others (Specialty Chemicals, Additives)
    • Y-o-Y Growth Trend Analysis By Raw Material, 2020 to 2024
    • Absolute $ Opportunity Analysis By Raw Material, 2025 to 2035
  7. Global Market Analysis 2020 to 2024 and Forecast 2025 to 2035, By Product Type
    • Introduction / Key Findings
    • Historical Market Size Value (USD Billion) & Volume (Metric Tons) Analysis By Product Type, 2020 to 2024
    • Current and Future Market Size Value (USD Billion) & Volume (Metric Tons) Analysis and Forecast By Product Type, 2025 to 2035
      • General Purpose Cleaners
      • Disinfectants and Sanitizers
      • Laundry Care Products
      • Vehicle Wash Products
      • Others (Specialty Cleaners, Warewashing Products)
    • Y-o-Y Growth Trend Analysis By Product Type, 2020 to 2024
    • Absolute $ Opportunity Analysis By Product Type, 2025 to 2035
  8. Global Market Analysis 2020 to 2024 and Forecast 2025 to 2035, By End Use Verticals
    • Introduction / Key Findings
    • Historical Market Size Value (USD Billion) & Volume (Metric Tons) Analysis By End Use Verticals, 2020 to 2024
    • Current and Future Market Size Value (USD Billion) & Volume (Metric Tons) Analysis and Forecast By End Use Verticals, 2025 to 2035
      • Commercial
        • Food Services
        • Retail
        • Healthcare
        • Laundry Care
        • Institutional Buildings
        • Others (Offices, Hotels, Lodging, Educational Institutions, Recreational Areas, Courts, Government Buildings)
      • Manufacturing
        • Food & Beverage Processing
        • Metal Manufacturing & Fabrication
        • Electronic Components
        • Others (Textiles, Pulp and Paper Industry, Petrochemical Industry, Automotive Manufacturing, Specialized Industrial Processes)
    • Y-o-Y Growth Trend Analysis By End Use Verticals, 2020 to 2024
    • Absolute $ Opportunity Analysis By End Use Verticals, 2025 to 2035
  9. Global Market Analysis 2020 to 2024 and Forecast 2025 to 2035, By Region
    • Introduction
    • Historical Market Size Value (USD Billion) & Volume (Metric Tons) Analysis By Region, 2020 to 2024
    • Current Market Size Value (USD Billion) & Volume (Metric Tons) Analysis and Forecast By Region, 2025 to 2035
      • North America
      • Latin America
      • Western Europe
      • Eastern Europe
      • East Asia
      • South Asia & Pacific
      • Middle East and Africa
    • Market Attractiveness Analysis By Region
  10. North America Market Analysis 2020 to 2024 and Forecast 2025 to 2035, By Country
    • Historical Market Size Value (USD Billion) & Volume (Metric Tons) Trend Analysis By Market Taxonomy, 2020 to 2024
    • Market Size Value (USD Billion) & Volume (Metric Tons) Forecast By Market Taxonomy, 2025 to 2035
      • By Country
        • USA
        • Canada
        • Mexico
      • By Raw Material
      • By Product Type
      • By End Use Verticals
    • Market Attractiveness Analysis
      • By Country
      • By Raw Material
      • By Product Type
      • By End Use Verticals
    • Key Takeaways
  11. Latin America Market Analysis 2020 to 2024 and Forecast 2025 to 2035, By Country
    • Historical Market Size Value (USD Billion) & Volume (Metric Tons) Trend Analysis By Market Taxonomy, 2020 to 2024
    • Market Size Value (USD Billion) & Volume (Metric Tons) Forecast By Market Taxonomy, 2025 to 2035
      • By Country
        • Brazil
        • Argentina
        • Rest of LATAM
      • By Raw Material
      • By Product Type
      • By End Use Verticals
    • Market Attractiveness Analysis
      • By Country
      • By Raw Material
      • By Product Type
      • By End Use Verticals
    • Key Takeaways
  12. Western Europe Market Analysis 2020 to 2024 and Forecast 2025 to 2035, By Country
    • Historical Market Size Value (USD Billion) & Volume (Metric Tons) Trend Analysis By Market Taxonomy, 2020 to 2024
    • Market Size Value (USD Billion) & Volume (Metric Tons) Forecast By Market Taxonomy, 2025 to 2035
      • By Country
        • Germany
        • Italy
        • France
        • UK
        • Spain
        • BENELUX
        • Nordic
        • Rest of W.Europe
      • By Raw Material
      • By Product Type
      • By End Use Verticals
    • Market Attractiveness Analysis
      • By Country
      • By Raw Material
      • By Product Type
      • By End Use Verticals
    • Key Takeaways
  13. Eastern Europe Market Analysis 2020 to 2024 and Forecast 2025 to 2035, By Country
    • Historical Market Size Value (USD Billion) & Volume (Metric Tons) Trend Analysis By Market Taxonomy, 2020 to 2024
    • Market Size Value (USD Billion) & Volume (Metric Tons) Forecast By Market Taxonomy, 2025 to 2035
      • By Country
        • Russia
        • Hungary
        • Poland
        • Balkan & Baltics
        • Rest of E. Europe
      • By Raw Material
      • By Product Type
      • By End Use Verticals
    • Market Attractiveness Analysis
      • By Country
      • By Raw Material
      • By Product Type
      • By End Use Verticals
    • Key Takeaways
  14. East Asia Market Analysis 2020 to 2024 and Forecast 2025 to 2035, By Country
    • Historical Market Size Value (USD Billion) & Volume (Metric Tons) Trend Analysis By Market Taxonomy, 2020 to 2024
    • Market Size Value (USD Billion) & Volume (Metric Tons) Forecast By Market Taxonomy, 2025 to 2035
      • By Country
        • China
        • Japan
        • South Korea
      • By Raw Material
      • By Product Type
      • By End Use Verticals
    • Market Attractiveness Analysis
      • By Country
      • By Raw Material
      • By Product Type
      • By End Use Verticals
    • Key Takeaways
  15. South Asia & Pacific Market Analysis 2020 to 2024 and Forecast 2025 to 2035, By Country
    • Historical Market Size Value (USD Billion) & Volume (Metric Tons) Trend Analysis By Market Taxonomy, 2020 to 2024
    • Market Size Value (USD Billion) & Volume (Metric Tons) Forecast By Market Taxonomy, 2025 to 2035
      • By Country
        • India
        • Australia & New Zealand
        • ASEAN
        • Rest of SAP
      • By Raw Material
      • By Product Type
      • By End Use Verticals
    • Market Attractiveness Analysis
      • By Country
      • By Raw Material
      • By Product Type
      • By End Use Verticals
    • Key Takeaways
  16. Middle East and Africa Market Analysis 2020 to 2024 and Forecast 2025 to 2035, By Country
    • Historical Market Size Value (USD Billion) & Volume (Metric Tons) Trend Analysis By Market Taxonomy, 2020 to 2024
    • Market Size Value (USD Billion) & Volume (Metric Tons) Forecast By Market Taxonomy, 2025 to 2035
      • By Country
        • GCC Countries
        • Northern Africa
        • South Africa
        • Turkiye
        • Rest of MEA
      • By Raw Material
      • By Product Type
      • By End Use Verticals
    • Market Attractiveness Analysis
      • By Country
      • By Raw Material
      • By Product Type
      • By End Use Verticals
    • Key Takeaways
  17. Key Countries Market Analysis
    • USA
      • Pricing Analysis
      • Market Share Analysis, 2024
        • By Raw Material
        • By Product Type
        • By End Use Verticals
    • Canada
      • Pricing Analysis
      • Market Share Analysis, 2024
        • By Raw Material
        • By Product Type
        • By End Use Verticals
    • Brazil
      • Pricing Analysis
      • Market Share Analysis, 2024
        • By Raw Material
        • By Product Type
        • By End Use Verticals
    • Mexico
      • Pricing Analysis
      • Market Share Analysis, 2024
        • By Raw Material
        • By Product Type
        • By End Use Verticals
    • Argentina
      • Pricing Analysis
      • Market Share Analysis, 2024
        • By Raw Material
        • By Product Type
        • By End Use Verticals
  18. Market Structure Analysis
    • Competition Dashboard
    • Competition Benchmarking
    • Market Share Analysis of Top Players
      • By Regional
      • By Raw Material
      • By Product Type
      • By End Use Verticals
  19. Competition Analysis
    • Competition Deep Dive
      • Procter & Gamble
        • Overview
        • Product Portfolio
        • Profitability by Market Segments (Product/Age /Sales Channel/Region)
        • Sales Footprint
        • Strategy Overview
          • Marketing Strategy
          • Product Strategy
          • Channel Strategy
      • BASF SE
        • Overview
        • Product Portfolio
        • Profitability by Market Segments (Product/Age /Sales Channel/Region)
        • Sales Footprint
        • Strategy Overview
          • Marketing Strategy
          • Product Strategy
          • Channel Strategy
      • Clariant
        • Overview
        • Product Portfolio
        • Profitability by Market Segments (Product/Age /Sales Channel/Region)
        • Sales Footprint
        • Strategy Overview
          • Marketing Strategy
          • Product Strategy
          • Channel Strategy
      • The Clorox Company, Inc.
        • Overview
        • Product Portfolio
        • Profitability by Market Segments (Product/Age /Sales Channel/Region)
        • Sales Footprint
        • Strategy Overview
          • Marketing Strategy
          • Product Strategy
          • Channel Strategy
      • Henkel AG & Co. KGaA
        • Overview
        • Product Portfolio
        • Profitability by Market Segments (Product/Age /Sales Channel/Region)
        • Sales Footprint
        • Strategy Overview
          • Marketing Strategy
          • Product Strategy
          • Channel Strategy
      • 3M
        • Overview
        • Product Portfolio
        • Profitability by Market Segments (Product/Age /Sales Channel/Region)
        • Sales Footprint
        • Strategy Overview
          • Marketing Strategy
          • Product Strategy
          • Channel Strategy
      • Kimberly-Clark Corporation
        • Overview
        • Product Portfolio
        • Profitability by Market Segments (Product/Age /Sales Channel/Region)
        • Sales Footprint
        • Strategy Overview
          • Marketing Strategy
          • Product Strategy
          • Channel Strategy
      • Reckitt Benckiser Group plc
        • Overview
        • Product Portfolio
        • Profitability by Market Segments (Product/Age /Sales Channel/Region)
        • Sales Footprint
        • Strategy Overview
          • Marketing Strategy
          • Product Strategy
          • Channel Strategy
      • Croda International PLC
        • Overview
        • Product Portfolio
        • Profitability by Market Segments (Product/Age /Sales Channel/Region)
        • Sales Footprint
        • Strategy Overview
          • Marketing Strategy
          • Product Strategy
          • Channel Strategy
      • Albemarle Corporation
        • Overview
        • Product Portfolio
        • Profitability by Market Segments (Product/Age /Sales Channel/Region)
        • Sales Footprint
        • Strategy Overview
          • Marketing Strategy
          • Product Strategy
          • Channel Strategy
      • Eastman Chemical Corporation
        • Overview
        • Product Portfolio
        • Profitability by Market Segments (Product/Age /Sales Channel/Region)
        • Sales Footprint
        • Strategy Overview
          • Marketing Strategy
          • Product Strategy
          • Channel Strategy
      • Huntsman International LLC
        • Overview
        • Product Portfolio
        • Profitability by Market Segments (Product/Age /Sales Channel/Region)
        • Sales Footprint
        • Strategy Overview
          • Marketing Strategy
          • Product Strategy
          • Channel Strategy
      • STEPAN Company
        • Overview
        • Product Portfolio
        • Profitability by Market Segments (Product/Age /Sales Channel/Region)
        • Sales Footprint
        • Strategy Overview
          • Marketing Strategy
          • Product Strategy
          • Channel Strategy
      • Westlake Chemicals Corporation
        • Overview
        • Product Portfolio
        • Profitability by Market Segments (Product/Age /Sales Channel/Region)
        • Sales Footprint
        • Strategy Overview
          • Marketing Strategy
          • Product Strategy
          • Channel Strategy
      • SOLVAY
        • Overview
        • Product Portfolio
        • Profitability by Market Segments (Product/Age /Sales Channel/Region)
        • Sales Footprint
        • Strategy Overview
          • Marketing Strategy
          • Product Strategy
          • Channel Strategy
      • Dow
        • Overview
        • Product Portfolio
        • Profitability by Market Segments (Product/Age /Sales Channel/Region)
        • Sales Footprint
        • Strategy Overview
          • Marketing Strategy
          • Product Strategy
          • Channel Strategy
      • Sasol
        • Overview
        • Product Portfolio
        • Profitability by Market Segments (Product/Age /Sales Channel/Region)
        • Sales Footprint
        • Strategy Overview
          • Marketing Strategy
          • Product Strategy
          • Channel Strategy
  20. Assumptions & Acronyms Used
  21. Research Methodology

List of Tables

  • Table 1: Global Market Value (USD Billion) Forecast by Region, 2020-2035
  • Table 2: Global Market Volume (Metric Tons) Forecast by Region, 2020-2035
  • Table 3: Global Market Value (USD Billion) Forecast by Raw Material, 2020-2035
  • Table 4: Global Market Volume (Metric Tons) Forecast by Raw Material, 2020-2035
  • Table 5: Global Market Value (USD Billion) Forecast by Product Type, 2020-2035
  • Table 6: Global Market Volume (Metric Tons) Forecast by Product Type, 2020-2035
  • Table 7: Global Market Value (USD Billion) Forecast by End Use Verticals, 2020-2035
  • Table 8: Global Market Volume (Metric Tons) Forecast by End Use Verticals, 2020-2035
  • Table 9: North America Market Value (USD Billion) Forecast by Country, 2020-2035
  • Table 10: North America Market Volume (Metric Tons) Forecast by Country, 2020-2035
  • Table 11: North America Market Value (USD Billion) Forecast by Raw Material, 2020-2035
  • Table 12: North America Market Volume (Metric Tons) Forecast by Raw Material, 2020-2035
  • Table 13: North America Market Value (USD Billion) Forecast by Product Type, 2020-2035
  • Table 14: North America Market Volume (Metric Tons) Forecast by Product Type, 2020-2035
  • Table 15: North America Market Value (USD Billion) Forecast by End Use Verticals, 2020-2035
  • Table 16: North America Market Volume (Metric Tons) Forecast by End Use Verticals, 2020-2035
  • Table 17: Latin America Market Value (USD Billion) Forecast by Country, 2020-2035
  • Table 18: Latin America Market Volume (Metric Tons) Forecast by Country, 2020-2035
  • Table 19: Latin America Market Value (USD Billion) Forecast by Raw Material, 2020-2035
  • Table 20: Latin America Market Volume (Metric Tons) Forecast by Raw Material, 2020-2035
  • Table 21: Latin America Market Value (USD Billion) Forecast by Product Type, 2020-2035
  • Table 22: Latin America Market Volume (Metric Tons) Forecast by Product Type, 2020-2035
  • Table 23: Latin America Market Value (USD Billion) Forecast by End Use Verticals, 2020-2035
  • Table 24: Latin America Market Volume (Metric Tons) Forecast by End Use Verticals, 2020-2035
  • Table 25: Western Europe Market Value (USD Billion) Forecast by Country, 2020-2035
  • Table 26: Western Europe Market Volume (Metric Tons) Forecast by Country, 2020-2035
  • Table 27: Western Europe Market Value (USD Billion) Forecast by Raw Material, 2020-2035
  • Table 28: Western Europe Market Volume (Metric Tons) Forecast by Raw Material, 2020-2035
  • Table 29: Western Europe Market Value (USD Billion) Forecast by Product Type, 2020-2035
  • Table 30: Western Europe Market Volume (Metric Tons) Forecast by Product Type, 2020-2035
  • Table 31: Western Europe Market Value (USD Billion) Forecast by End Use Verticals, 2020-2035
  • Table 32: Western Europe Market Volume (Metric Tons) Forecast by End Use Verticals, 2020-2035
  • Table 33: Eastern Europe Market Value (USD Billion) Forecast by Country, 2020-2035
  • Table 34: Eastern Europe Market Volume (Metric Tons) Forecast by Country, 2020-2035
  • Table 35: Eastern Europe Market Value (USD Billion) Forecast by Raw Material, 2020-2035
  • Table 36: Eastern Europe Market Volume (Metric Tons) Forecast by Raw Material, 2020-2035
  • Table 37: Eastern Europe Market Value (USD Billion) Forecast by Product Type, 2020-2035
  • Table 38: Eastern Europe Market Volume (Metric Tons) Forecast by Product Type, 2020-2035
  • Table 39: Eastern Europe Market Value (USD Billion) Forecast by End Use Verticals, 2020-2035
  • Table 40: Eastern Europe Market Volume (Metric Tons) Forecast by End Use Verticals, 2020-2035
  • Table 41: East Asia Market Value (USD Billion) Forecast by Country, 2020-2035
  • Table 42: East Asia Market Volume (Metric Tons) Forecast by Country, 2020-2035
  • Table 43: East Asia Market Value (USD Billion) Forecast by Raw Material, 2020-2035
  • Table 44: East Asia Market Volume (Metric Tons) Forecast by Raw Material, 2020-2035
  • Table 45: East Asia Market Value (USD Billion) Forecast by Product Type, 2020-2035
  • Table 46: East Asia Market Volume (Metric Tons) Forecast by Product Type, 2020-2035
  • Table 47: East Asia Market Value (USD Billion) Forecast by End Use Verticals, 2020-2035
  • Table 48: East Asia Market Volume (Metric Tons) Forecast by End Use Verticals, 2020-2035
  • Table 49: South Asia & Pacific Market Value (USD Billion) Forecast by Country, 2020-2035
  • Table 50: South Asia & Pacific Market Volume (Metric Tons) Forecast by Country, 2020-2035
  • Table 51: South Asia & Pacific Market Value (USD Billion) Forecast by Raw Material, 2020-2035
  • Table 52: South Asia & Pacific Market Volume (Metric Tons) Forecast by Raw Material, 2020-2035
  • Table 53: South Asia & Pacific Market Value (USD Billion) Forecast by Product Type, 2020-2035
  • Table 54: South Asia & Pacific Market Volume (Metric Tons) Forecast by Product Type, 2020-2035
  • Table 55: South Asia & Pacific Market Value (USD Billion) Forecast by End Use Verticals, 2020-2035
  • Table 56: South Asia & Pacific Market Volume (Metric Tons) Forecast by End Use Verticals, 2020-2035
  • Table 57: Middle East and Africa Market Value (USD Billion) Forecast by Country, 2020-2035
  • Table 58: Middle East and Africa Market Volume (Metric Tons) Forecast by Country, 2020-2035
  • Table 59: Middle East and Africa Market Value (USD Billion) Forecast by Raw Material, 2020-2035
  • Table 60: Middle East and Africa Market Volume (Metric Tons) Forecast by Raw Material, 2020-2035
  • Table 61: Middle East and Africa Market Value (USD Billion) Forecast by Product Type, 2020-2035
  • Table 62: Middle East and Africa Market Volume (Metric Tons) Forecast by Product Type, 2020-2035
  • Table 63: Middle East and Africa Market Value (USD Billion) Forecast by End Use Verticals, 2020-2035
  • Table 64: Middle East and Africa Market Volume (Metric Tons) Forecast by End Use Verticals, 2020-2035

List of Figures

  • Figure 1: Global Market Volume (Metric Tons) Forecast 2020-2035
  • Figure 2: Global Market Pricing Analysis
  • Figure 3: Global Market Value (USD Billion) Forecast 2020-2035
  • Figure 4: Global Market Value Share and BPS Analysis by Raw Material, 2025 and 2035
  • Figure 5: Global Market Y-o-Y Growth Comparison by Raw Material, 2025-2035
  • Figure 6: Global Market Attractiveness Analysis by Raw Material
  • Figure 7: Global Market Value Share and BPS Analysis by Product Type, 2025 and 2035
  • Figure 8: Global Market Y-o-Y Growth Comparison by Product Type, 2025-2035
  • Figure 9: Global Market Attractiveness Analysis by Product Type
  • Figure 10: Global Market Value Share and BPS Analysis by End Use Verticals, 2025 and 2035
  • Figure 11: Global Market Y-o-Y Growth Comparison by End Use Verticals, 2025-2035
  • Figure 12: Global Market Attractiveness Analysis by End Use Verticals
  • Figure 13: Global Market Value (USD Billion) Share and BPS Analysis by Region, 2025 and 2035
  • Figure 14: Global Market Y-o-Y Growth Comparison by Region, 2025-2035
  • Figure 15: Global Market Attractiveness Analysis by Region
  • Figure 16: North America Market Incremental $ Opportunity, 2025-2035
  • Figure 17: Latin America Market Incremental $ Opportunity, 2025-2035
  • Figure 18: Western Europe Market Incremental $ Opportunity, 2025-2035
  • Figure 19: Eastern Europe Market Incremental $ Opportunity, 2025-2035
  • Figure 20: East Asia Market Incremental $ Opportunity, 2025-2035
  • Figure 21: South Asia & Pacific Market Incremental $ Opportunity, 2025-2035
  • Figure 22: Middle East and Africa Market Incremental $ Opportunity, 2025-2035
  • Figure 23: North America Market Value Share and BPS Analysis by Country, 2025 and 2035
  • Figure 24: North America Market Value Share and BPS Analysis by Raw Material, 2025 and 2035
  • Figure 25: North America Market Y-o-Y Growth Comparison by Raw Material, 2025-2035
  • Figure 26: North America Market Attractiveness Analysis by Raw Material
  • Figure 27: North America Market Value Share and BPS Analysis by Product Type, 2025 and 2035
  • Figure 28: North America Market Y-o-Y Growth Comparison by Product Type, 2025-2035
  • Figure 29: North America Market Attractiveness Analysis by Product Type
  • Figure 30: North America Market Value Share and BPS Analysis by End Use Verticals, 2025 and 2035
  • Figure 31: North America Market Y-o-Y Growth Comparison by End Use Verticals, 2025-2035
  • Figure 32: North America Market Attractiveness Analysis by End Use Verticals
  • Figure 33: Latin America Market Value Share and BPS Analysis by Country, 2025 and 2035
  • Figure 34: Latin America Market Value Share and BPS Analysis by Raw Material, 2025 and 2035
  • Figure 35: Latin America Market Y-o-Y Growth Comparison by Raw Material, 2025-2035
  • Figure 36: Latin America Market Attractiveness Analysis by Raw Material
  • Figure 37: Latin America Market Value Share and BPS Analysis by Product Type, 2025 and 2035
  • Figure 38: Latin America Market Y-o-Y Growth Comparison by Product Type, 2025-2035
  • Figure 39: Latin America Market Attractiveness Analysis by Product Type
  • Figure 40: Latin America Market Value Share and BPS Analysis by End Use Verticals, 2025 and 2035
  • Figure 41: Latin America Market Y-o-Y Growth Comparison by End Use Verticals, 2025-2035
  • Figure 42: Latin America Market Attractiveness Analysis by End Use Verticals
  • Figure 43: Western Europe Market Value Share and BPS Analysis by Country, 2025 and 2035
  • Figure 44: Western Europe Market Value Share and BPS Analysis by Raw Material, 2025 and 2035
  • Figure 45: Western Europe Market Y-o-Y Growth Comparison by Raw Material, 2025-2035
  • Figure 46: Western Europe Market Attractiveness Analysis by Raw Material
  • Figure 47: Western Europe Market Value Share and BPS Analysis by Product Type, 2025 and 2035
  • Figure 48: Western Europe Market Y-o-Y Growth Comparison by Product Type, 2025-2035
  • Figure 49: Western Europe Market Attractiveness Analysis by Product Type
  • Figure 50: Western Europe Market Value Share and BPS Analysis by End Use Verticals, 2025 and 2035
  • Figure 51: Western Europe Market Y-o-Y Growth Comparison by End Use Verticals, 2025-2035
  • Figure 52: Western Europe Market Attractiveness Analysis by End Use Verticals
  • Figure 53: Eastern Europe Market Value Share and BPS Analysis by Country, 2025 and 2035
  • Figure 54: Eastern Europe Market Value Share and BPS Analysis by Raw Material, 2025 and 2035
  • Figure 55: Eastern Europe Market Y-o-Y Growth Comparison by Raw Material, 2025-2035
  • Figure 56: Eastern Europe Market Attractiveness Analysis by Raw Material
  • Figure 57: Eastern Europe Market Value Share and BPS Analysis by Product Type, 2025 and 2035
  • Figure 58: Eastern Europe Market Y-o-Y Growth Comparison by Product Type, 2025-2035
  • Figure 59: Eastern Europe Market Attractiveness Analysis by Product Type
  • Figure 60: Eastern Europe Market Value Share and BPS Analysis by End Use Verticals, 2025 and 2035
  • Figure 61: Eastern Europe Market Y-o-Y Growth Comparison by End Use Verticals, 2025-2035
  • Figure 62: Eastern Europe Market Attractiveness Analysis by End Use Verticals
  • Figure 63: East Asia Market Value Share and BPS Analysis by Country, 2025 and 2035
  • Figure 64: East Asia Market Value Share and BPS Analysis by Raw Material, 2025 and 2035
  • Figure 65: East Asia Market Y-o-Y Growth Comparison by Raw Material, 2025-2035
  • Figure 66: East Asia Market Attractiveness Analysis by Raw Material
  • Figure 67: East Asia Market Value Share and BPS Analysis by Product Type, 2025 and 2035
  • Figure 68: East Asia Market Y-o-Y Growth Comparison by Product Type, 2025-2035
  • Figure 69: East Asia Market Attractiveness Analysis by Product Type
  • Figure 70: East Asia Market Value Share and BPS Analysis by End Use Verticals, 2025 and 2035
  • Figure 71: East Asia Market Y-o-Y Growth Comparison by End Use Verticals, 2025-2035
  • Figure 72: East Asia Market Attractiveness Analysis by End Use Verticals
  • Figure 73: South Asia & Pacific Market Value Share and BPS Analysis by Country, 2025 and 2035
  • Figure 74: South Asia & Pacific Market Value Share and BPS Analysis by Raw Material, 2025 and 2035
  • Figure 75: South Asia & Pacific Market Y-o-Y Growth Comparison by Raw Material, 2025-2035
  • Figure 76: South Asia & Pacific Market Attractiveness Analysis by Raw Material
  • Figure 77: South Asia & Pacific Market Value Share and BPS Analysis by Product Type, 2025 and 2035
  • Figure 78: South Asia & Pacific Market Y-o-Y Growth Comparison by Product Type, 2025-2035
  • Figure 79: South Asia & Pacific Market Attractiveness Analysis by Product Type
  • Figure 80: South Asia & Pacific Market Value Share and BPS Analysis by End Use Verticals, 2025 and 2035
  • Figure 81: South Asia & Pacific Market Y-o-Y Growth Comparison by End Use Verticals, 2025-2035
  • Figure 82: South Asia & Pacific Market Attractiveness Analysis by End Use Verticals
  • Figure 83: Middle East and Africa Market Value Share and BPS Analysis by Country, 2025 and 2035
  • Figure 84: Middle East and Africa Market Value Share and BPS Analysis by Raw Material, 2025 and 2035
  • Figure 85: Middle East and Africa Market Y-o-Y Growth Comparison by Raw Material, 2025-2035
  • Figure 86: Middle East and Africa Market Attractiveness Analysis by Raw Material
  • Figure 87: Middle East and Africa Market Value Share and BPS Analysis by Product Type, 2025 and 2035
  • Figure 88: Middle East and Africa Market Y-o-Y Growth Comparison by Product Type, 2025-2035
  • Figure 89: Middle East and Africa Market Attractiveness Analysis by Product Type
  • Figure 90: Middle East and Africa Market Value Share and BPS Analysis by End Use Verticals, 2025 and 2035
  • Figure 91: Middle East and Africa Market Y-o-Y Growth Comparison by End Use Verticals, 2025-2035
  • Figure 92: Middle East and Africa Market Attractiveness Analysis by End Use Verticals
  • Figure 93: Global Market - Tier Structure Analysis
  • Figure 94: Global Market - Company Share Analysis

Frequently Asked Questions

How big is the industrial and institutional cleaning chemical market in 2025?

The global industrial and institutional cleaning chemical market is estimated to be valued at USD 65.4 billion in 2025.

What will be the size of the industrial and institutional cleaning chemical market in 2035?

The market size for industrial and institutional cleaning chemical is projected to reach USD 131.1 billion by 2035.

How much will the industrial and institutional cleaning chemical market grow between 2025 and 2035?

The industrial and institutional cleaning chemical market is expected to grow at a CAGR of 7.2% between 2025 and 2035.

Which raw material segment is projected to lead in the industrial and institutional cleaning chemical market in 2025?

The surfactants segment is projected to lead the industrial and institutional cleaning chemical market with a 34% market share in 2025.

Which product type is expected to contribute significant share in the industrial and institutional cleaning chemical market in 2025?

In terms of product type, general purpose cleaners are expected to command a 31% share in the industrial and institutional cleaning chemical market in 2025.

Explore Similar Insights

Future Market Insights

Industrial and Institutional Cleaning Chemical Market

Chat With

MaRIA

Hi There, I am MaRIA, Your Market Research Intelligence Assistant. How may I help you?