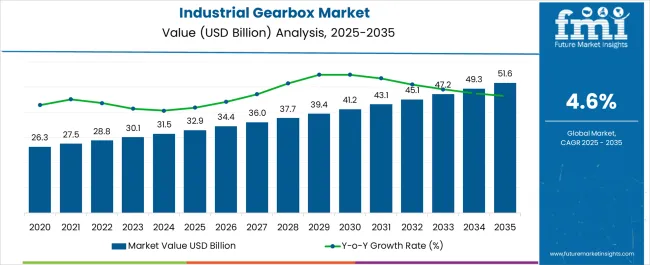
The industrial gearbox market is estimated to be valued at USD 32.9 billion in 2025 and is projected to reach USD 51.6 billion by 2035, registering a compound annual growth rate (CAGR) of 4.6% over the forecast period.
Mechanical engineers evaluate industrial gearbox specifications based on torque capacity ratings, efficiency characteristics, and maintenance interval extensions when designing power transmission systems for conveyor drives, mixer applications, and crusher installations requiring reliable operation under continuous duty cycles. Component selection involves analyzing gear tooth geometry, bearing load ratings, and housing construction materials while considering environmental protection requirements, mounting configuration flexibility, and service factor calculations necessary for specific industrial applications. Procurement decisions balance initial equipment costs against operational lifetime value, incorporating energy consumption reduction, maintenance cost minimization, and downtime prevention benefits that justify premium gearbox investment through total cost of ownership analysis.
Mechanical engineers evaluate industrial gearbox specifications based on torque capacity ratings, efficiency characteristics, and maintenance interval extensions when designing power transmission systems for conveyor drives, mixer applications, and crusher installations requiring reliable operation under continuous duty cycles. Component selection involves analyzing gear tooth geometry, bearing load ratings, and housing construction materials while considering environmental protection requirements, mounting configuration flexibility, and service factor calculations necessary for specific industrial applications. Procurement decisions balance initial equipment costs against operational lifetime value, incorporating energy consumption reduction, maintenance cost minimization, and downtime prevention benefits that justify premium gearbox investment through total cost of ownership analysis.
Engineering integration involves drive system designers, application specialists, and maintenance engineers collaborating to optimize gearbox selection that balances performance requirements with installation constraints while addressing specific industrial process demands and operational environments. System design encompasses motor coupling compatibility, output shaft configuration, and lubrication system integration while coordinating with variable frequency drives, coupling manufacturers, and industrial automation systems. Technical support includes application engineering, troubleshooting assistance, and performance optimization that ensure successful installation and operational reliability throughout diverse industrial applications.
Technology advancement prioritizes condition monitoring integration, synthetic lubricant optimization, and modular design enhancement that improve gearbox reliability while reducing maintenance requirements and operational costs throughout industrial applications. Innovation encompasses predictive maintenance sensors, intelligent lubrication systems, and remote monitoring capabilities that enable proactive service scheduling while optimizing operational efficiency and component longevity. Advanced features include variable ratio capabilities, hybrid electric integration, and noise reduction technologies that expand application possibilities while supporting industrial automation and environmental compliance requirements.
| Metric | Value |
|---|---|
| Industrial Gearbox Market Estimated Value in (2025 E) | USD 32.9 billion |
| Industrial Gearbox Market Forecast Value in (2035 F) | USD 51.6 billion |
| Forecast CAGR (2025 to 2035) | 4.6% |
The industrial gearbox market is experiencing steady growth owing to the rising demand for energy efficient machinery, automation trends in manufacturing, and expansion of heavy industries. Increasing investment in infrastructure development, mining, and power generation has amplified the requirement for reliable torque transmission solutions.
Technological advancements such as lightweight materials, precision manufacturing, and smart monitoring systems are enhancing gearbox performance and lifecycle efficiency. Environmental and regulatory pressures are also encouraging industries to adopt advanced gearboxes that minimize energy losses and reduce downtime.
With growing emphasis on industrial productivity and sustainability, the market outlook remains positive as end users continue to prioritize high performance and durable gearbox solutions across sectors such as mining, power, and material handling.
The market is segmented by Type, Design, and End User and region. Regionally, the market is classified into North America, Latin America, Western Europe, Eastern Europe, Balkan & Baltic Countries, Russia & Belarus, Central Asia, East Asia, South Asia & Pacific, and the Middle East & Africa.
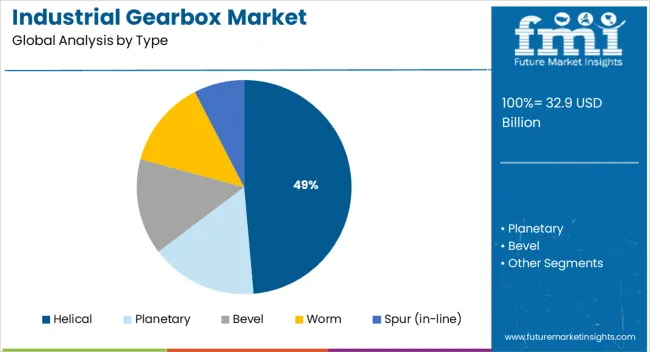
The helical type segment is projected to account for 48.60% of total market revenue by 2025, positioning it as the leading type. This growth is driven by its ability to deliver high load carrying capacity, smooth torque transmission, and operational efficiency.
Helical gearboxes are preferred in continuous and heavy duty applications as they minimize vibration and noise while enhancing durability. Their adaptability across multiple industrial environments, along with the ability to handle variable loads, has reinforced their widespread use.
As industries increasingly demand energy efficient and low maintenance solutions, the dominance of helical gearboxes is expected to be sustained.
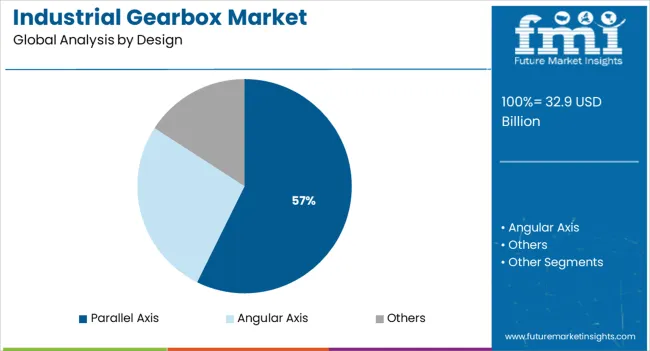
The parallel axis design segment is expected to hold 57.30% of total revenue by 2025 within the design category, making it the dominant design type. This leadership is attributed to its capacity to handle heavy loads with greater efficiency and its compatibility with compact machinery layouts.
The parallel axis design offers improved alignment, reduced wear, and increased durability, making it highly suitable for industries such as mining, cement, and power. Its capability to provide consistent torque transfer while maintaining compactness has strengthened its adoption.
With industries moving toward space saving yet robust solutions, the parallel axis design continues to lead the market.
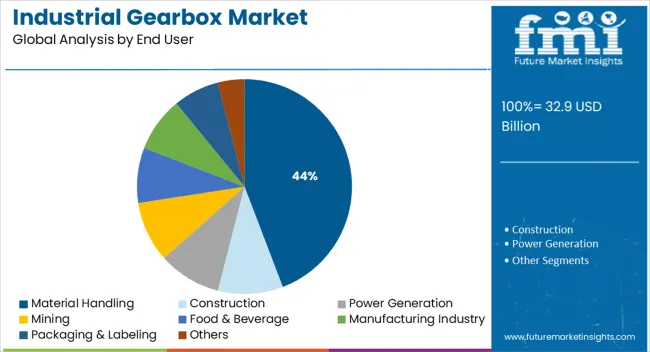
The material handling end user segment is forecasted to contribute 44.20% of overall revenue by 2025, making it the leading application area. Growth in this segment is propelled by the increasing reliance on automated warehousing, conveyor systems, and logistics solutions.
The demand for efficient and reliable torque transmission in handling bulk goods and heavy loads has accelerated gearbox integration in material handling operations. Enhanced operational safety, reduced downtime, and improved energy efficiency are being prioritized by enterprises, further strengthening demand in this segment.
As global supply chains continue to expand and automation becomes central to logistics, material handling remains the most significant end user segment for industrial gearboxes.
When compared to the 4.3% CAGR recorded between 2020 and 2025, the industrial gearbox business is predicted to expand at a 4.6% CAGR between 2025 and 2035. The slight increase in growth rate can be attributed to the introduction of high-end technologies like AI.
| Year | Market Value |
|---|---|
| 2020 | USD 22.27 billion |
| 2024 | USD 27.49 billion |
| 2025 | USD 28.75 billion |
| 2035 | USD 41.21 billion |
Short-term Growth (2025 to 2029): The market is anticipated to increase as a result of the rising demand for advanced industrial gearboxes, such as those with better torque capacity and higher power handling ability.
Medium-term Growth (2035 to 2035): It is anticipated that the market is benefiting from industry 4.0's quick adoption, along with other emerging technologies like the internet of things and artificial intelligence throughout this time.
Long-term Growth (2035 to 2035): It is expected that rising industrial activity, notably in the automotive, mining, and oil & gas industries, is likely to fuel the industrial gearbox sector's long-term expansion.
Given the aforementioned reasons, the industrial gearbox sector is predicted to develop by 1.04 times between 2025 and 2025.
Due to the growth of the robotics industry, the industrial gearbox business has recently experienced rising demand. To precisely manage the speed and torque of the robotic arms, gearboxes are now required as a result of the integration of robotics into industrial processes.
The need for industrial gearboxes is rising as the robotics sector expands and new technologies become accessible. Industrial gearbox manufacturers now have more prospects due to this technology. Gearboxes can be made to give more precise motion control for industrial processes, with the capacity to precisely regulate the movements of industrial robots.
As a result, industrial gearbox manufacturers are now significant providers of motion control components to the robotics industry. This has enhanced precision and efficiency in industrial processes.
Demand for industrial gearboxes has also been boosted by the development of autonomous robots. Autonomous robots can complete difficult jobs with little to no assistance from humans. This demands precise motion control, which is only possible with industrial gearboxes.
The market is expected to expand significantly over the next few years, as automation and smart manufacturing become more prevalent. To maximize production, cut costs, and enhance product quality, smart manufacturing entails integrating digital technologies into the manufacturing process.
This involves artificial intelligence (AI), the Internet of Things (IoT), and machine learning. The production process can be monitored and controlled in real time with the use of AI, IoT, and machine learning, which boosts productivity and efficiency.
Industrial gearbox demand is anticipated to increase as smart manufacturing becomes more prevalent since these gearboxes are utilized to regulate the speed and torque of production-related machinery and components. Given that industrial gearboxes are an essential part of the industrial automation process, the adoption of smart manufacturing is predicted to increase demand for these devices.
| Country | Market Value (2025) |
|---|---|
| United Kingdom | USD 1.29 billion |
| United States | USD 2.74 billion |
| China | USD 8.59 billion |
| India | USD 15.56 billion |
| Japan | USD 1.3 billion |
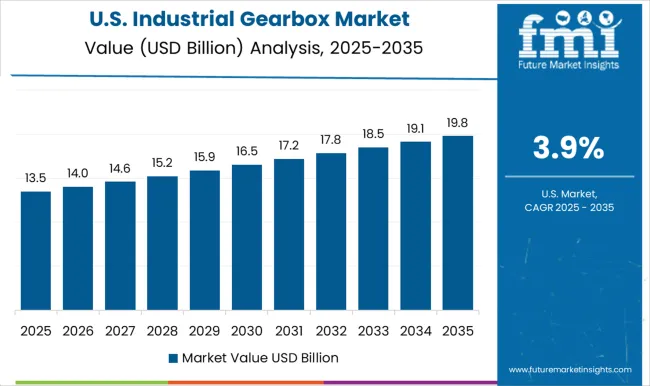
From 2025 to 2035, the industrial gearbox market in the US is anticipated to expand at a CAGR of 5.1%. The market is anticipated to be driven by the rising demand for industrial gearboxes brought on by the expansion of the manufacturing and process sectors. It is anticipated that the industrial gearbox sector in the United States is likely to experience considerable growth due to the rising demand for sophisticated industrial gearbox technologies. It includes high power density, decreased noise, and extended life duration. It is also anticipated that the market is likely to increase as a result of the growing trend of automation and digitalization in industrial sectors. Additionally, measures to cut energy use and the development of smart factories are anticipated to further accelerate market expansion. However, it is anticipated that the high price of industrial gearboxes and the scarcity of experienced staff is likely to impede market expansion.
From 2025 to 2035, the market in the United Kingdom is anticipated to expand at a CAGR of 5.1%. The necessity for energy efficiency in industrial operations and the rising demand for industrial automation technology are the key drivers of this expansion. With a sizable number of businesses engaged in the industry, including Renold, David Brown, and SEW-Eurodrive, the United Kingdom is one of the top producers of industrial gearboxes in the world. The United Kingdom government has made several actions to encourage the development of the industrial gearbox industry there. This entails offering financial incentives for the use of energy-efficient technologies, like industrial gearboxes, as well as supporting sector-specific research and development initiatives. To help the creation of novel goods and technology in the market, the government has also set up a network of regional innovation hubs.
Asia Pacific: Industrial Gearbox Market's Emerging Automation Hub
| Country | India |
|---|---|
| CAGR (2020 to 2025) | 5.1% |
| CAGR (2025 to 2035) | 6.3% |
| Country | Japan |
|---|---|
| CAGR (2020 to 2025) | 3% |
| CAGR (2025 to 2035) | 4.5% |
| Country | China |
|---|---|
| CAGR (2020 to 2025) | 10.2% |
| CAGR (2025 to 2035) | 9.5% |
The Indian government has started several projects to encourage the manufacturing of industrial gearboxes in India. For instance, the National Manufacturing Competitiveness Programme (NMCP) has been established to offer small and medium firms (SMEs) in the industrial gearbox industry financial help and technical support.
The Make in India initiative, which the government also announced for the manufacturing industry, has accelerated the expansion of the industrial gearbox sector in India. In addition, several government-sponsored initiatives, including the Startup India Initiative and the Pradhan Mantri MUDRA Yojana (PMMY), are anticipated to fuel the expansion of the industrial gearbox market in India over the next several years.
The increased need for industrial gearboxes in industries like oil and gas, manufacturing, and mining is credited with this expansion. Additionally, it is anticipated that the government's emphasis on the development of renewable energy sources like wind and solar power propels the industry.
Key competitors in the industrial gearbox sector in China are concentrating on new product releases and partnerships with regional businesses to take advantage of the expanding demand. To increase the range of products it offers, the Chinese gearbox manufacturer NGC Group partnered with the American industrial firm Rexnord Corporation in April 2024.
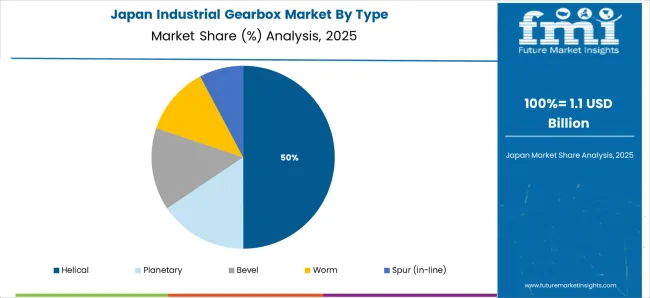
The industrial sector's increased emphasis on energy efficiency and technology developments are the key causes of this expansion. Furthermore, it is anticipated that government programs to encourage the use of green technology, such as renewable energy, increase sales of industrial gearboxes in Japan. In Japan, businesses including Mitsubishi Heavy Industries, Sumitomo Heavy Industries, and Hitachi Ltd. are active in the industrial gearbox sector.
These businesses are concentrating on creating sophisticated gearboxes with increased efficiency and less noise. Additionally, these businesses are concentrating on giving their clients support and after-sales service.
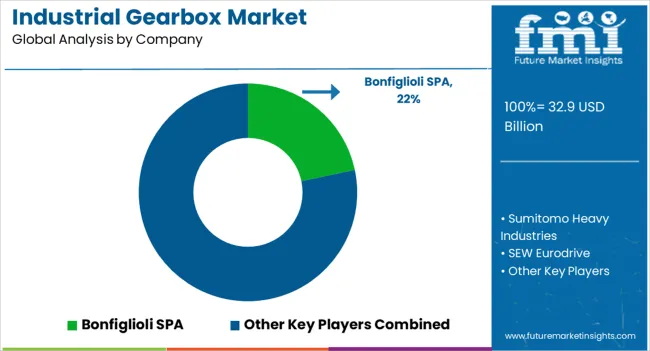
The industrial gearbox market is witnessing steady expansion driven by automation, process optimization, and the global shift toward high-efficiency mechanical power transmission systems. Leading manufacturers such as Bonfiglioli S.p.A., Sumitomo Heavy Industries Ltd., and SEW-EURODRIVE GmbH & Co. KG are pioneering advanced gearbox designs offering superior torque density, reduced noise, and enhanced reliability for diverse industrial applications. Nidec Motor Corporation and Bauer Gear Motor GmbH are emphasizing compact, energy-efficient solutions catering to robotics, material handling, and heavy machinery.
Emerson Electric Co. and Elecon Engineering Co. Ltd. are integrating digital monitoring and predictive maintenance features into gearbox systems to improve uptime and reduce lifecycle costs. Dana Brevini Power Transmission and Flender GmbH continue to innovate with modular gear units optimized for renewable energy, marine, and mining sectors. Meanwhile, Comer Industries S.p.A. and Johnson Electric Holdings Ltd. are advancing precision motion control systems that enhance operational efficiency across manufacturing and automotive domains.
China High-Speed Transmission Equipment Group Co. Ltd. plays a crucial role in scaling production capacity and meeting Asia’s growing industrial demand. Fact.MR analysis found that automation-driven manufacturing and renewable energy projects will keep industrial gearbox demand strong through 2035.
| Item | Value |
|---|---|
| Quantitative Units (2025) | USD 32.9 billion |
| Type | Helical, Planetary, Bevel, Worm, Spur (In-line) |
| Design | Parallel Axis, Angular Axis, Others |
| End User | Material Handling, Construction, Power Generation, Mining, Food & Beverage, Manufacturing, Packaging & Labeling, Others |
| Regions Covered | North America, Latin America, Europe, East Asia, South Asia & Pacific, Middle East & Africa |
| Countries Covered | United States, United Kingdom, China, India, Japan, and 40+ countries |
| Key Companies Profiled | Bonfiglioli S.p.A., Sumitomo Heavy Industries Ltd., SEW-EURODRIVE GmbH & Co. KG, Nidec Motor Corporation, Bauer Gear Motor GmbH, Emerson Electric Co., Elecon Engineering Co. Ltd., Dana Brevini Power Transmission, Johnson Electric Holdings Ltd., Flender GmbH, Comer Industries S.p.A., China High-Speed Transmission Equipment Group Co. Ltd. |
| Additional Attributes | Dollar sales by type, design, and end user; regional adoption patterns across Asia Pacific, Europe, and North America; competitive landscape of key gearbox manufacturers and distributors; analysis of automation, robotics, and energy efficiency integration; assessment of modular gearbox systems, predictive maintenance adoption, and digital condition monitoring technologies. |
The global industrial gearbox market is estimated to be valued at USD 32.9 billion in 2025.
The market size for the industrial gearbox market is projected to reach USD 51.6 billion by 2035.
The industrial gearbox market is expected to grow at a 4.6% CAGR between 2025 and 2035.
The key product types in industrial gearbox market are .
In terms of design, parallel axis segment to command 57.3% share in the industrial gearbox market in 2025.


Full Research Suite comprises of:
Market outlook & trends analysis
Interviews & case studies
Strategic recommendations
Vendor profiles & capabilities analysis
5-year forecasts
8 regions and 60+ country-level data splits
Market segment data splits
12 months of continuous data updates
DELIVERED AS:
PDF EXCEL ONLINE
Industrial Planetary Gearbox Market Analysis & Forecast 2025 to 2035
Industrial Precision Oven Market Size and Share Forecast Outlook 2025 to 2035
Industrial Water Chiller for PCB Market Size and Share Forecast Outlook 2025 to 2035
Industrial & Commercial HVLS Fans Market Size and Share Forecast Outlook 2025 to 2035
Industrial Robot Controller Market Size and Share Forecast Outlook 2025 to 2035
Industrial Wired Routers Market Size and Share Forecast Outlook 2025 to 2035
Industrial Evaporative Condensers Market Size and Share Forecast Outlook 2025 to 2035
Industrial Energy Management System Market Size and Share Forecast Outlook 2025 to 2035
Industrial Insulation Market Size and Share Forecast Outlook 2025 to 2035
Industrial Safety Gloves Market Size and Share Forecast Outlook 2025 to 2035
Industrial Cleaner Market Size and Share Forecast Outlook 2025 to 2035
Industrial Dust Treatment System Market Size and Share Forecast Outlook 2025 to 2035
Industrial Vertical Washing Tower Market Size and Share Forecast Outlook 2025 to 2035
Industrial Pepper Market Size and Share Forecast Outlook 2025 to 2035
Industrial Electronics Packaging Market Forecast and Outlook 2025 to 2035
Industrial Absorbent Market Forecast and Outlook 2025 to 2035
Industrial Furnace Industry Analysis in Europe Forecast and Outlook 2025 to 2035
Industrial Denox System Market Size and Share Forecast Outlook 2025 to 2035
Industrial Electronic Pressure Switch Market Size and Share Forecast Outlook 2025 to 2035
Industrial WiFi Module Market Size and Share Forecast Outlook 2025 to 2035

Thank you!
You will receive an email from our Business Development Manager. Please be sure to check your SPAM/JUNK folder too.
Chat With
MaRIA