Industrial Gas Stove Market Analysis – Size, Share, and Forecast 2023 to 2033

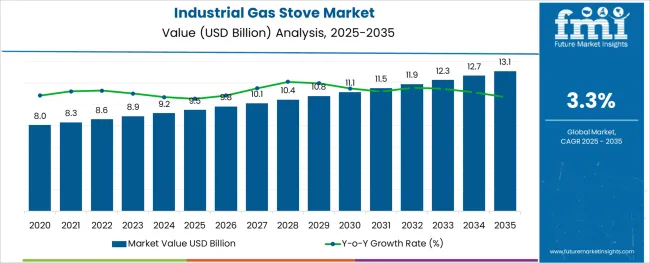
The industrial gas stove market is predicted to grow at a moderate CAGR of 3.3% during the forecast period covering 2023 to 2033. The industrial gas stove market share is estimated to reach a value of nearly USD 12.25 Billion by 2033 expanding from a total worth of USD 8.86 Billion in the current year 2023.

Industrial gas stoves have become a critical component of heavy industries that are designed to achieve the necessary temperature output and fire intensity. The demand for industrial gas stoves for supplying thermal energy in manufacturing operations has also surged in recent years with the growing consumerism around the world.

The global industrial gas stove market is expanding at a rapid pace as it minimizes air pollution levels and helps improve the quality of the air in the industrial environment by reducing emissions by avoiding the burning of solid fuels such as wood, coal, or dung cakes without ventilation or exhaust systems. These emissions have been connected to respiratory illnesses and making people aware of the safety and health benefits of an industrial cooking gas burner or stove is projected to be a key driver for the said market growth in the long run.

Thorough quality control checks for industrial gas stove and the oven is expected to push the producer to develop more efficient industrial burners and implement a proper testing system. In the United States, for example, the Environmental Protection Agency monitors industrial emission levels, related areas, and operational conditions through laws such as the (Boiler MACT) and the 'area source rule. The adoption of such developments in other countries is projected to drive the regional industrial gas stove markets further with better quality products and accountability.

Several initiatives by the governments of emerging economies to upgrade their industries with better equipment and technology for providing a better workplace to their citizens have accelerated the sales of industrial gas stoves in recent years. Moreover, the higher efficiency of such stoves has been recognized by the private players as a money saver making them incredibly desirable in the prominent industries requiring heat in the production process.

The most prevalent form of industrial stove burner available in the market is the cast-iron furnace head as these are typically formed of steel or cast iron that can resist high temperatures, making them an appropriate material for this use. They may also be readily formed into a variety of designs, such as circular flat disks that fit neatly with industrial stove tops, and triangular front-loading burners with indentation sides that distribute warmth uniformly while using all types of industrial gas ranges and so on. Because of its long-term durability and attractiveness, the copper furnace head is becoming increasingly popular for the manufacturing of industrial stoves with griddles.

Attributes Details
Industrial Gas Stove Market Share (2022) USD 8.57 Billion
Industrial Gas Stove Market Size Value (2023) USD 8.86 Billion
Industrial Gas Stove Market Size Value (2033) USD 12.25 Billion
Industrial Gas Stove Market Growth Rate (2022 to 2032) 3.3%

2018 to 2022 Global Industrial Gas Stove Sales Outlook Compared to Forecast from 2023 to 2033

In accordance with the previously released industrial gas stove market reports by the FMI, the product has gained traction in the present time with economic improvement and infrastructural development in both industrial and emerging economies. However, the overall growth rate of the market is slightly less than that of 3.5% which was recorded during the years covering 2018 to 2022.

During the years following the outbreak of the Covid-19 pandemic, several commercial difficulties aroused as a result of the global lockdown of commercial and industrial activities. The economic crises during this period in numerous regions resulted in a drop in sales of industrial gas stoves that is yet to be regained by the market players.

Key Drivers Accelerating the Growth of the Industrial Gas Stove Industry

Many major steel market players are shifting their focus to high-power industrial welding and metalworking solutions that could be instrumental in augmenting the industrial gas stove market key trends and opportunities.

While the designing of precise models for a perfect pace of gas and air for maintaining the stability of the discharged flame would be the major determining factor for the success of the industrial gas stove business from the suppliers' end.

Industrial Gas Stove Industry Analysis by Type, Burner Configuration, and End Use

Which Burner Type Segment is Best Performing for the Global Industrial Gas Stove Market?

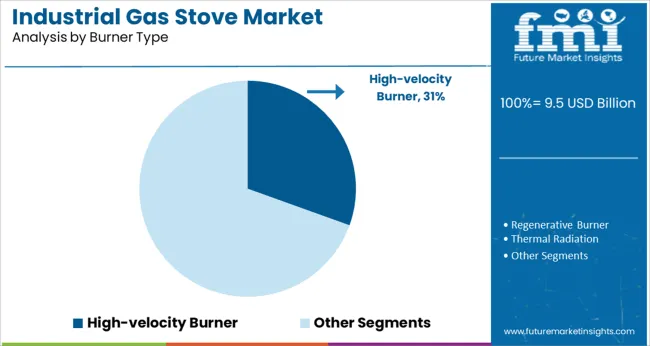
Regenerative burner heads are in high demand in the industrial gas stoves market growing at a rate of 3.3% as a result of their longer lifespan when compared to other segments such as flat flame burners or line burners. This segment’s rising use may also be ascribed to its efficient burning and corrosion resistance which make it a popular option among industrialists worldwide.

What are the Two Types of Industrial Gas Stoves Based on Fuel Type?

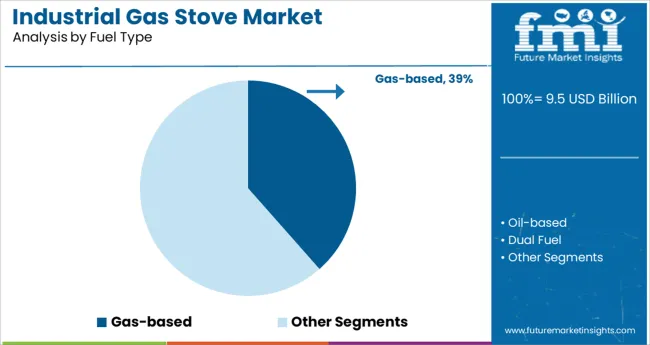
Traditionally, the industrial stoves for sale in the market are either gas-based or oil-based. However, in recent years the models having the capability to run on both fuels are highly preferred by the end users. So, in keeping with the figures available from the industrial gas stove market statistics report, his segment is expected to grow at a pace of 3.1% over the forecast years.
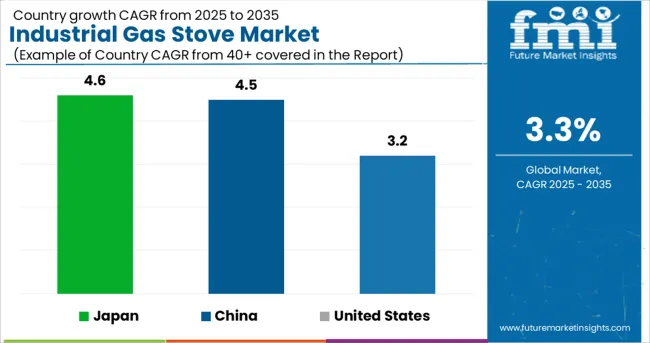
Top Countries Manufacturing, Supplying, and Using Industrial Gas Stoves

Why the United States is the Dominating Region for the Global Industrial Gas Stoves Market?
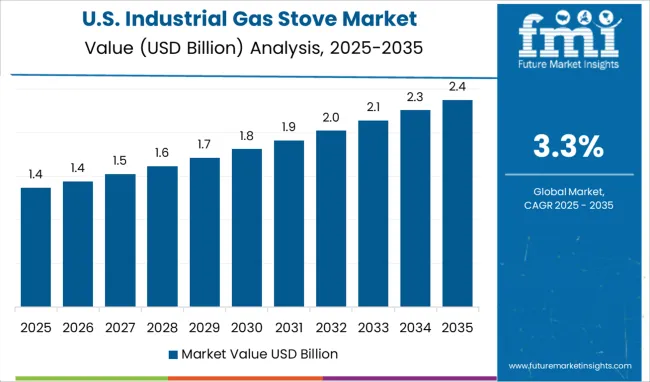
The United States industrial gas Stove market is the dominant market among all the geographical regions. As per the industrial gas stove market analysis report, the overall market is expected to cross the USD 3 Billion mark by the year 2033, by growing from the current market valuation of USD 2.25 Billion in 2021 at a CAGR of 3.2% through this period.

In terms of growth rate, the sales of industrial gas stoves and burners have increased in the country in recent years. This inference can be substantiated by the fact that the CAGR of the said market in the country alone was found to be 2.5% through the years 2018 to 2022. Due to the presence of most market players as well as end-user verticals, the United States is expected to continue its dominance in this industrial segment throughout the projection years.

Which are the Major Regional Countries Driving the Europe Industrial Gas Stove Market?

Given the level of industrialization in most of the European countries, this geographical region has remained very lucrative for most of the industrial equipment and tool manufacturers. Likewise, the growth trajectory for industrial gas stove manufacturers has remained immensely promising despite the shift of industrial and commercial centers to other regions of the world.

Major industrial economies such as Germany, the United Kingdom, France, and Spain are the forerunners in the manufacturing of industrial stoves for different industrial gas ranges.

The United Kingdom market for industrial gas stoves is expected to grow from USD 540 Million in 2023 to nearly USD 863 Million by the end of this forecast period in 2033, following an above-average CAGR of 4.8% during the forecast years. It is noteworthy to mention that the overall demand for industrial gas stoves in this country has remained always higher and the market grew even during the previous past decade at a rate of 3.9%.

How Japan is Outcompeting China in Sales of Industrial Gas Stoves?

According to the industrial gas stoves, market survey reports the net worth of the market in China is around USD 948 Million while USD 788 Million in Japan. However, the growth rate of overall sales and export of the industrial stove burner during the previous half-decade in Japan was nearly 4.6% in comparison to that of 4.5% in China.

By virtue of better trade relations between Japan with other importing countries such as Brazil, India, and others it has managed to acquire a larger market that could support this growth rate of 5.4% during the upcoming years as well. Japan is also trying to increase its export capacity of all industrial products by playing on the opportunity that emerged out of the ongoing trade war between China and the United States. So increased government support for the industrial gas stove manufacturers is predicted to take the overall market valuation up to USD 1.3 Billion by the end of 2033.

Why South Korea is emerging as a Promising Region for the Asia Pacific Industrial Gas Stove Market?

The overall market share of USD 345 Million makes South Korea the third highest market among all the Asia Pacific countries. In view of the fact that this country is rapidly growing as a manufacturing and export hub for all kinds of industrial and finished goods products in recent years, the demand for industrial gas stoves has also surged in support.

As specified by the industrial gas stoves market report by FMI, the country is to witness a year-on-year growth rate of 4.4% through the forecast years. Furthermore, the economic progress of South East Asian countries is expected to contribute to the strengthening of the South Korean industrial gas stoves market and help it to reach a net worth of USD 533 Million by the end of the forecast year.

Selas Heat and Euro-K GmbH Redefine the Conventional Industrial Gas Stove Landscape through Strategic Innovation

The growing variety of natural procedures for reducing carbon emissions has evolved into a prominent component in industrial economies. This growth is consistent with the increased demand for environmentally friendly fuel and multiple government initiatives.

Furthermore, the recent hike in fuel prices has produced a desire for more economical thermal sources for industries and households as well, paving the way for something like the industrial stove for home application.

New technological advancements, research efforts, and ongoing experimentation have been the primary drivers for the development of smart industrial gas stoves. For instance, the integration of sensors communicates an infinite number of monitoring capabilities and data, as well as immediate notification of functional conflicts that may compromise any product performance.

In January 2018, Selas Heat Technology Company released the Red-Ray high-intensity infrared industrial stove burner. The Red-Ray High-Intensity Infrared Burner delivers exceptional performance, reaching active temperatures in around 60 seconds and cooling down to the point of heating the paper within just 10 seconds.

The whole heat inside the lattice impacts the cell structure and has no open flames, resulting in a very low NOx footprint for industrial gas stoves.

The adoption of 3D printing technology by many industrial gas stove market key players is another major development that has made many products more complicated while also lowering production costs. The new 3D printing method creates industrial stove burners that discharge liquid and gas flames at near perfection.

Euro-K GmbH, a renowned manufacturer and supplier of energy conversion devices, has created compact technology burners to streamline fuel demand and give more adjustable effectiveness. The micro-burner provides fuel possibilities since the amplifier generates a fuel/air combination that can operate on both gas and fluid fuel.

Leading Manufacturers in the Industrial Gas Stove Industry

Asia Pacific countries are expected to witness the highest growth rate in demand and sales of industrial gas stoves during the projected years of analysis.

The emerging trends in the industrial gas stove market are being pushed by rising demand for high-quality industrial stove burners as the overall longevity of the whole product largely depends on it. So many manufacturers are recently striving to use better and novel materials for it.

The advent of industrial electric stoves has presented a major challenge for most of the traditional industrial gas stove market players as the prices of fossil fuels are surging day by day. Moreover, the easiness of using electric burners has rendered it popular to capture a significant portion of the industrial gas stove market share.

Many industrial gas stove manufacturers have also shifted away from the marketplace for better growth opportunities in this alternative product.

Top Companies Shaping the Industrial Gas Stove Market

  • ANDRITZ Group
  • Baltur S.p.A
  • Bloom Engineering
  • Wood Group PLC (Foster Wheeler AG)
  • Honeywell International Inc. (Maxon)
  • Limpsfield Combustion Engineering Ltd
  • Mitsubishi Hitachi Power Systems, Ltd (MHPS)
  • Oilon Group
  • Osaka Gas Co., Ltd
  • Selas Heat Technology Company
  • R.W. Beckett Corp
  • SAACKE GmbH
  • Industrial Combustion IC
  • Wesman Group
  • Striko Westofen
  • Forbes Marshall Pvt. Ltd.
  • QED Combustion
  • Alzeta Corporation
  • Alfa Therm Limited
  • Weishaupt
  • Enertech GmbH
  • Power Flame (Astec)
  • EOGB Energy Products Ltd.

Top Investment Segments in the Industrial Gas Stove Market

By Fuel Type:

  • Oil-based
  • Gas-based
  • Dual Fuel
  • Others

By Automation:

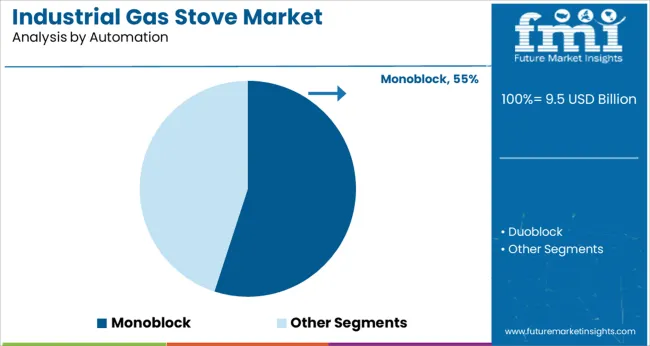
  • Monoblock
  • Duoblock

By Burner Type:

  • Regenerative Burner
  • High-velocity Burner
  • Thermal Radiation
  • Customized Burner
  • Flat flame Burner
  • Line Burner
  • Others

By Applications:

  • Boilers
  • Furnace/Oven/Kiln
  • Air Heating or Drying
  • Others

By Region:

  • North America
  • Latin America
  • Europe
  • Asia Pacific
  • Middle East and Africa (MEA)

Table of Content

  • 1. Executive Summary
  • 2. Market Overview
  • 3. Market Background
  • 4. Global Market Analysis 2018 to 2022 and Forecast, 2023 to 2033
  • 5. Global Market Analysis 2018 to 2022 and Forecast 2023 to 2033, By Fuel Type
    • 5.1. Oil-Based
    • 5.2. Gas-Based
    • 5.3. Duel Fuel
  • 6. Global Market Analysis 2018 to 2022 and Forecast 2023 to 2033, By Automation
    • 6.1. Monoblock
    • 6.2. Duoblock
  • 7. Global Market Analysis 2018 to 2022 and Forecast 2023 to 2033, By Burner Type
    • 7.1. Regenerative Burner
    • 7.2. High-velocity Burner
    • 7.3. Thermal Radiation Radient Burner
    • 7.4. Customized (Burner Boiler)
    • 7.5. Flat Flame Burner
    • 7.6. Line Burner
    • 7.7. Others
  • 8. Global Market Analysis 2018 to 2022 and Forecast 2023 to 2033, By Application
    • 8.1. Boilers
    • 8.2. Furnace/Ovens/Kiln
    • 8.3. Air Heating/Drying
    • 8.4. Others
  • 9. Global Market Analysis 2018 to 2022 and Forecast 2023 to 2033, By Region
    • 9.1. North America
    • 9.2. Latin America
    • 9.3. Europe
    • 9.4. East Asia
    • 9.5. South Asia
    • 9.6. Oceania
    • 9.7. Middle East and Africa (MEA)
  • 10. North America Market Analysis 2018 to 2022 and Forecast 2023 to 2033, By Country
  • 11. Latin America Market Analysis 2018 to 2022 and Forecast 2023 to 2033, By Country
  • 12. Europe Market Analysis 2018 to 2022 and Forecast 2023 to 2033, By Country
  • 13. East Asia Market Analysis 2018 to 2022 and Forecast 2023 to 2033, By Country
  • 14. South Asia Market Analysis 2018 to 2022 and Forecast 2023 to 2033, By Country
  • 15. Oceania Market Analysis 2018 to 2022 and Forecast 2023 to 2033, By Country
  • 16. MEA Market Analysis 2018 to 2022 and Forecast 2023 to 2033, By Country
  • 17. Key Countries Market Analysis
  • 18. Market Structure Analysis
  • 19. Competition Analysis
    • 19.1. ANDRITZ Group
    • 19.2. Baltur S.p.A
    • 19.3. Bloom Engineering
    • 19.4. Wood Group PLC (Foster Wheeler AG)
    • 19.5. Honeywell International Inc. (Maxon)
    • 19.6. Limpsfield Combustion Engineering Ltd
    • 19.7. Oilon Group
    • 19.8. Osaka Gas Co., Ltd
    • 19.9. Selas Heat Technology Company
    • 19.10. R.W. Beckett Corp
    • 19.11. SAACKE GmbH
    • 19.12. Industrial Combustion IC
    • 19.13. Wesman Group
    • 19.14. Alzeta Corporation
    • 19.15. Alfa Therm Limited
    • 19.16. Weishaupt
    • 19.17. Enertech GmbH
    • 19.18. Power Flame (Astec)
  • 20. Assumptions & Acronyms Used
  • 21. Research Methodology

List of Tables

Table 1: Global Market Value (US$ million) Forecast by Region, 2018 to 2033

Table 2: Global Market Volume (Units) Forecast by Region, 2018 to 2033

Table 3: Global Market Value (US$ million) Forecast by Fuel Type, 2018 to 2033

Table 4: Global Market Volume (Units) Forecast by Fuel Type, 2018 to 2033

Table 5: Global Market Value (US$ million) Forecast by Automation, 2018 to 2033

Table 6: Global Market Volume (Units) Forecast by Automation, 2018 to 2033

Table 7: Global Market Value (US$ million) Forecast by Burner Type, 2018 to 2033

Table 8: Global Market Volume (Units) Forecast by Burner Type, 2018 to 2033

Table 9: Global Market Value (US$ million) Forecast by By Application, 2018 to 2033

Table 10: Global Market Volume (Units) Forecast by By Application, 2018 to 2033

Table 11: North America Market Value (US$ million) Forecast by Country, 2018 to 2033

Table 12: North America Market Volume (Units) Forecast by Country, 2018 to 2033

Table 13: North America Market Value (US$ million) Forecast by Fuel Type, 2018 to 2033

Table 14: North America Market Volume (Units) Forecast by Fuel Type, 2018 to 2033

Table 15: North America Market Value (US$ million) Forecast by Automation, 2018 to 2033

Table 16: North America Market Volume (Units) Forecast by Automation, 2018 to 2033

Table 17: North America Market Value (US$ million) Forecast by Burner Type, 2018 to 2033

Table 18: North America Market Volume (Units) Forecast by Burner Type, 2018 to 2033

Table 19: North America Market Value (US$ million) Forecast by By Application, 2018 to 2033

Table 20: North America Market Volume (Units) Forecast by By Application, 2018 to 2033

Table 21: Latin America Market Value (US$ million) Forecast by Country, 2018 to 2033

Table 22: Latin America Market Volume (Units) Forecast by Country, 2018 to 2033

Table 23: Latin America Market Value (US$ million) Forecast by Fuel Type, 2018 to 2033

Table 24: Latin America Market Volume (Units) Forecast by Fuel Type, 2018 to 2033

Table 25: Latin America Market Value (US$ million) Forecast by Automation, 2018 to 2033

Table 26: Latin America Market Volume (Units) Forecast by Automation, 2018 to 2033

Table 27: Latin America Market Value (US$ million) Forecast by Burner Type, 2018 to 2033

Table 28: Latin America Market Volume (Units) Forecast by Burner Type, 2018 to 2033

Table 29: Latin America Market Value (US$ million) Forecast by By Application, 2018 to 2033

Table 30: Latin America Market Volume (Units) Forecast by By Application, 2018 to 2033

Table 31: Europe Market Value (US$ million) Forecast by Country, 2018 to 2033

Table 32: Europe Market Volume (Units) Forecast by Country, 2018 to 2033

Table 33: Europe Market Value (US$ million) Forecast by Fuel Type, 2018 to 2033

Table 34: Europe Market Volume (Units) Forecast by Fuel Type, 2018 to 2033

Table 35: Europe Market Value (US$ million) Forecast by Automation, 2018 to 2033

Table 36: Europe Market Volume (Units) Forecast by Automation, 2018 to 2033

Table 37: Europe Market Value (US$ million) Forecast by Burner Type, 2018 to 2033

Table 38: Europe Market Volume (Units) Forecast by Burner Type, 2018 to 2033

Table 39: Europe Market Value (US$ million) Forecast by By Application, 2018 to 2033

Table 40: Europe Market Volume (Units) Forecast by By Application, 2018 to 2033

Table 41: East Asia Market Value (US$ million) Forecast by Country, 2018 to 2033

Table 42: East Asia Market Volume (Units) Forecast by Country, 2018 to 2033

Table 43: East Asia Market Value (US$ million) Forecast by Fuel Type, 2018 to 2033

Table 44: East Asia Market Volume (Units) Forecast by Fuel Type, 2018 to 2033

Table 45: East Asia Market Value (US$ million) Forecast by Automation, 2018 to 2033

Table 46: East Asia Market Volume (Units) Forecast by Automation, 2018 to 2033

Table 47: East Asia Market Value (US$ million) Forecast by Burner Type, 2018 to 2033

Table 48: East Asia Market Volume (Units) Forecast by Burner Type, 2018 to 2033

Table 49: East Asia Market Value (US$ million) Forecast by By Application, 2018 to 2033

Table 50: East Asia Market Volume (Units) Forecast by By Application, 2018 to 2033

Table 51: South Asia Market Value (US$ million) Forecast by Country, 2018 to 2033

Table 52: South Asia Market Volume (Units) Forecast by Country, 2018 to 2033

Table 53: South Asia Market Value (US$ million) Forecast by Fuel Type, 2018 to 2033

Table 54: South Asia Market Volume (Units) Forecast by Fuel Type, 2018 to 2033

Table 55: South Asia Market Value (US$ million) Forecast by Automation, 2018 to 2033

Table 56: South Asia Market Volume (Units) Forecast by Automation, 2018 to 2033

Table 57: South Asia Market Value (US$ million) Forecast by Burner Type, 2018 to 2033

Table 58: South Asia Market Volume (Units) Forecast by Burner Type, 2018 to 2033

Table 59: South Asia Market Value (US$ million) Forecast by By Application, 2018 to 2033

Table 60: South Asia Market Volume (Units) Forecast by By Application, 2018 to 2033

Table 61: Oceania Market Value (US$ million) Forecast by Country, 2018 to 2033

Table 62: Oceania Market Volume (Units) Forecast by Country, 2018 to 2033

Table 63: Oceania Market Value (US$ million) Forecast by Fuel Type, 2018 to 2033

Table 64: Oceania Market Volume (Units) Forecast by Fuel Type, 2018 to 2033

Table 65: Oceania Market Value (US$ million) Forecast by Automation, 2018 to 2033

Table 66: Oceania Market Volume (Units) Forecast by Automation, 2018 to 2033

Table 67: Oceania Market Value (US$ million) Forecast by Burner Type, 2018 to 2033

Table 68: Oceania Market Volume (Units) Forecast by Burner Type, 2018 to 2033

Table 69: Oceania Market Value (US$ million) Forecast by By Application, 2018 to 2033

Table 70: Oceania Market Volume (Units) Forecast by By Application, 2018 to 2033

Table 71: MEA Market Value (US$ million) Forecast by Country, 2018 to 2033

Table 72: MEA Market Volume (Units) Forecast by Country, 2018 to 2033

Table 73: MEA Market Value (US$ million) Forecast by Fuel Type, 2018 to 2033

Table 74: MEA Market Volume (Units) Forecast by Fuel Type, 2018 to 2033

Table 75: MEA Market Value (US$ million) Forecast by Automation, 2018 to 2033

Table 76: MEA Market Volume (Units) Forecast by Automation, 2018 to 2033

Table 77: MEA Market Value (US$ million) Forecast by Burner Type, 2018 to 2033

Table 78: MEA Market Volume (Units) Forecast by Burner Type, 2018 to 2033

Table 79: MEA Market Value (US$ million) Forecast by By Application, 2018 to 2033

Table 80: MEA Market Volume (Units) Forecast by By Application, 2018 to 2033

List of Figures

Figure 1: Global Market Value (US$ million) by Fuel Type, 2023 to 2033

Figure 2: Global Market Value (US$ million) by Automation, 2023 to 2033

Figure 3: Global Market Value (US$ million) by Burner Type, 2023 to 2033

Figure 4: Global Market Value (US$ million) by By Application, 2023 to 2033

Figure 5: Global Market Value (US$ million) by Region, 2023 to 2033

Figure 6: Global Market Value (US$ million) Analysis by Region, 2018 to 2033

Figure 7: Global Market Volume (Units) Analysis by Region, 2018 to 2033

Figure 8: Global Market Value Share (%) and BPS Analysis by Region, 2023 to 2033

Figure 9: Global Market Y-o-Y Growth (%) Projections by Region, 2023 to 2033

Figure 10: Global Market Value (US$ million) Analysis by Fuel Type, 2018 to 2033

Figure 11: Global Market Volume (Units) Analysis by Fuel Type, 2018 to 2033

Figure 12: Global Market Value Share (%) and BPS Analysis by Fuel Type, 2023 to 2033

Figure 13: Global Market Y-o-Y Growth (%) Projections by Fuel Type, 2023 to 2033

Figure 14: Global Market Value (US$ million) Analysis by Automation, 2018 to 2033

Figure 15: Global Market Volume (Units) Analysis by Automation, 2018 to 2033

Figure 16: Global Market Value Share (%) and BPS Analysis by Automation, 2023 to 2033

Figure 17: Global Market Y-o-Y Growth (%) Projections by Automation, 2023 to 2033

Figure 18: Global Market Value (US$ million) Analysis by Burner Type, 2018 to 2033

Figure 19: Global Market Volume (Units) Analysis by Burner Type, 2018 to 2033

Figure 20: Global Market Value Share (%) and BPS Analysis by Burner Type, 2023 to 2033

Figure 21: Global Market Y-o-Y Growth (%) Projections by Burner Type, 2023 to 2033

Figure 22: Global Market Value (US$ million) Analysis by By Application, 2018 to 2033

Figure 23: Global Market Volume (Units) Analysis by By Application, 2018 to 2033

Figure 24: Global Market Value Share (%) and BPS Analysis by By Application, 2023 to 2033

Figure 25: Global Market Y-o-Y Growth (%) Projections by By Application, 2023 to 2033

Figure 26: Global Market Attractiveness by Fuel Type, 2023 to 2033

Figure 27: Global Market Attractiveness by Automation, 2023 to 2033

Figure 28: Global Market Attractiveness by Burner Type, 2023 to 2033

Figure 29: Global Market Attractiveness by By Application, 2023 to 2033

Figure 30: Global Market Attractiveness by Region, 2023 to 2033

Figure 31: North America Market Value (US$ million) by Fuel Type, 2023 to 2033

Figure 32: North America Market Value (US$ million) by Automation, 2023 to 2033

Figure 33: North America Market Value (US$ million) by Burner Type, 2023 to 2033

Figure 34: North America Market Value (US$ million) by By Application, 2023 to 2033

Figure 35: North America Market Value (US$ million) by Country, 2023 to 2033

Figure 36: North America Market Value (US$ million) Analysis by Country, 2018 to 2033

Figure 37: North America Market Volume (Units) Analysis by Country, 2018 to 2033

Figure 38: North America Market Value Share (%) and BPS Analysis by Country, 2023 to 2033

Figure 39: North America Market Y-o-Y Growth (%) Projections by Country, 2023 to 2033

Figure 40: North America Market Value (US$ million) Analysis by Fuel Type, 2018 to 2033

Figure 41: North America Market Volume (Units) Analysis by Fuel Type, 2018 to 2033

Figure 42: North America Market Value Share (%) and BPS Analysis by Fuel Type, 2023 to 2033

Figure 43: North America Market Y-o-Y Growth (%) Projections by Fuel Type, 2023 to 2033

Figure 44: North America Market Value (US$ million) Analysis by Automation, 2018 to 2033

Figure 45: North America Market Volume (Units) Analysis by Automation, 2018 to 2033

Figure 46: North America Market Value Share (%) and BPS Analysis by Automation, 2023 to 2033

Figure 47: North America Market Y-o-Y Growth (%) Projections by Automation, 2023 to 2033

Figure 48: North America Market Value (US$ million) Analysis by Burner Type, 2018 to 2033

Figure 49: North America Market Volume (Units) Analysis by Burner Type, 2018 to 2033

Figure 50: North America Market Value Share (%) and BPS Analysis by Burner Type, 2023 to 2033

Figure 51: North America Market Y-o-Y Growth (%) Projections by Burner Type, 2023 to 2033

Figure 52: North America Market Value (US$ million) Analysis by By Application, 2018 to 2033

Figure 53: North America Market Volume (Units) Analysis by By Application, 2018 to 2033

Figure 54: North America Market Value Share (%) and BPS Analysis by By Application, 2023 to 2033

Figure 55: North America Market Y-o-Y Growth (%) Projections by By Application, 2023 to 2033

Figure 56: North America Market Attractiveness by Fuel Type, 2023 to 2033

Figure 57: North America Market Attractiveness by Automation, 2023 to 2033

Figure 58: North America Market Attractiveness by Burner Type, 2023 to 2033

Figure 59: North America Market Attractiveness by By Application, 2023 to 2033

Figure 60: North America Market Attractiveness by Country, 2023 to 2033

Figure 61: Latin America Market Value (US$ million) by Fuel Type, 2023 to 2033

Figure 62: Latin America Market Value (US$ million) by Automation, 2023 to 2033

Figure 63: Latin America Market Value (US$ million) by Burner Type, 2023 to 2033

Figure 64: Latin America Market Value (US$ million) by By Application, 2023 to 2033

Figure 65: Latin America Market Value (US$ million) by Country, 2023 to 2033

Figure 66: Latin America Market Value (US$ million) Analysis by Country, 2018 to 2033

Figure 67: Latin America Market Volume (Units) Analysis by Country, 2018 to 2033

Figure 68: Latin America Market Value Share (%) and BPS Analysis by Country, 2023 to 2033

Figure 69: Latin America Market Y-o-Y Growth (%) Projections by Country, 2023 to 2033

Figure 70: Latin America Market Value (US$ million) Analysis by Fuel Type, 2018 to 2033

Figure 71: Latin America Market Volume (Units) Analysis by Fuel Type, 2018 to 2033

Figure 72: Latin America Market Value Share (%) and BPS Analysis by Fuel Type, 2023 to 2033

Figure 73: Latin America Market Y-o-Y Growth (%) Projections by Fuel Type, 2023 to 2033

Figure 74: Latin America Market Value (US$ million) Analysis by Automation, 2018 to 2033

Figure 75: Latin America Market Volume (Units) Analysis by Automation, 2018 to 2033

Figure 76: Latin America Market Value Share (%) and BPS Analysis by Automation, 2023 to 2033

Figure 77: Latin America Market Y-o-Y Growth (%) Projections by Automation, 2023 to 2033

Figure 78: Latin America Market Value (US$ million) Analysis by Burner Type, 2018 to 2033

Figure 79: Latin America Market Volume (Units) Analysis by Burner Type, 2018 to 2033

Figure 80: Latin America Market Value Share (%) and BPS Analysis by Burner Type, 2023 to 2033

Figure 81: Latin America Market Y-o-Y Growth (%) Projections by Burner Type, 2023 to 2033

Figure 82: Latin America Market Value (US$ million) Analysis by By Application, 2018 to 2033

Figure 83: Latin America Market Volume (Units) Analysis by By Application, 2018 to 2033

Figure 84: Latin America Market Value Share (%) and BPS Analysis by By Application, 2023 to 2033

Figure 85: Latin America Market Y-o-Y Growth (%) Projections by By Application, 2023 to 2033

Figure 86: Latin America Market Attractiveness by Fuel Type, 2023 to 2033

Figure 87: Latin America Market Attractiveness by Automation, 2023 to 2033

Figure 88: Latin America Market Attractiveness by Burner Type, 2023 to 2033

Figure 89: Latin America Market Attractiveness by By Application, 2023 to 2033

Figure 90: Latin America Market Attractiveness by Country, 2023 to 2033

Figure 91: Europe Market Value (US$ million) by Fuel Type, 2023 to 2033

Figure 92: Europe Market Value (US$ million) by Automation, 2023 to 2033

Figure 93: Europe Market Value (US$ million) by Burner Type, 2023 to 2033

Figure 94: Europe Market Value (US$ million) by By Application, 2023 to 2033

Figure 95: Europe Market Value (US$ million) by Country, 2023 to 2033

Figure 96: Europe Market Value (US$ million) Analysis by Country, 2018 to 2033

Figure 97: Europe Market Volume (Units) Analysis by Country, 2018 to 2033

Figure 98: Europe Market Value Share (%) and BPS Analysis by Country, 2023 to 2033

Figure 99: Europe Market Y-o-Y Growth (%) Projections by Country, 2023 to 2033

Figure 100: Europe Market Value (US$ million) Analysis by Fuel Type, 2018 to 2033

Figure 101: Europe Market Volume (Units) Analysis by Fuel Type, 2018 to 2033

Figure 102: Europe Market Value Share (%) and BPS Analysis by Fuel Type, 2023 to 2033

Figure 103: Europe Market Y-o-Y Growth (%) Projections by Fuel Type, 2023 to 2033

Figure 104: Europe Market Value (US$ million) Analysis by Automation, 2018 to 2033

Figure 105: Europe Market Volume (Units) Analysis by Automation, 2018 to 2033

Figure 106: Europe Market Value Share (%) and BPS Analysis by Automation, 2023 to 2033

Figure 107: Europe Market Y-o-Y Growth (%) Projections by Automation, 2023 to 2033

Figure 108: Europe Market Value (US$ million) Analysis by Burner Type, 2018 to 2033

Figure 109: Europe Market Volume (Units) Analysis by Burner Type, 2018 to 2033

Figure 110: Europe Market Value Share (%) and BPS Analysis by Burner Type, 2023 to 2033

Figure 111: Europe Market Y-o-Y Growth (%) Projections by Burner Type, 2023 to 2033

Figure 112: Europe Market Value (US$ million) Analysis by By Application, 2018 to 2033

Figure 113: Europe Market Volume (Units) Analysis by By Application, 2018 to 2033

Figure 114: Europe Market Value Share (%) and BPS Analysis by By Application, 2023 to 2033

Figure 115: Europe Market Y-o-Y Growth (%) Projections by By Application, 2023 to 2033

Figure 116: Europe Market Attractiveness by Fuel Type, 2023 to 2033

Figure 117: Europe Market Attractiveness by Automation, 2023 to 2033

Figure 118: Europe Market Attractiveness by Burner Type, 2023 to 2033

Figure 119: Europe Market Attractiveness by By Application, 2023 to 2033

Figure 120: Europe Market Attractiveness by Country, 2023 to 2033

Figure 121: East Asia Market Value (US$ million) by Fuel Type, 2023 to 2033

Figure 122: East Asia Market Value (US$ million) by Automation, 2023 to 2033

Figure 123: East Asia Market Value (US$ million) by Burner Type, 2023 to 2033

Figure 124: East Asia Market Value (US$ million) by By Application, 2023 to 2033

Figure 125: East Asia Market Value (US$ million) by Country, 2023 to 2033

Figure 126: East Asia Market Value (US$ million) Analysis by Country, 2018 to 2033

Figure 127: East Asia Market Volume (Units) Analysis by Country, 2018 to 2033

Figure 128: East Asia Market Value Share (%) and BPS Analysis by Country, 2023 to 2033

Figure 129: East Asia Market Y-o-Y Growth (%) Projections by Country, 2023 to 2033

Figure 130: East Asia Market Value (US$ million) Analysis by Fuel Type, 2018 to 2033

Figure 131: East Asia Market Volume (Units) Analysis by Fuel Type, 2018 to 2033

Figure 132: East Asia Market Value Share (%) and BPS Analysis by Fuel Type, 2023 to 2033

Figure 133: East Asia Market Y-o-Y Growth (%) Projections by Fuel Type, 2023 to 2033

Figure 134: East Asia Market Value (US$ million) Analysis by Automation, 2018 to 2033

Figure 135: East Asia Market Volume (Units) Analysis by Automation, 2018 to 2033

Figure 136: East Asia Market Value Share (%) and BPS Analysis by Automation, 2023 to 2033

Figure 137: East Asia Market Y-o-Y Growth (%) Projections by Automation, 2023 to 2033

Figure 138: East Asia Market Value (US$ million) Analysis by Burner Type, 2018 to 2033

Figure 139: East Asia Market Volume (Units) Analysis by Burner Type, 2018 to 2033

Figure 140: East Asia Market Value Share (%) and BPS Analysis by Burner Type, 2023 to 2033

Figure 141: East Asia Market Y-o-Y Growth (%) Projections by Burner Type, 2023 to 2033

Figure 142: East Asia Market Value (US$ million) Analysis by By Application, 2018 to 2033

Figure 143: East Asia Market Volume (Units) Analysis by By Application, 2018 to 2033

Figure 144: East Asia Market Value Share (%) and BPS Analysis by By Application, 2023 to 2033

Figure 145: East Asia Market Y-o-Y Growth (%) Projections by By Application, 2023 to 2033

Figure 146: East Asia Market Attractiveness by Fuel Type, 2023 to 2033

Figure 147: East Asia Market Attractiveness by Automation, 2023 to 2033

Figure 148: East Asia Market Attractiveness by Burner Type, 2023 to 2033

Figure 149: East Asia Market Attractiveness by By Application, 2023 to 2033

Figure 150: East Asia Market Attractiveness by Country, 2023 to 2033

Figure 151: South Asia Market Value (US$ million) by Fuel Type, 2023 to 2033

Figure 152: South Asia Market Value (US$ million) by Automation, 2023 to 2033

Figure 153: South Asia Market Value (US$ million) by Burner Type, 2023 to 2033

Figure 154: South Asia Market Value (US$ million) by By Application, 2023 to 2033

Figure 155: South Asia Market Value (US$ million) by Country, 2023 to 2033

Figure 156: South Asia Market Value (US$ million) Analysis by Country, 2018 to 2033

Figure 157: South Asia Market Volume (Units) Analysis by Country, 2018 to 2033

Figure 158: South Asia Market Value Share (%) and BPS Analysis by Country, 2023 to 2033

Figure 159: South Asia Market Y-o-Y Growth (%) Projections by Country, 2023 to 2033

Figure 160: South Asia Market Value (US$ million) Analysis by Fuel Type, 2018 to 2033

Figure 161: South Asia Market Volume (Units) Analysis by Fuel Type, 2018 to 2033

Figure 162: South Asia Market Value Share (%) and BPS Analysis by Fuel Type, 2023 to 2033

Figure 163: South Asia Market Y-o-Y Growth (%) Projections by Fuel Type, 2023 to 2033

Figure 164: South Asia Market Value (US$ million) Analysis by Automation, 2018 to 2033

Figure 165: South Asia Market Volume (Units) Analysis by Automation, 2018 to 2033

Figure 166: South Asia Market Value Share (%) and BPS Analysis by Automation, 2023 to 2033

Figure 167: South Asia Market Y-o-Y Growth (%) Projections by Automation, 2023 to 2033

Figure 168: South Asia Market Value (US$ million) Analysis by Burner Type, 2018 to 2033

Figure 169: South Asia Market Volume (Units) Analysis by Burner Type, 2018 to 2033

Figure 170: South Asia Market Value Share (%) and BPS Analysis by Burner Type, 2023 to 2033

Figure 171: South Asia Market Y-o-Y Growth (%) Projections by Burner Type, 2023 to 2033

Figure 172: South Asia Market Value (US$ million) Analysis by By Application, 2018 to 2033

Figure 173: South Asia Market Volume (Units) Analysis by By Application, 2018 to 2033

Figure 174: South Asia Market Value Share (%) and BPS Analysis by By Application, 2023 to 2033

Figure 175: South Asia Market Y-o-Y Growth (%) Projections by By Application, 2023 to 2033

Figure 176: South Asia Market Attractiveness by Fuel Type, 2023 to 2033

Figure 177: South Asia Market Attractiveness by Automation, 2023 to 2033

Figure 178: South Asia Market Attractiveness by Burner Type, 2023 to 2033

Figure 179: South Asia Market Attractiveness by By Application, 2023 to 2033

Figure 180: South Asia Market Attractiveness by Country, 2023 to 2033

Figure 181: Oceania Market Value (US$ million) by Fuel Type, 2023 to 2033

Figure 182: Oceania Market Value (US$ million) by Automation, 2023 to 2033

Figure 183: Oceania Market Value (US$ million) by Burner Type, 2023 to 2033

Figure 184: Oceania Market Value (US$ million) by By Application, 2023 to 2033

Figure 185: Oceania Market Value (US$ million) by Country, 2023 to 2033

Figure 186: Oceania Market Value (US$ million) Analysis by Country, 2018 to 2033

Figure 187: Oceania Market Volume (Units) Analysis by Country, 2018 to 2033

Figure 188: Oceania Market Value Share (%) and BPS Analysis by Country, 2023 to 2033

Figure 189: Oceania Market Y-o-Y Growth (%) Projections by Country, 2023 to 2033

Figure 190: Oceania Market Value (US$ million) Analysis by Fuel Type, 2018 to 2033

Figure 191: Oceania Market Volume (Units) Analysis by Fuel Type, 2018 to 2033

Figure 192: Oceania Market Value Share (%) and BPS Analysis by Fuel Type, 2023 to 2033

Figure 193: Oceania Market Y-o-Y Growth (%) Projections by Fuel Type, 2023 to 2033

Figure 194: Oceania Market Value (US$ million) Analysis by Automation, 2018 to 2033

Figure 195: Oceania Market Volume (Units) Analysis by Automation, 2018 to 2033

Figure 196: Oceania Market Value Share (%) and BPS Analysis by Automation, 2023 to 2033

Figure 197: Oceania Market Y-o-Y Growth (%) Projections by Automation, 2023 to 2033

Figure 198: Oceania Market Value (US$ million) Analysis by Burner Type, 2018 to 2033

Figure 199: Oceania Market Volume (Units) Analysis by Burner Type, 2018 to 2033

Figure 200: Oceania Market Value Share (%) and BPS Analysis by Burner Type, 2023 to 2033

Figure 201: Oceania Market Y-o-Y Growth (%) Projections by Burner Type, 2023 to 2033

Figure 202: Oceania Market Value (US$ million) Analysis by By Application, 2018 to 2033

Figure 203: Oceania Market Volume (Units) Analysis by By Application, 2018 to 2033

Figure 204: Oceania Market Value Share (%) and BPS Analysis by By Application, 2023 to 2033

Figure 205: Oceania Market Y-o-Y Growth (%) Projections by By Application, 2023 to 2033

Figure 206: Oceania Market Attractiveness by Fuel Type, 2023 to 2033

Figure 207: Oceania Market Attractiveness by Automation, 2023 to 2033

Figure 208: Oceania Market Attractiveness by Burner Type, 2023 to 2033

Figure 209: Oceania Market Attractiveness by By Application, 2023 to 2033

Figure 210: Oceania Market Attractiveness by Country, 2023 to 2033

Figure 211: MEA Market Value (US$ million) by Fuel Type, 2023 to 2033

Figure 212: MEA Market Value (US$ million) by Automation, 2023 to 2033

Figure 213: MEA Market Value (US$ million) by Burner Type, 2023 to 2033

Figure 214: MEA Market Value (US$ million) by By Application, 2023 to 2033

Figure 215: MEA Market Value (US$ million) by Country, 2023 to 2033

Figure 216: MEA Market Value (US$ million) Analysis by Country, 2018 to 2033

Figure 217: MEA Market Volume (Units) Analysis by Country, 2018 to 2033

Figure 218: MEA Market Value Share (%) and BPS Analysis by Country, 2023 to 2033

Figure 219: MEA Market Y-o-Y Growth (%) Projections by Country, 2023 to 2033

Figure 220: MEA Market Value (US$ million) Analysis by Fuel Type, 2018 to 2033

Figure 221: MEA Market Volume (Units) Analysis by Fuel Type, 2018 to 2033

Figure 222: MEA Market Value Share (%) and BPS Analysis by Fuel Type, 2023 to 2033

Figure 223: MEA Market Y-o-Y Growth (%) Projections by Fuel Type, 2023 to 2033

Figure 224: MEA Market Value (US$ million) Analysis by Automation, 2018 to 2033

Figure 225: MEA Market Volume (Units) Analysis by Automation, 2018 to 2033

Figure 226: MEA Market Value Share (%) and BPS Analysis by Automation, 2023 to 2033

Figure 227: MEA Market Y-o-Y Growth (%) Projections by Automation, 2023 to 2033

Figure 228: MEA Market Value (US$ million) Analysis by Burner Type, 2018 to 2033

Figure 229: MEA Market Volume (Units) Analysis by Burner Type, 2018 to 2033

Figure 230: MEA Market Value Share (%) and BPS Analysis by Burner Type, 2023 to 2033

Figure 231: MEA Market Y-o-Y Growth (%) Projections by Burner Type, 2023 to 2033

Figure 232: MEA Market Value (US$ million) Analysis by By Application, 2018 to 2033

Figure 233: MEA Market Volume (Units) Analysis by By Application, 2018 to 2033

Figure 234: MEA Market Value Share (%) and BPS Analysis by By Application, 2023 to 2033

Figure 235: MEA Market Y-o-Y Growth (%) Projections by By Application, 2023 to 2033

Figure 236: MEA Market Attractiveness by Fuel Type, 2023 to 2033

Figure 237: MEA Market Attractiveness by Automation, 2023 to 2033

Figure 238: MEA Market Attractiveness by Burner Type, 2023 to 2033

Figure 239: MEA Market Attractiveness by By Application, 2023 to 2033

Figure 240: MEA Market Attractiveness by Country, 2023 to 2033

Frequently Asked Questions

What is the Growth Outlook of the Industrial Gas Stove Market?

The global industrial gas stove market is to grow at 3.3% during the forecast period.

What is the projected Value of Industrial Gas Stove Market By 2032?

The global industrial gas stove market is predicted to be valued at USD 12.25 Billion by 2032.

What was the Historical Size of the Industrial Gas Stove Market?

The global industrial gas stove market was valued at USD 8.57 Billion in 2022.

Which Country is the largest Dominant Share Holder in the Industrial Gas Stove Market?

The USA accounts for the largest revenue share of USD 2.26 Billion in the year 2023.

Which Region has the Highest Growth Potential in the Industrial Gas Stove Market?

Asia Pacific is predicted to witness the highest CAGR in the industrial gas stove market.

Explore Similar Insights

Future Market Insights

Industrial Gas Stove Market