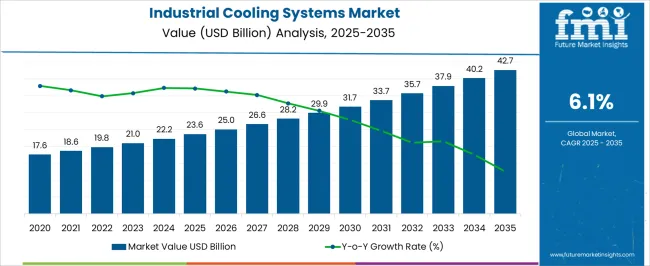
The Industrial Cooling Systems Market is estimated to be valued at USD 23.6 billion in 2025 and is projected to reach USD 42.7 billion by 2035, registering a compound annual growth rate (CAGR) of 6.1% over the forecast period.
| Metric | Value |
|---|---|
| Industrial Cooling Systems Market Estimated Value in (2025 E) | USD 23.6 billion |
| Industrial Cooling Systems Market Forecast Value in (2035 F) | USD 42.7 billion |
| Forecast CAGR (2025 to 2035) | 6.1% |
The industrial cooling systems market is experiencing steady advancement due to increasing thermal management requirements across heavy industries, expanding energy production capacities, and rising demand for sustainable cooling solutions. As global energy efficiency norms grow stricter, industries are prioritizing cooling technologies that minimize water usage, lower carbon emissions, and support continuous operations in high heat environments.
The shift toward renewable energy installations, combined with elevated heat loads in data centers and process industries, is further intensifying demand for robust and efficient cooling infrastructure. Developments in hybrid technologies, smart monitoring, and environmentally responsible refrigerants are reshaping system design and deployment.
The outlook remains positive, particularly as utility and manufacturing sectors aim to align with net zero goals, optimize resource usage, and reduce operational downtime through resilient and cost effective cooling architectures.
The market is segmented by Product Type, Function, and End-User and region. By Product Type, the market is divided into Hybrid Cooling, Water Cooling, Air Cooling, and Evaporative Cooling. In terms of Function, the market is classified into Transport Cooling and Stationary Cooling. Based on End-User, the market is segmented into Utility and Power, Chemical, Food & Beverage, Pharmaceutical, Oil and Gas, and Others. Regionally, the market is classified into North America, Latin America, Western Europe, Eastern Europe, Balkan & Baltic Countries, Russia & Belarus, Central Asia, East Asia, South Asia & Pacific, and the Middle East & Africa.
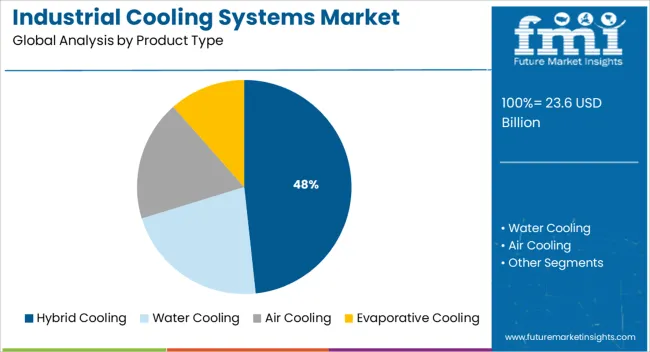
The hybrid cooling segment is expected to account for 48.30% of total market revenue by 2025 under the product type category, making it the leading product variant. This dominance is a result of its ability to offer a balanced approach between water conservation and energy efficiency.
Hybrid cooling systems integrate the advantages of both dry and wet cooling, allowing adaptability across varying climate conditions and industrial applications. These systems are increasingly preferred in regions facing water scarcity, as they reduce water consumption without sacrificing thermal performance.
Additionally, the capacity to operate in multiple cooling modes enhances system flexibility and reduces total lifecycle cost. With industries seeking to future proof operations and comply with environmental regulations, hybrid cooling systems continue to gain traction as the optimal product choice.
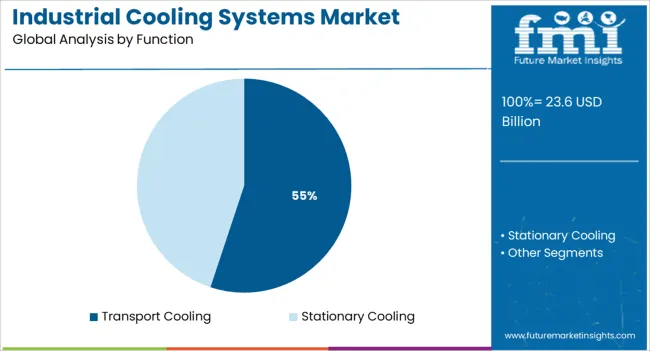
The transport cooling segment is projected to contribute 55.10% of overall market revenue within the function category by 2025, positioning it as the most dominant functional application. This growth is being driven by the rise in industrial logistics, cross border trade of temperature sensitive goods, and growing demand for cold chain integrity across pharmaceuticals, chemicals, and perishable foods.
Transport cooling systems ensure consistent thermal conditions throughout the supply chain, reducing spoilage and maintaining compliance with international safety standards. Innovations in lightweight, energy efficient transport coolers and integration with smart tracking technologies are supporting their adoption.
As global supply chains expand and require more reliable thermal management, transport cooling remains essential to logistics and trade continuity, cementing its leading role in the functional segment.
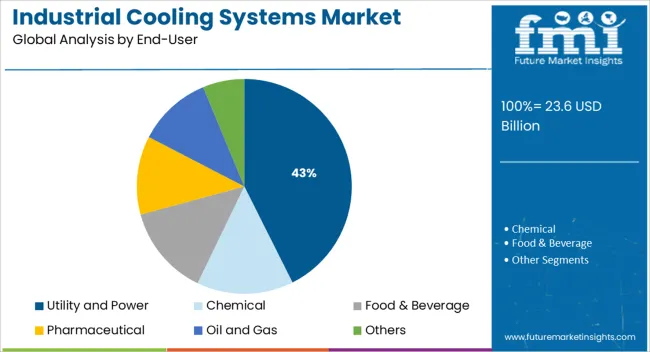
The utility and power segment is expected to hold 42.60% of total market revenue by 2025 under the end use category, making it the foremost contributor. This growth is attributed to increasing electricity generation demands, particularly from thermoelectric plants, where efficient heat dissipation is critical to maintaining output and equipment longevity.
Cooling systems in power generation facilities help regulate turbine and condenser temperatures, enhance cycle efficiency, and prevent operational failures. The global transition toward cleaner energy sources such as gas and renewables still requires advanced cooling infrastructure to manage process heat.
With large scale projects driving infrastructure upgrades, the utility and power sector continues to invest in high performance cooling systems, ensuring its dominant share in the market based on operational necessity and environmental performance expectations.
Manufacturers recognized a lot of potential in the market as a result of an increase in demand for industrial cooling systems from numerous industries, including the food and beverage, chemical, and pharmaceutical sectors.
The market for industrial cooling systems increased from USD 17.6 billion in 2020 to USD 23.6 billion in 2025, with a CAGR of 5.5% between 2020 and 2024.
A major factor propelling the market expansion includes the rising adoption of industrial cooling systems in the power and energy sectors, the increased emphasis on the use of green technologies, and the adoption of Industrial Internet of Things (IIoT) solutions.
Short Term (2025 to 2029): The vehicle industry is concentrating on replacing outdated cooling systems through various imaginative and technical advancements, as well as ongoing cooling system enhancements.
Medium Term (2029 to 2035):The petrochemical processing industry is anticipated to expand gradually during the projection period as a result of the rise in fuel oil consumption for large commercial vehicles.
Long term (2035 to 2035): It is projected that as industrial users become more aware of the benefits of temperature control systems, demand for industrial cooling systems is likely to rise.
During the forecast period, the global industrial cooling system market is anticipated to grow from USD 23.6 billion in 2025 to USD 42.7 billion by 2035, with a CAGR of 6.1%.
The demand for industrial cooling systems faces significant challenges, since industrial cooling systems are pricey and have high installation and maintenance costs. The greater operating expenses caused by improper infrastructure for industrial cooling system installation and operation.
Moreover, due to their high CO2 emissions, industrial cooling systems have a substantial negative influence on the environment. Industrial cooling systems' limited technological capabilities make it difficult for the market share to advance.
Evaporative cooling systems dominated the market by product type in 2024. Compared to refrigerated systems, they are more efficient and valuable economically. This segment holds 35% share of the industrial cooling system market.
However, the air-cooling category is predicted to develop at the highest CAGR of 6.50% over the forecast period due to rising government efforts in emerging nations like India and an increase in demand for industrial air-cooling systems.
The transport cooling segment is anticipated to experience the highest CAGR of 5.9% over the projection period, due to the expansion of the food processing industry and the requirement for strict temperature control when transporting pharmaceutical and biopharmaceutical items.
In 2024, more than 2/3rd of the market share for industrial cooling systems was accounted for by the stationary cooling segment, which continued to hold the majority of the market. To create a productive manufacturing system and take advantage of the cost and efficiency benefits, the automotive industry uses top-notch cooling equipment.
Moreover, the development of several innovative and technological innovations, along with ongoing cooling system improvements, is being encouraged to replace the outdated cooling systems in the automotive industry.
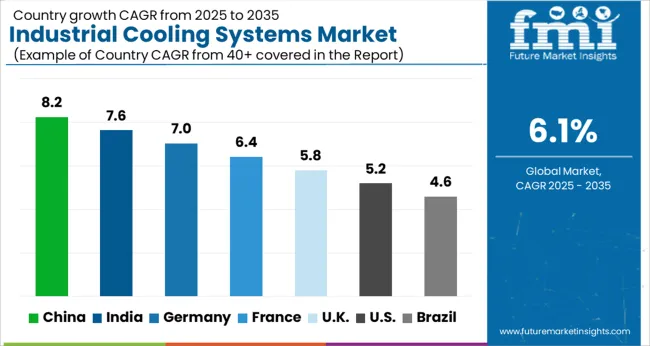
USA market players are significantly contributing to the demand for industrial cooling systems, with a CAGR of 5.9% during the forecast period.
During the projection period, it is predicted that the North American market for industrial cooling systems is likely to grow at a CAGR of more than 6%. The opportunities in the industrial cooling systems industry are expanding in North America as a result of rising processed food and beverage demand, as well as the existence of numerous important manufacturing sectors.
Additionally, growing demand from the commercial and residential sectors promotes long-lasting industrial cooling systems market trends.
China Outlook
China currently has one of the world's fastest expanding markets for industrial cooling systems. From 2025 to 2035, this market is anticipated to expand at a CAGR of 8.5%.
In order to encourage the use of energy-efficient technology, the Chinese government has developed a number of programs.
One of these programs is the "Energy Efficiency Network," which provides incentives and subsidies to companies that purchase energy-efficient cooling systems.
Korea Outlook
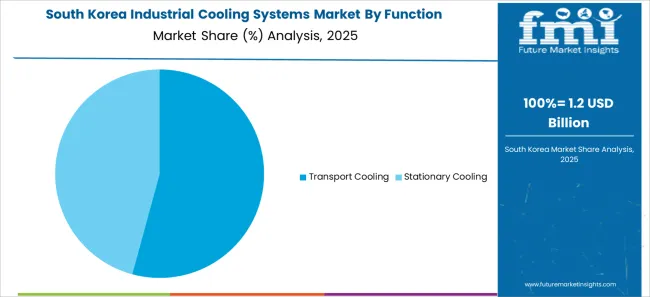
In Korea, the market for industrial cooling systems is anticipated to grow at a 6.1% CAGR from 2025 to 2035. The market is propelled by rising adoption of sophisticated cooling solutions, and rising cooling system demand from the food and beverage and data center sectors.
In addition, the government's increasing investments in renewable energy sources and the growing usage of IoT-enabled cooling systems are anticipated to assist the expansion of the industrial cooling system market in Korea by 2035.
Japan Outlook
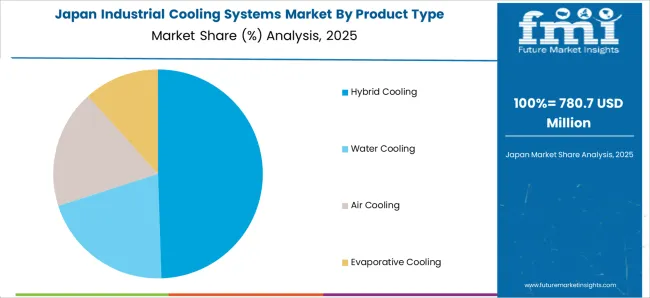
The market in Japan was projected to be worth 22.2 billion in 2024, per the FMI industrial cooling systems market report. By 2025, this amount is anticipated to rise to 444.7 billion, indicating a 2.1% CAGR.
Additionally, Japan's industrial cooling system market was the second-largest in Asia Pacific in terms of market size, after China. In 2024, it represented 18.5% of the overall market. The major key players in the Japanese market include Mitsubishi Heavy Industries, Air Water, Daikin Industries, Epson, and Mitsubishi Electric.
In the UK, the adoption of industrial cooling systems is rising quickly. In 2024, its value was USD 42.7 billion. The UK anticipated to expand at a CAGR of 5.7% during the projected period, and expected to be worth USD 5.55 billion by 2035.
The UK market for industrial cooling systems is anticipated to benefit from the government's efforts to reduce carbon emissions and promote the use of renewable energy sources.
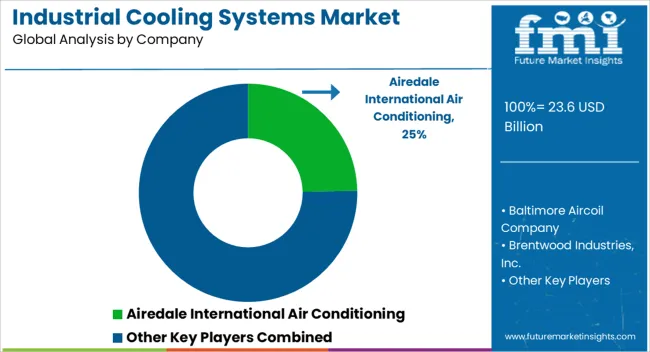
The market for industrial cooling systems is fiercely competitive, with many well-known companies contending for market dominance. To obtain a competitive advantage in the market, these businesses are putting their efforts into creating cutting-edge, energy-efficient products.
Additionally, the industry is seeing the entry of numerous new players, including Enertech Industries, LLC and Cooling Systems, Inc., who are providing their clients with specialized and tailored cooling solutions.
To expand their product offerings, these businesses are investing in R&D to create new products and technology. In order to increase their market penetration, firms are also concentrating on strategic alliances and collaborations.
The participants engage in joint ventures, mergers, and other strategic alliances to increase their market share and diversify their clientele. To differentiate their products and keep customers loyal, businesses often concentrate on enhancing their post-sale services, such as customer support and maintenance services.
Recent Competitive Strategies
The global industrial cooling systems market is estimated to be valued at USD 23.6 billion in 2025.
The market size for the industrial cooling systems market is projected to reach USD 42.7 billion by 2035.
The industrial cooling systems market is expected to grow at a 6.1% CAGR between 2025 and 2035.
The key product types in industrial cooling systems market are hybrid cooling, water cooling, air cooling and evaporative cooling.
In terms of function, transport cooling segment to command 55.1% share in the industrial cooling systems market in 2025.


Our Research Products

The "Full Research Suite" delivers actionable market intel, deep dives on markets or technologies, so clients act faster, cut risk, and unlock growth.

The Leaderboard benchmarks and ranks top vendors, classifying them as Established Leaders, Leading Challengers, or Disruptors & Challengers.

Locates where complements amplify value and substitutes erode it, forecasting net impact by horizon

We deliver granular, decision-grade intel: market sizing, 5-year forecasts, pricing, adoption, usage, revenue, and operational KPIs—plus competitor tracking, regulation, and value chains—across 60 countries broadly.

Spot the shifts before they hit your P&L. We track inflection points, adoption curves, pricing moves, and ecosystem plays to show where demand is heading, why it is changing, and what to do next across high-growth markets and disruptive tech

Real-time reads of user behavior. We track shifting priorities, perceptions of today’s and next-gen services, and provider experience, then pace how fast tech moves from trial to adoption, blending buyer, consumer, and channel inputs with social signals (#WhySwitch, #UX).

Partner with our analyst team to build a custom report designed around your business priorities. From analysing market trends to assessing competitors or crafting bespoke datasets, we tailor insights to your needs.
Supplier Intelligence
Discovery & Profiling
Capacity & Footprint
Performance & Risk
Compliance & Governance
Commercial Readiness
Who Supplies Whom
Scorecards & Shortlists
Playbooks & Docs
Category Intelligence
Definition & Scope
Demand & Use Cases
Cost Drivers
Market Structure
Supply Chain Map
Trade & Policy
Operating Norms
Deliverables
Buyer Intelligence
Account Basics
Spend & Scope
Procurement Model
Vendor Requirements
Terms & Policies
Entry Strategy
Pain Points & Triggers
Outputs
Pricing Analysis
Benchmarks
Trends
Should-Cost
Indexation
Landed Cost
Commercial Terms
Deliverables
Brand Analysis
Positioning & Value Prop
Share & Presence
Customer Evidence
Go-to-Market
Digital & Reputation
Compliance & Trust
KPIs & Gaps
Outputs
Full Research Suite comprises of:
Market outlook & trends analysis
Interviews & case studies
Strategic recommendations
Vendor profiles & capabilities analysis
5-year forecasts
8 regions and 60+ country-level data splits
Market segment data splits
12 months of continuous data updates
DELIVERED AS:
PDF EXCEL ONLINE
Industrial Water Cooling System Market Growth – Trends & Forecast 2025-2035
Industrial Embedded Systems Market Size and Share Forecast Outlook 2025 to 2035
Industrial Vacuum Evaporation Systems Market Analysis - Size & Industry Trends 2025 to 2035
Marine Engine Cooling Systems Market
Fire Protection Systems for Industrial Cooking Market Growth - Trends & Forecast 2025 to 2035
Ductless Heating & Cooling Systems Market Size and Share Forecast Outlook 2025 to 2035
Radiant Heating And Cooling Systems Market
Industrial Grade Electrochemical CO Sensor Market Size and Share Forecast Outlook 2025 to 2035
Industrial Bench Scale Market Size and Share Forecast Outlook 2025 to 2035
Industrial Low Profile Floor Scale Market Size and Share Forecast Outlook 2025 to 2035
Industrial Sand Mill Market Size and Share Forecast Outlook 2025 to 2035
Industrial Control Network Modules Market Size and Share Forecast Outlook 2025 to 2035
Industrial Precision Oven Market Size and Share Forecast Outlook 2025 to 2035
Industrial Water Chiller for PCB Market Size and Share Forecast Outlook 2025 to 2035
Industrial & Commercial HVLS Fans Market Size and Share Forecast Outlook 2025 to 2035
Industrial Robot Controller Market Size and Share Forecast Outlook 2025 to 2035
Industrial Wired Routers Market Size and Share Forecast Outlook 2025 to 2035
Industrial Evaporative Condensers Market Size and Share Forecast Outlook 2025 to 2035
Industrial Energy Management System Market Size and Share Forecast Outlook 2025 to 2035
Industrial Insulation Market Size and Share Forecast Outlook 2025 to 2035

Thank you!
You will receive an email from our Business Development Manager. Please be sure to check your SPAM/JUNK folder too.
Chat With
MaRIA