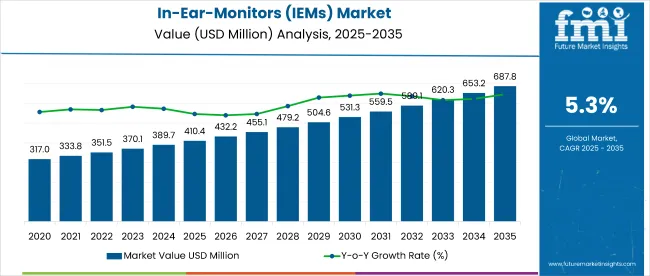
The global In-Ear-monitors (IEMs) market is set to grow at a steady pace, expanding at a 5.3% CAGR from 2025 to 2035. In 2025, the market is valued at USD 410.4 million and is expected to reach USD 687.9 million by 2035.
This growth is driven by the rising demand for high-quality audio devices across the professional audio, entertainment, and personal use sectors. IEMs are increasingly being adopted by both professionals and consumers due to their superior sound quality, portability, and convenience, making them essential for various applications.
Technological advancements are significantly driving market growth. Features such as wireless connectivity, noise-canceling technology, and improved sound quality are making IEMs more attractive to a broader audience. Ergonomic designs and enhanced durability have also contributed to the appeal of IEMs.
The growing demand for personalized audio solutions and high-definition audio experiences is fueling adoption among audiophiles, musicians, and general consumers. As these technologies evolve, IEMs continue to grow in importance for both professional and personal entertainment purposes, shaping the future of portable audio devices.
The professional audio sector is playing a crucial role in the expansion of the IEM market. Musicians, sound engineers, and broadcasting professionals increasingly use IEMs for live performances and studio recordings. The demand for portable, high-quality audio solutions is also rising in fitness, travel, and entertainment applications.
As consumers seek premium audio devices for both professional and personal use, IEMs are becoming indispensable. The growing need for compact, high-performance devices is expected to continue supporting market growth, with IEMs maintaining their significance across a variety of industries through 2035.
Regional dynamics are contributing to market growth, with North America and Europe leading in demand. Both regions have strong professional audio markets where IEMs are integral to live events and broadcasting.
The Asia-Pacific region is expected to experience substantial growth due to increasing disposable income and the growing adoption of consumer electronics. Countries like China and India are driving the demand for high-quality audio devices as consumer interest in premium IEMs rises. The continued growth in these regions will significantly contribute to the expansion of the global IEM market over the forecast period.
Key players in the IEM market include Shure Incorporated, Sennheiser, Sony Corporation, Bose, Audio-Technica, Ultimate Ears, Westone Audio, Etymotic Research, AKG, Beyerdynamic, FiiO Electronics, RHA Technology, Campfire Audio, Audeze, and Jabra.
Innovations from these companies have fueled market growth, with Shure's SE846 Pro offering customizable sound profiles, Sennheiser's IE 900 praised for its sound quality, and Ultimate Ears' UE Premier delivering audiophile-level sound with 21 tiny speakers per ear. These advancements highlight the industry's commitment to meeting diverse consumer and professional needs, supporting the sustained growth of the IEM market.
Global In-Ear-Monitors (IEMs) Industry Outlook
| Attributes | Key Insights |
|---|---|
| Historical Size, 2024 | USD 375.6 million |
| Estimated Size, 2025 | USD 410.4 million |
| Projected Size, 2035 | USD 687.9 million |
| Value-based CAGR (2025 to 2035) | 5.3% |
The in-ear-monitors (IEMs) market is shaped by a range of regulatory authorities that govern safety, wireless standards, environmental compliance, and trade practices. These frameworks play a critical role in determining how IEMs are produced, distributed, and priced across different regions.
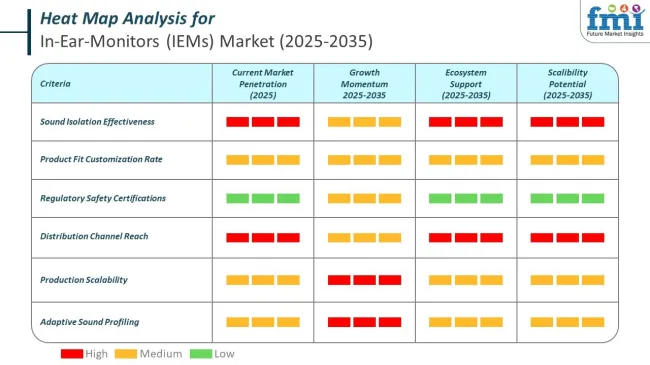
In the in-ear monitors (IEM) market, top companies are actively incorporating AI, ML, and IoT to improve product functionality, personalization, and health integration. These technologies are being used across both consumer and professional-grade devices to elevate the audio experience and safety features.
The below table presents the expected CAGR for the global outlook for in-ear-monitors (IEMs) over several semi-annual periods spanning from 2025 to 2035. In the first half (H1) of the decade from 2024 to 2034, the business is predicted to surge at a CAGR of 6.0%, followed by a slightly lower growth rate of 5.7% in the second half (H2) of the same decade.
| Particular | Value CAGR |
|---|---|
| H1 | 6.0% (2024 to 2034) |
| H2 | 5.7% (2024 to 2034) |
| H1 | 5.3% (2025 to 2035) |
| H2 | 4.8% (2025 to 2035) |
Moving into the subsequent period, from H1 2025 to H2 2035, the CAGR is projected to decrease slightly to 5.3% in the first half and decrease moderately at 4.8% in the second half. In the first half (H1) the market witnessed a decrease of 70.00 BPS while in the second half (H2), the market witnessed an increase of 90.00 BPS.
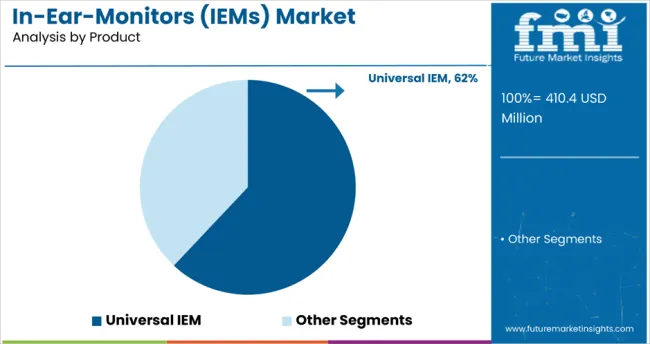
Universal IEMs are expected to capture the largest share of the market due to their widespread appeal, versatility, and ease of use. These IEMs are designed to accommodate various ear shapes and sizes, making them accessible to a broad consumer base, including casual listeners, audiophiles, and professionals, without the need for custom fittings.
Additionally, universal IEMs are typically more affordable compared to custom versions, appealing to budget-conscious consumers who seek high-quality sound at a lower cost. The demand for these devices is also growing in sectors like gaming and live performances, where excellent audio quality is essential. As technology continues to improve, universal IEMs are benefiting from advancements in sound quality, noise isolation, and ergonomic design, reinforcing their dominance in the market.
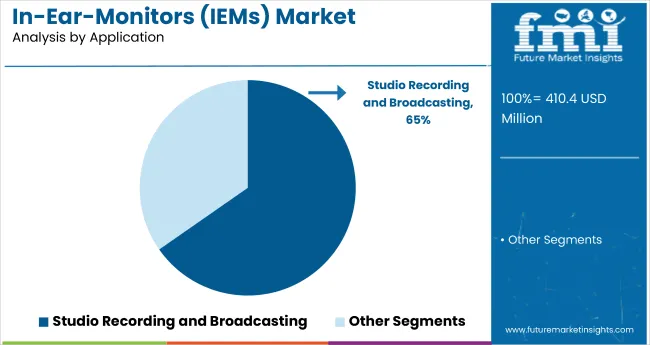
The Studio Recording and Broadcasting application segment is projected to lead the IEM market, as these devices are crucial for delivering high-quality, precise sound in professional environments. IEMs provide superior audio clarity, sound isolation, and comfort, making them indispensable for sound engineers, musicians, and broadcasters.
In studio recording and live broadcasting, where sound quality is critical, IEMs allow professionals to monitor the finest audio details without interference from background noise. This ensures optimal sound mixing and recording, whether in music production, podcasting, or TV production. The increasing demand for high-quality content across various media, including music, films, TV, and radio, further drives the need for reliable, high-performance audio equipment like IEMs in these applications.
Increasing Awareness and Usage of IEMs acts as a Significant Opportunity in the Market
The market is set to have an assertive outlook, considering the increased awareness in developing countries. The introduction of novel products in the emerging market is improving the adoption rate.
As the consumer becomes more attuned to the benefits of IEMs, such as better sound quality, noise cancellation, and portability, demand increases. This is due to factors such as the rapid expansion of online content, online live streaming platforms, and digital audio consumption, where high-quality solutions for audio are in demand.
Another encouraging factor for the adoption of IEMs is the growth of music and entertainment events, especially among the younger population. The reliability and convenience of IEMs during live shows have also made them increasingly popular among musicians, performers, and audio engineers, which has helped increase their use in professional environments.
Moreover, as more people start using personal audio solutions for daily activities, such as exercise, commuting, or simply for fun, the market for consumer-grade IEMs is growing exponentially. The knowledge of ergonomic design and comfort associated with IEMs also increases their appeal, making it popular in various sectors other than music, such as sports, gaming, and general entertainment.
This offers a significant opportunity for producers to increase their market shares by taking advantage of the expanding preference for high-quality, wireless and feature-rich audio devices. Due to increasing awareness globally, it is expected that the market for IEMs will go through significant growth, spearheaded by both professional and consumer segments seeking cutting-edge audio solutions.
Rise of Wireless Technology and Bluetooth Connectivity Driving IEM Market Growth
The evolution of Bluetooth technology has dramatically changed the way people engage with audio devices. The convenience and freedom of using wireless headphones with advanced connectivity are the reasons why people are switching to Bluetooth-enabled IEMs without getting tangled in wires. Wireless IEMs eliminate the hassle of tangled wires, thus giving users high-quality sound without the constraints of traditional wired earphones.
Wireless IEMs portability is the additional boost towards the popularity they receive within many activities. Users in this regard aim to carry around devices which offer them comfort and simplicity of usage. Wireless IEMs thus can be perfect for individuals wanting to undertake commuting, exercising, gaming, etc., without wires causing disturbance in their tasks.
Additionally, as people continue in the trend of multi-tasking wireless IEMs also boast of enhanced mobility in multi-tasking with an advantage of easily switching from, for instance, smartphones or laptops and tablets without any struggle of having to insert remove cables.
This Bluetooth technology evolves every year to add even greater quality on the entire experience, now including more solid connections along with long battery life.
The more recently released editions of the wireless versions add support for even greater audio-streaming functionality while incorporating wider formats in relation to supporting higher resolutions and even delivering higher sound clarity. The rise of wireless technology, coupled with Bluetooth advancements, is set to play a crucial role in the continued expansion of the IEM market.
Increased Demand from the Gaming and E-sports Industry Driving IEM Market Growth
With the increased pace of expansion in the gaming and e-sports industry, there has been a drastic rise in demand for top-quality audio equipment, fueling the growth of IEMs.
As this sport evolves, both serious and professional gamers look to have devices that provide crystal-clear sound quality, isolate noise, and are also comfortable enough to improve overall gaming experience. Gamers are preferring IEMs much because they have compact sizes with the capability of giving immersive audio which is vital during gameplay, especially when players are under time pressure.
High-performance audio equipment, like IEMs, in competitive e-sports is therefore a huge competitive advantage since every sound cue can mean the difference between winning or losing.
The ability to hear minute in-game details, such as footsteps or enemy movements, is what makes it possible to get to top performance. Moreover, IEMs provide superior noise isolation that helps gamers stay focused on the game with no distraction from their surroundings.
This growth in online streaming platforms, e-sports tournaments, and professional gaming leagues further fuels the demand for IEMs. With live streaming gaining more popularity, content creators and professional gamers need premium audio solutions that ensure good quality for both communication and gameplay.
This driver is expected to fuel more adoption of IEMs as gamers seek to upgrade their audio setups to meet the increasing demands of the gaming and e-sports world.
High Cost and Counterfeit Products Restrain Growth in the IEM Market.
The high prices of IEMs restrain their demand. High priced premium IEMs ranges from USD 3000 to 3500; this makes them unaffordable for a large section of the consumers, especially in lower income countries. This higher price restricts the ease of access and adoption in those regions where cost sensitiveness is more pronounced thereby slowing down the market growth in those regions.
Another factor limiting the growth of the IEM market is the abundant presence of counterfeit products. Inevitably, replica IEMs are made from low quality components and flood the markets around the world, especially the developing ones.
They sell it at a much cheaper rate, thereby attracting the wallet-conscious consumer who will trade off on quality. The price gap between original IEMs and pirated versions has become so huge that the latter is in a growing demand, which is affecting the sales of genuine IEMs.
The growth in counterfeit IEMs' production and sales in the unorganized market further threatens this global IEM market. Since consumers are now opting for such low-cost alternatives, the demand for authentic high-quality IEMs decreases.
Combining high product prices and growing counterfeit IEMs suppress overall growth and development of the IEM market, especially in regions that are price sensitive.
The global in-ear-monitors (IEMs) industry recorded a CAGR of 8.3% during the historical period between 2020 and 2024. The growth of in-ear-monitors (IEMs) industry was positive as it reached a value of USD 375.6 million in 2024 from USD 273.3 million in 2020.
The in-ear monitors market around the world has seen growth since 2020 up to 2024. Some of the main factors contributing to this growth are developments in wireless technology, high demand for high-quality audio devices, and increasing interest in digital music streaming and gaming.
The market increased with sales as people wanted improved audio experiences, particularly after the widespread use of Bluetooth-enabled IEMs. During this time, the market has witnessed increasing demand from sectors such as live music events, professional audio applications, and consumer entertainment.
The IEM market will continue its growth in the near future according to the demand forecast from 2025 to 2035. The growth of influence of e-sports, the rise of immersive virtual and augmented reality experiences, and the trend of portable audio solutions will be other factors that drive sustained growth.
As consumer preferences continue to shift towards higher-quality, feature-rich products, demand for advanced IEMs with improved sound quality, noise cancellation, and connectivity options is expected to grow.
The next decade is more likely to see improvements in wireless audio technology and to continue growing, particularly with the developing economies in high disposable incomes and growing levels of urbanization.
Tier 1 companies comprise market leaders with a significant market share of 53.6% in global market. These companies engage in strategic partnerships and acquisitions to expand their product portfolios and access cutting-edge technologies.
Additionally, they emphasize extensive distribution of their products through difference sales channel. Prominent companies in tier 1 include Sennheiser electronic GmbH & Co. KG and Shure Incorporated.
Tier 2 companies include mid-size players having presence in specific regions and highly influencing the local market and holds around 29.2% market share. They typically pursue partnerships with academic institutions and research organizations to leverage emerging technologies and expedite product development.
These companies often emphasize agility and adaptability, allowing them to quickly bring new products to market, additionally targeting specific technologically advanced IEMs. Additionally, they focus on cost-effective production methods to offer competitive pricing. Prominent companies in tier 2 include Audio-Technica, Inc., Loud Audio, LLC, Adam Hall Group, 64 Audio and others.
Finally, Tier 3 companies, such as Audiofly, Jerry Harvey Audio LLC and others. They specialize in specific products and cater to niche markets, adding diversity to the industry.
Overall, while Tier 1 companies are the primary drivers of the market, Tier 2 and 3 companies also make significant contributions, ensuring the in-ear-monitors (IEMs) sales remains dynamic and competitive.
The section below covers the analysis for the in-ear-monitors (IEMs) industry outlook for different countries. Market demand analysis on key countries in several regions of the globe, including North America, Latin America, East Asia, South Asia & Pacific, Western Europe, Eastern Europe and Middle Ease & Africa, is provided.
The United States is anticipated to remain at the forefront in North America, with higher market share through 2035. In South Asia & Pacific, India is projected to witness a CAGR of 8.7% by 2035.
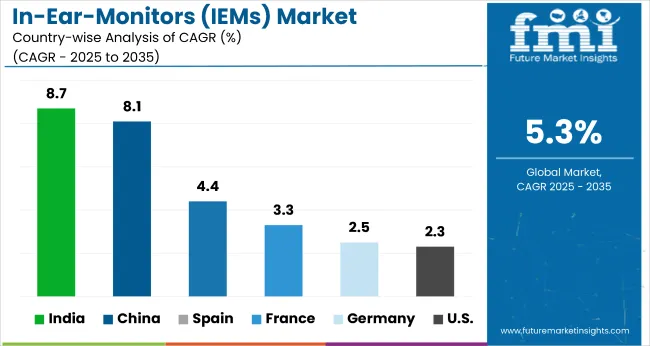
| Countries | Value CAGR (2025 to 2035) |
|---|---|
| United States | 2.3% |
| Germany | 2.5% |
| China | 8.1% |
| France | 3.3% |
| India | 8.7% |
| Spain | 4.4% |
| Australia & New Zealand | 4.7% |
| South Korea | 6.3% |
United States’ in-ear-monitors (IEMs) industry analysis is sexpected to grow at a CAGR of 2.3% between 2025 and 2035. Currently, it holds the highest share in the North American market, and the trend is expected to continue during the forecast period.
The United States is likely to continue to lead the in-ear monitor (IEM) market as it has a developed technology landscape, has strong demand from a number of industries, and has high disposable incomes. The USA entertainment sector, which comprises music, gaming, and broadcasting, is well developed and relies on IEMs.
Professional musicians and sound engineers, as well as serious gamers, in the United States rely heavily on IEMs for exceptional audio performance, which fuels the demand in the market.
Furthermore, live concerts, e-sports, and streaming services are growing significantly in the United States that boost the requirement for IEMs. The adoption of wireless IEMs and high-definition audio quality is growing significantly in entertainment and media.
The availability of prominent players and e-commerce sites such as Amazon, Best Buy, and B&H Photo Video allows the IEMs to reach customers more easily for both professional and personal use.
This growth is driven by consumer awareness and continuous product innovations in wireless and noise-canceling technologies.
China’s in-ear-monitors (IEMs) industry analysis is witnessed to exhibit a CAGR of 8.1% between 2025 and 2035. Currently, it holds the highest share in the East Asia market, and the trend is expected to continue during the forecast period.
The emergence of local manufacturers has played a crucial role in the growth of China's IEM market. These manufacturers caters to the growing consumer demand for high-quality audio products with even more aggressive pricing, making premium audio accessible to a larger population.
Chinese IEM manufacturers have quickly caught up in terms of their production capabilities, with more focus on the latest technologies like noise cancellation, better connectivity, and wireless capabilities. Local brands have carved out a significant share of the market because of their focus on innovation and affordability.
Many local manufacturers in the country leverage its extensive supply chains, allowing them to reduce production costs and offer IEMs at more affordable prices. Most Chinese brands are coming with products as per demand and preferences for the China people, where they bring them with special features long-life batteries, ergonomic, among others.
As a result, with the increase in the market for IEM the local Chinese manufacturers are expected to remain at the forefront of creating affordable, high-performance audio solutions.
India’s market for in-ear-monitors (IEMs) is poised to exhibit a CAGR of 8.7% between 2025 and 2035. Currently, it holds the highest share in the South Asia & Pacific market, and the trend is expected to continue during the forecast period.
The IEM market in India is rapidly growing mainly because of the growth of the country's digital entertainment sector. As millions of Indian customers start streaming more from Spotify, YouTube, Amazon Prime, and others, one could see how the propensity to premium audio solutions grows.
With the increasing demographics consuming music, podcasts, and videos on mobile platforms, consumers now look for rich sound quality and immersive sound experiences.
Especially, there is a demand for IEMs with better sound quality, noise isolation, and comfort as these devices are perfect for extended periods of listening to various forms of entertainment. This growing preference for good audio is also driving the adoption of IEMs in the country.
The gaming and e-sports market in India further is responsible for the boom in IEM. With the further rise of mobile gaming, Twitch and YouTube Gaming live streaming of games have also risen. Those in the business of creating and streaming gaming and doing content creation require crystal-clear communication and the best sound equipment to stay ahead in their competition.
With e-sports events and gaming culture at a record high in India, there is further adoption of IEMs-a device that caters to the precise audio requirements of this community, thereby pushing the growth of the market in India.
To improve their business strategies and strengthen their presence around the globe, the key players are involved in various product launches, expansions, collaborations, and mergers and acquisitions. Below are the top key promotional strategies adopted by the key players in the market:
Recent Industry Developments in In-Ear-Monitors (IEMs) Industry
| Report Attributes | Details |
|---|---|
| Current Total Market Size (2025) | USD 410.4 million |
| Projected Market Size (2035) | USD 687.9 million |
| CAGR (2025 to 2035) | 5.3% |
| Base Year for Estimation | 2024 |
| Historical Period | 2020 to 2024 |
| Projections Period | 2025 to 2035 |
| Quantitative Units | USD million for value and million units for volume |
| Product Types Analyzed (Segment 1) | Custom IEMs (2-Driver, 3-Driver, 4-Driver, 6-Driver, 8/9-Driver, 12-Driver, 18-Driver Earphones), Universal IEMs (2-Driver, 3-Driver, 4-Driver, 6-Driver, 8/9-Driver, 12-Driver, 18-Driver Earphones) |
| Applications Analyzed (Segment 2) | Live Events and Performances, Studio Recording and Broadcasting |
| Distribution Channels Analyzed (Segment 3) | Supermarkets/Hypermarkets, Multi-brand Stores, Exclusive Stores, E-commerce/Online Sales |
| Regions Covered | North America; Latin America; Western Europe; Eastern Europe; South Asia and Pacific; East Asia; Middle East & Africa |
| Countries Covered | United States, Canada, Mexico, Brazil, Argentina, Germany, France, United Kingdom, Italy, Spain, Netherlands, China, India, Japan, South Korea, ANZ, GCC Countries, South Africa |
| Key Players influencing the In-Ear Monitors Market | Shure Incorporated, AFUL Audio, Sennheiser electronic GmbH & Co. KG, Loud Audio, LLC, Samson, Adam Hall Group (LD Systems), Audio-Technica, Inc., MIPRO Electronics, Jerry Harvey Audio LLC, 64 Audio, Audiofly, Others |
| Additional Attributes | Dollar sales by product type (custom vs universal), Driver configuration trends across segments, Application-based demand (live vs studio use), Growth in e-commerce and direct-to-consumer sales, Integration of wireless and smart audio technologies, Material and comfort innovations for IEM fit and usage duration |
| Customization and Pricing | Customization and Pricing Available on Request |
In terms of product, the industry is divided into- Custom IEM (2-Driver Earphones, 3-Driver Earphones, 4-Driver Earphones, 6-Driver Earphones, 8/9-Driver Earphones, 12-Driver Earphones, 18-Driver Earphones) and Universal IEM (2-Driver Earphones, 3-Driver Earphones, 4-Driver Earphones, 6-Driver Earphones, 8/9-Driver Earphones, 12-Driver Earphones, 18-Driver Earphones).
In terms of application, the industry is segregated into- life events and performances and studio recording and broadcasting.
In terms of distribution channel, the industry is segregated into- supermarkets/hypermarkets, multi-brand stores, exclusive stores and e-commerce/online sales.
Key countries of North America, Latin America, Western Europe, Eastern Europe, South Asia and Pacific, East Asia and Middle East and Africa (MEA) have been covered in the report.
The global in-ear-monitors (IEMs) market is projected to witness CAGR of 5.3% between 2025 and 2035.
The global in-ear-monitors (IEMs) sales stood at USD 375.6 million in 2024.
The global in-ear-monitors (IEMs) outlook is anticipated to reach USD 687.9 million by 2035 end.
India is set to record the highest CAGR of 8.7% in the assessment period.
The key players operating in the global in-ear-monitors (IEMs) market include Shure Incorporated AFUL Audio, Sennheiser electronic GmbH & Co. KG, Loud Audio, LLC, Samson, Adam Hall Group (LD Systems), Audio-Technica, Inc., MIPRO Electronics, Jerry Harvey Audio LLC., 64 Audio, Audiofly and others.

Thank you!
You will receive an email from our Business Development Manager. Please be sure to check your SPAM/JUNK folder too.
Chat With
MaRIA