IgE Allergy Blood Tests Market Size and Share Forecast Outlook 2025 to 2035

The IgEallergy blood tests market is valued at USD 33.2 billion in 2025 and is slated to reach USD 53.6 billion by 2035, at a CAGR of 4.9%. Its growth is driven by the rising prevalence of allergic diseases, increasing awareness towards early diagnosis, and technological advancements in immunoassay testing platforms.
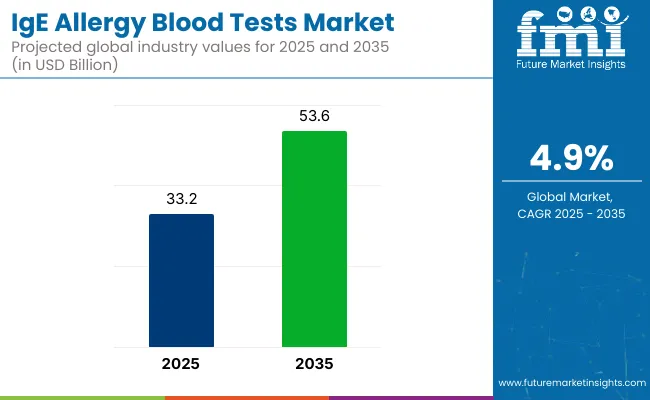
Quick Stats for IgE Allergy Blood Tests Market

  • Market Value (2025): USD 33.2 billion
  • Forecast Value (2035): USD 53.6 billion
  • Forecast CAGR: 4.9%
  • Leading Product Type in 2025: ELISA Testing Kits (65% market share)
  • Top Application Segment: Aero Allergies (70% market share)
  • Key Growth Region:North America (USA is the fastest-growing market with 5.2% CAGR)

Ige Allergy Blood Tests Market

Metric Value
Industry Size (2025) USD 33.2 Billion
Industry Value (2035) USD 53.6 Billion
CAGR (2025 to 2035) 4.9%

Market expansion is also supported by the shift towards personalized allergy diagnostics and AI-powered allergy prediction models for precision care..The market holds an estimated 100% share within the allergy diagnostics segment, underscoring its central role in this field. Within the broader in vitro diagnostic (IVD) market, it commands approximately 1-2%, reflecting its niche position.

It contributes around 10-15% to the immunoassay market, where it plays a significant role in allergy testing. In the clinical diagnostics market, its share is approximately 5-10%, emphasizing its specialized function. Within the personalized medicine market, it accounts for roughly 2-4%, supporting tailored allergy treatments.

The market has witnessed significant innovations aimed at improving diagnostic accuracy, efficiency, and accessibility. Advancements such as nano-ELISA technology, AI-driven interpretation software, and microfluidic biosensor platforms are enhancing assay sensitivity, reducing turnaround times, and enabling high-throughput multiplex allergen testing in clinical laboratories.

These technological developments are being integrated with telehealth services and home-based testing kits to increase accessibility, particularly for patients in remote or underserved regions, thereby expanding market penetration and enhancing early allergy detection.

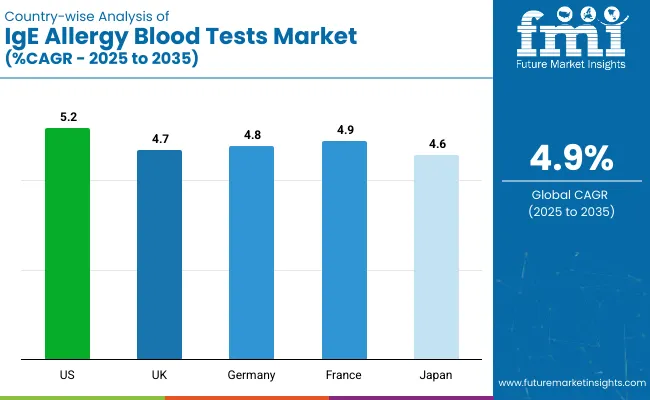
The USA is expected to be the fastest-growing market for IgE allergy blood tests, with a projected CAGR of 5.2% from 2025 to 2035. The ELISA testing kits segment will dominate the product type category, accounting for over 65% of the market share in 2025. Aero allergies will lead the application segment, capturing 70% of the market share in 2025. France is forecasted to grow at a CAGR of 4.9%, while Germany is projected to grow at a CAGR of 4.8%.

Analyzing IgE Allergy Blood Tests Market by Top Investment Segments

The market is segmented into product type, application, end user, and region. By product type, the market is divided into assays and kits, ELISA testing kits, fluorescent enzyme immunoassays (FEIA) testing kits,chemiluminescent immunoassays (CLIA), reagents, consumables, and analyzers. Based on application, the market is categorized into aero allergies, indoor allergies, outdoor allergies, food allergies, venoms, medicine allergies, and latex/metal allergies.

In terms of end user, the market is segmented into diagnostic laboratories, specialty clinics, hospitals, and research & academic centers. Regionally, the market is classified into North America, Latin America, Western Europe, Eastern Europe, East Asia, South Asia Pacific, and Middle East and Africa.

ELISA Testing Kits to Lead the Product Type Segment with Over 65% Market Share

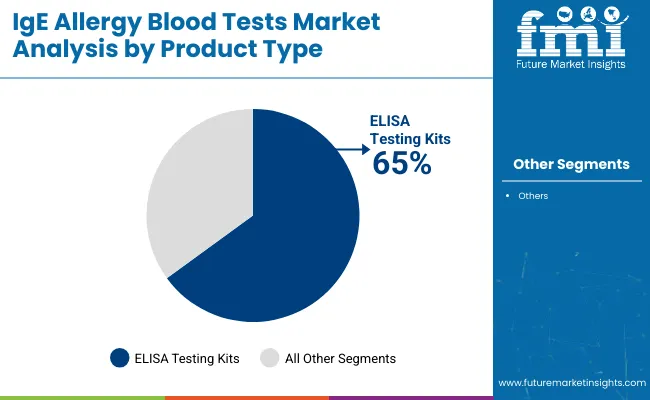
ELISA testing kits are projected to lead the product type segment, accounting for over 65% of the global market share by 2025. These kits are widely used for their specificity, automation compatibility, and quantitative results, making them suitable for diagnostic laboratories.
  • ELISA kits have enabled high throughput testing with low sample volumes.
  • They are integrated into telehealth models for home-based sample collection and AI-assisted interpretation.
  • Innovations in nano-ELISA and microfluidic platforms enhance assay sensitivity and efficiency.

Ige Allergy Blood Tests Market Product Type

Aero Allergies to Dominate Application Segment with Approximately 70% Market Share

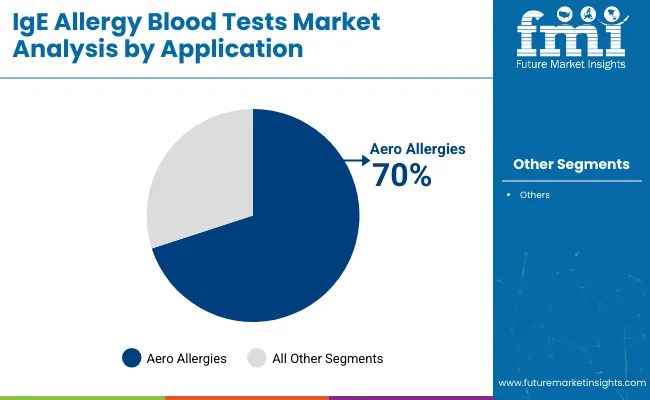
Aero allergies are expected to lead the application segment, capturing approximately 70% market share in 2025. Rising exposure to airborne allergens such as pollen, dust mites, and mold spores has increased demand for high-specificity aeroallergen blood tests.
  • Personalized aeroallergen panels are being developed for regional pollen differences and occupational health screening.
  • AI-assisted aeroallergen profiling enhances early detection and treatment planning.
  • Wearable-based allergen exposure monitoring supports preventive healthcare.

Ige Allergy Blood Tests Market By Application

Diagnostic Laboratories to Lead the End User Segment with Over 50% Market Share

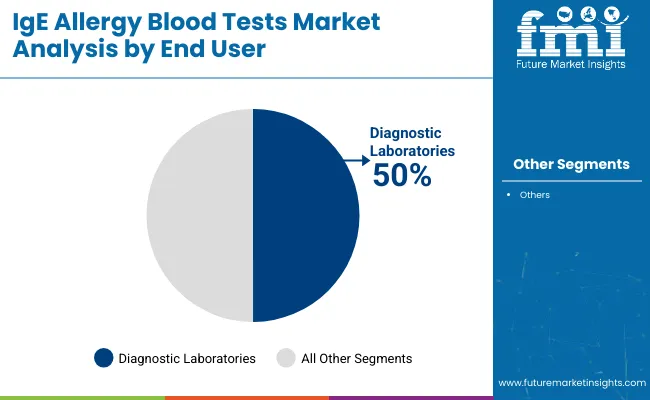
Diagnostic laboratories are projected to lead the end user segment, accounting for over 50% of the global market share by 2025. These facilities have remained primary providers of allergy diagnostics due to their advanced infrastructure, high-throughput testing capabilities, and integration of automated immunoassay platforms.
  • Diagnostic laboratories have adopted multiplex allergy testing panels for efficient screening.
  • AI-powered diagnostic interpretation is enhancing result accuracy and reporting speed.
  • Demand is driven by rising physician referrals for specific IgE allergy blood testing.
  • Laboratories are integrating telehealth sample collection to expand patient access.

Ige Allergy Blood Tests Market End User

Top IgE Allergy Blood Tests Market Dynamics

The IgE allergy blood tests market has been experiencing steady growth, driven by the rising prevalence of allergic diseases, technological advancements in immunoassay platforms, and increased awareness regarding early diagnosis and personalized allergy management.

Recent Trends in the IgE Allergy Blood Tests Market
  • The adoption of AI-powered allergy diagnostics and personalized immunotherapy recommendations has increased.
  • Development of nano-ELISA and microfluidic biosensor platforms for enhanced diagnostic accuracy is expanding.
  • Integration of allergy diagnostics with telehealth platforms and home-based testing kits is growing.

Challenges in the IgE Allergy Blood Tests Market

  • High costs associated with advanced allergy diagnostic tests continue to limit accessibility in developing regions.
  • Lack of universal standardization for allergen panels creates variability in results and clinical interpretation.
  • Limited reimbursement policies and awareness in certain countries constrain market expansion.

Analyzing Top Countries Exporting, Distributing, and Supplying IgE Allergy Blood Test Solutions

Ige Allergy Blood Tests Market Country Wise

The USA leads with a CAGR of 5.2%, driven by precision diagnostics and telehealth expansion. France follows with 4.9% CAGR, supported by molecular diagnostics and eco-friendly reagents adoption. Germany’s CAGR stands at 4.8%, backed by multiplex testing panels and EU-standardized protocols.

The UK market grows at 4.7% CAGR, with food allergy diagnostics and point-of-care testing as key drivers. Japan shows a 4.6% CAGR, supported by molecular-based assays and home-based solutions. Overall, the USA shows the highest growth, while Japan records the lowest CAGR among these leading countries in IgE allergy blood testing.

The report covers in-depth analysis of 40+ countries, with five top-performing OECD countries highlighted below.

USA IgE Allergy Blood Tests Market Analysis

for IgE allergy blood tests demand in the USA is projected to grow at a CAGR of 5.2% from 2025 to 2035. Growth has been supported by rising prevalence of allergies, increasing adoption of precision diagnostics, and advancements in AI-powered testing solutions.

  • Strong demand for personalized allergy diagnostics and treatment planning.
  • AI-integrated diagnostic interpretation enhances test accuracy in laboratories.
  • Expansion of telehealth and home-based sample collection is improving accessibility.
  • Regulatory standards promote early childhood allergy screening programs.

IgE Allergy Blood Tests Demand Analysis in the UK

The UK IgE allergy blood tests revenue is forecast to expand at a CAGR of 4.7% over the forecast period. Demand has been driven by high food allergy prevalence, government initiatives for early detection, and adoption of point-of-care testing solutions.

  • Food allergy diagnostics remain a primary driver for market growth.
  • AI-enabled profiling is enhancing efficiency in diagnostic workflows.
  • Diagnostic laboratories are investing in high-throughput immunoassay platforms.
  • Regulatory frameworks emphasize accuracy and rapid result reporting.

IgE Allergy Blood Tests Demand Analysis in Germany

IgE allergy blood tests demand in Germany is projected to grow at a CAGR of 4.8% between 2025 and 2035. The nation’s strong healthcare infrastructure and focus on allergen standardization are boosting demand for advanced testing solutions.

  • Demand for multiplex allergy testing panels in clinical laboratories is increasing.
  • AI integration is improving accuracy and efficiency of diagnostic results.
  • Strict EU regulations are shaping allergen testing protocols and standards.
  • Research into advanced immunoassay technologies is being prioritized.

France IgE Allergy Blood Tests Market Analysis

The French IgE allergy blood tests market is expected to grow at a CAGR of 4.9% from 2025 to 2035. Growth has been supported by rising food and respiratory allergies, increasing adoption of molecular diagnostics, and AI-based allergy analysis.

  • Strong demand for allergen component-resolved diagnostics in laboratories.
  • AI-driven interpretation tools are enhancing personalized allergy management.
  • Investments in sustainable diagnostic kits and eco-friendly reagents are increasing.
  • Regulatory frameworks emphasize quality assurance and patient safety.

IgE Allergy Blood Tests Revenue Analysis in Japan

The sales of IgE allergy blood tests in Japan are forecast to grow at a CAGR of 4.6% through 2035. Growth has been driven by rising allergy prevalence, advanced biotechnology capabilities, and demand for high-precision diagnostic solutions.

  • Molecular-based IgE assays are widely used for accurate identification of allergen.
  • AI-powered diagnostic interpretation enhances clinical decision-making.
  • Home-based testing solutions are gaining popularity among consumers.
  • Industry is focusing on safety standards and regulatory compliance.

Leading IgE Allergy Blood Test Solution Suppliers and Distributors

The IgE allergy blood tests market is moderately consolidated, with global leaders and regional firms driving competitive dynamics through high-sensitivity immunoassays, AI-integrated diagnostics, and automated testing platforms.

Tier-one firms, such as Thermo Fisher Scientific, Siemens Healthineers, Danaher Corporation (Beckman Coulter), Omega Diagnostics Group PLC, and HYCOR Biomedical, have been focusing on technological innovation, high-throughput capabilities, and expanded allergen panel offerings for enhanced diagnostic accuracy and patient care.

Recent IgE Allergy Blood Tests Industry News

  • In April 2025, Thermo Fisher announced a four-year investment plan to enhance USA innovation and support customer manufacturing, focusing on expanding manufacturing and lab services capacity.
  • In May 2025, Siemens Healthineers announced a USD 150 million investment to expand production and create jobs in the United States, aiming to better serve their largest global market.

IgE Allergy Blood Tests Market Report Scope

Report Attributes Details
Current Total Market Size (2025) USD 33.2 billion
Projected Market Size (2035) USD 53.6 billion
CAGR (2025 to 2035) 4.9%
Base Year for Estimation 2024
Historical Period 2020 to 2024
Projections Period 2025 to 2035
Report Parameters Revenue in USD billion / Volume in units
By Product Type Assays and Kits, ELISA Testing Kits, Fluorescent Enzyme Immunoassays (FEIA) Testing Kits, Chemiluminescent Immunoassays (CLIA), Reagents, Consumables, and Analyzers
By Application Aero Allergies, Indoor Allergies, Outdoor Allergies, Food Allergies, Venoms, Medicine Allergies, and Latex/Metal Allergies
By End User Diagnostic Laboratories, Specialty Clinics, Hospitals, and Research & Academic Centers
Regions Covered North America, Latin America, Western Europe, Eastern Europe, East Asia, South Asia Pacific, Middle East and Africa
Countries Covered United States, Canada, United Kingdom, Germany, France, China, Japan, South Korea, Brazil, Australia
Key Players Thermo Fisher Scientific, Siemens Healthineers, Danaher Corporation (Beckman Coulter), Omega Diagnostics Group PLC, HYCOR Biomedical, Abcam plc, PerkinElmer Inc., R- Biopharm AG, Eurofins Scientific, BioMérieux SA
Additional Attributes Market share analysis by product type and application, country-wise CAGR analysis, and brand positioning insights

Key Segments

By Product Type:

  • Assays and kits
  • ELISA Testing Kits
  • Fluorescent enzyme immunoassays (FEIA) Testing Kits
  • Chemiluminescent Immunoassays (CLIA)
  • Reagents
  • Consumables
  • Analyzers

By Application:

  • Aero allergies
  • Indoor allergies
  • Outdoor allergies
  • Food allergies
  • Venoms
  • Medicine allergies
  • Latex /metal allergies

By End User:

  • Diagnostic laboratories
  • Specialty clinics
  • Hospitals
  • Research and academic centers

By Region:

  • North America
  • Latin America
  • Western Europe
  • Eastern Europe
  • East Asia
  • South Asia Pacific
  • Middle East and Africa

Table of Content

  1. Executive Summary
    • Global Market Outlook
    • Demand-side Trends
    • Supply-side Trends
    • Technology Roadmap Analysis
    • Analysis and Recommendations
  2. Market Overview
    • Market Coverage / Taxonomy
    • Market Definition / Scope / Limitations
  3. Market Background
    • Market Dynamics
      • Drivers
      • Restraints
      • Opportunity
      • Trends
    • Scenario Forecast
      • Demand in Optimistic Scenario
      • Demand in Likely Scenario
      • Demand in Conservative Scenario
    • Opportunity Map Analysis
    • Product Life Cycle Analysis
    • Supply Chain Analysis
      • Supply Side Participants and their Roles
        • Producers
        • Mid-Level Participants (Traders/ Agents/ Brokers)
        • Wholesalers and Distributors
      • Value Added and Value Created at Node in the Supply Chain
      • List of Raw Material Suppliers
      • List of Existing and Potential Buyer’s
    • Investment Feasibility Matrix
    • Value Chain Analysis
      • Profit Margin Analysis
      • Wholesalers and Distributors
      • Retailers
    • PESTLE and Porter’s Analysis
    • Regulatory Landscape
      • By Key Regions
      • By Key Countries
    • Regional Parent Market Outlook
    • Production and Consumption Statistics
    • Import and Export Statistics
  4. Global Market Analysis 2020-2024 and Forecast, 2025-2035
    • Historical Market Size Value (USD Billion) & Volume (Units) Analysis, 2020-2024
    • Current and Future Market Size Value (USD Billion) & Volume (Units) Projections, 2025-2035
      • Y-o-Y Growth Trend Analysis
      • Absolute $ Opportunity Analysis
  5. Global Market Pricing Analysis 2020-2024 and Forecast 2025-2035
  6. Global Market Analysis 2020-2024 and Forecast 2025-2035, By Product Type
    • Introduction / Key Findings
    • Historical Market Size Value (USD Billion) & Volume (Units) Analysis By Product Type, 2020-2024
    • Current and Future Market Size Value (USD Billion) & Volume (Units) Analysis and Forecast By Product Type, 2025-2035
      • Assays and Kits
      • ELISA Testing Kits
      • Fluorescent Enzyme Immunoassays (FEIA) Testing Kits
      • Chemiluminescent Immunoassays (CLIA)
      • Reagents
      • Consumables
      • Analyzers
    • Y-o-Y Growth Trend Analysis By Product Type, 2020-2024
    • Absolute $ Opportunity Analysis By Product Type, 2025-2035
  7. Global Market Analysis 2020-2024 and Forecast 2025-2035, By Application
    • Introduction / Key Findings
    • Historical Market Size Value (USD Billion) & Volume (Units) Analysis By Application, 2020-2024
    • Current and Future Market Size Value (USD Billion) & Volume (Units) Analysis and Forecast By Application, 2025-2035
      • Aero Allergies
      • Indoor Allergies
      • Outdoor Allergies
      • Food Allergies
      • Venoms
      • Medicine Allergies
      • Latex/Metal Allergies
    • Y-o-Y Growth Trend Analysis By Application, 2020-2024
    • Absolute $ Opportunity Analysis By Application, 2025-2035
  8. Global Market Analysis 2020-2024 and Forecast 2025-2035, By End User
    • Introduction / Key Findings
    • Historical Market Size Value (USD Billion) & Volume (Units) Analysis By End User, 2020-2024
    • Current and Future Market Size Value (USD Billion) & Volume (Units) Analysis and Forecast By End User, 2025-2035
      • Diagnostic Laboratories
      • Specialty Clinics
      • Hospitals
      • Research and Academic Centers
    • Y-o-Y Growth Trend Analysis By End User, 2020-2024
    • Absolute $ Opportunity Analysis By End User, 2025-2035
  9. Global Market Analysis 2020-2024 and Forecast 2025-2035, By Region
    • Introduction
    • Historical Market Size Value (USD Billion) & Volume (Units) Analysis By Region, 2020-2024
    • Current Market Size Value (USD Billion) & Volume (Units) Analysis and Forecast By Region, 2025-2035
      • North America
      • Latin America
      • Western Europe
      • Eastern Europe
      • East Asia
      • South Asia & Pacific
      • Middle East and Africa
    • Market Attractiveness Analysis By Region
  10. North America Market Analysis 2020-2024 and Forecast 2025-2035, By Country
    • Historical Market Size Value (USD Billion) & Volume (Units) Trend Analysis By Market Taxonomy, 2020-2024
    • Market Size Value (USD Billion) & Volume (Units) Forecast By Market Taxonomy, 2025-2035
      • By Country
        • USA
        • Canada
        • Mexico
      • By Product Type
      • By Application
      • By End User
    • Market Attractiveness Analysis
      • By Country
      • By Product Type
      • By Application
      • By End User
    • Key Takeaways
  11. Latin America Market Analysis 2020-2024 and Forecast 2025-2035, By Country
    • Historical Market Size Value (USD Billion) & Volume (Units) Trend Analysis By Market Taxonomy, 2020-2024
    • Market Size Value (USD Billion) & Volume (Units) Forecast By Market Taxonomy, 2025-2035
      • By Country
        • Brazil
        • Argentina
        • Rest of LATAM
      • By Product Type
      • By Application
      • By End User
    • Market Attractiveness Analysis
      • By Country
      • By Product Type
      • By Application
      • By End User
    • Key Takeaways
  12. Western Europe Market Analysis 2020-2024 and Forecast 2025-2035, By Country
    • Historical Market Size Value (USD Billion) & Volume (Units) Trend Analysis By Market Taxonomy, 2020-2024
    • Market Size Value (USD Billion) & Volume (Units) Forecast By Market Taxonomy, 2025-2035
      • By Country
        • Germany
        • Italy
        • France
        • UK
        • Spain
        • BENELUX
        • Nordic
        • Rest of W.Europe
      • By Product Type
      • By Application
      • By End User
    • Market Attractiveness Analysis
      • By Country
      • By Product Type
      • By Application
      • By End User
    • Key Takeaways
  13. Eastern Europe Market Analysis 2020-2024 and Forecast 2025-2035, By Country
    • Historical Market Size Value (USD Billion) & Volume (Units) Trend Analysis By Market Taxonomy, 2020-2024
    • Market Size Value (USD Billion) & Volume (Units) Forecast By Market Taxonomy, 2025-2035
      • By Country
        • Russia
        • Hungary
        • Poland
        • Balkan & Baltics
        • Rest of E. Europe
      • By Product Type
      • By Application
      • By End User
    • Market Attractiveness Analysis
      • By Country
      • By Product Type
      • By Application
      • By End User
    • Key Takeaways
  14. East Asia Market Analysis 2020-2024 and Forecast 2025-2035, By Country
    • Historical Market Size Value (USD Billion) & Volume (Units) Trend Analysis By Market Taxonomy, 2020-2024
    • Market Size Value (USD Billion) & Volume (Units) Forecast By Market Taxonomy, 2025-2035
      • By Country
        • China
        • Japan
        • South Korea
      • By Product Type
      • By Application
      • By End User
    • Market Attractiveness Analysis
      • By Country
      • By Product Type
      • By Application
      • By End User
    • Key Takeaways
  15. South Asia & Pacific Market Analysis 2020-2024 and Forecast 2025-2035, By Country
    • Historical Market Size Value (USD Billion) & Volume (Units) Trend Analysis By Market Taxonomy, 2020-2024
    • Market Size Value (USD Billion) & Volume (Units) Forecast By Market Taxonomy, 2025-2035
      • By Country
        • India
        • Australia & New Zealand
        • ASEAN
        • Rest of SAP
      • By Product Type
      • By Application
      • By End User
    • Market Attractiveness Analysis
      • By Country
      • By Product Type
      • By Application
      • By End User
    • Key Takeaways
  16. Middle East and Africa Market Analysis 2020-2024 and Forecast 2025-2035, By Country
    • Historical Market Size Value (USD Billion) & Volume (Units) Trend Analysis By Market Taxonomy, 2020-2024
    • Market Size Value (USD Billion) & Volume (Units) Forecast By Market Taxonomy, 2025-2035
      • By Country
        • GCC Countries
        • Northern Africa
        • South Africa
        • Turkiye
        • Rest of MEA
      • By Product Type
      • By Application
      • By End User
    • Market Attractiveness Analysis
      • By Country
      • By Product Type
      • By Application
      • By End User
    • Key Takeaways
  17. Key Countries Market Analysis
    • USA
      • Pricing Analysis
      • Market Share Analysis, 2024
        • By Product Type
        • By Application
        • By End User
    • Canada
      • Pricing Analysis
      • Market Share Analysis, 2024
        • By Product Type
        • By Application
        • By End User
    • Brazil
      • Pricing Analysis
      • Market Share Analysis, 2024
        • By Product Type
        • By Application
        • By End User
    • Mexico
      • Pricing Analysis
      • Market Share Analysis, 2024
        • By Product Type
        • By Application
        • By End User
    • Argentina
      • Pricing Analysis
      • Market Share Analysis, 2024
        • By Product Type
        • By Application
        • By End User
  18. Market Structure Analysis
    • Competition Dashboard
    • Competition Benchmarking
    • Market Share Analysis of Top Players
      • By Regional
      • By Product Type
      • By Application
      • By End User
  19. Competition Analysis
    • Competition Deep Dive
      • Thermo Fisher Scientific
        • Overview
        • Product Portfolio
        • Profitability by Market Segments (Product/Age /Sales Channel/Region)
        • Sales Footprint
        • Strategy Overview
          • Marketing Strategy
          • Product Strategy
          • Channel Strategy
      • Siemens Healthineers
        • Overview
        • Product Portfolio
        • Profitability by Market Segments (Product/Age /Sales Channel/Region)
        • Sales Footprint
        • Strategy Overview
          • Marketing Strategy
          • Product Strategy
          • Channel Strategy
      • Danaher Corporation (Beckman Coulter)
        • Overview
        • Product Portfolio
        • Profitability by Market Segments (Product/Age /Sales Channel/Region)
        • Sales Footprint
        • Strategy Overview
          • Marketing Strategy
          • Product Strategy
          • Channel Strategy
      • Omega Diagnostics Group PLC
        • Overview
        • Product Portfolio
        • Profitability by Market Segments (Product/Age /Sales Channel/Region)
        • Sales Footprint
        • Strategy Overview
          • Marketing Strategy
          • Product Strategy
          • Channel Strategy
      • HYCOR Biomedical
        • Overview
        • Product Portfolio
        • Profitability by Market Segments (Product/Age /Sales Channel/Region)
        • Sales Footprint
        • Strategy Overview
          • Marketing Strategy
          • Product Strategy
          • Channel Strategy
      • Abcam plc
        • Overview
        • Product Portfolio
        • Profitability by Market Segments (Product/Age /Sales Channel/Region)
        • Sales Footprint
        • Strategy Overview
          • Marketing Strategy
          • Product Strategy
          • Channel Strategy
      • PerkinElmer Inc.
        • Overview
        • Product Portfolio
        • Profitability by Market Segments (Product/Age /Sales Channel/Region)
        • Sales Footprint
        • Strategy Overview
          • Marketing Strategy
          • Product Strategy
          • Channel Strategy
      • R-Biopharm AG
        • Overview
        • Product Portfolio
        • Profitability by Market Segments (Product/Age /Sales Channel/Region)
        • Sales Footprint
        • Strategy Overview
          • Marketing Strategy
          • Product Strategy
          • Channel Strategy
      • Eurofins Scientific
        • Overview
        • Product Portfolio
        • Profitability by Market Segments (Product/Age /Sales Channel/Region)
        • Sales Footprint
        • Strategy Overview
          • Marketing Strategy
          • Product Strategy
          • Channel Strategy
      • BioMérieux SA
        • Overview
        • Product Portfolio
        • Profitability by Market Segments (Product/Age /Sales Channel/Region)
        • Sales Footprint
        • Strategy Overview
          • Marketing Strategy
          • Product Strategy
          • Channel Strategy
  20. Assumptions & Acronyms Used
  21. Research Methodology

List of Tables

  • Table 1: Global Market Value (USD Billion) Forecast by Region, 2020-2035
  • Table 2: Global Market Volume (Units) Forecast by Region, 2020-2035
  • Table 3: Global Market Value (USD Billion) Forecast by Product Type, 2020-2035
  • Table 4: Global Market Volume (Units) Forecast by Product Type, 2020-2035
  • Table 5: Global Market Value (USD Billion) Forecast by Application, 2020-2035
  • Table 6: Global Market Volume (Units) Forecast by Application, 2020-2035
  • Table 7: Global Market Value (USD Billion) Forecast by End User, 2020-2035
  • Table 8: Global Market Volume (Units) Forecast by End User, 2020-2035
  • Table 9: North America Market Value (USD Billion) Forecast by Country, 2020-2035
  • Table 10: North America Market Volume (Units) Forecast by Country, 2020-2035
  • Table 11: North America Market Value (USD Billion) Forecast by Product Type, 2020-2035
  • Table 12: North America Market Volume (Units) Forecast by Product Type, 2020-2035
  • Table 13: North America Market Value (USD Billion) Forecast by Application, 2020-2035
  • Table 14: North America Market Volume (Units) Forecast by Application, 2020-2035
  • Table 15: North America Market Value (USD Billion) Forecast by End User, 2020-2035
  • Table 16: North America Market Volume (Units) Forecast by End User, 2020-2035
  • Table 17: Latin America Market Value (USD Billion) Forecast by Country, 2020-2035
  • Table 18: Latin America Market Volume (Units) Forecast by Country, 2020-2035
  • Table 19: Latin America Market Value (USD Billion) Forecast by Product Type, 2020-2035
  • Table 20: Latin America Market Volume (Units) Forecast by Product Type, 2020-2035
  • Table 21: Latin America Market Value (USD Billion) Forecast by Application, 2020-2035
  • Table 22: Latin America Market Volume (Units) Forecast by Application, 2020-2035
  • Table 23: Latin America Market Value (USD Billion) Forecast by End User, 2020-2035
  • Table 24: Latin America Market Volume (Units) Forecast by End User, 2020-2035
  • Table 25: Western Europe Market Value (USD Billion) Forecast by Country, 2020-2035
  • Table 26: Western Europe Market Volume (Units) Forecast by Country, 2020-2035
  • Table 27: Western Europe Market Value (USD Billion) Forecast by Product Type, 2020-2035
  • Table 28: Western Europe Market Volume (Units) Forecast by Product Type, 2020-2035
  • Table 29: Western Europe Market Value (USD Billion) Forecast by Application, 2020-2035
  • Table 30: Western Europe Market Volume (Units) Forecast by Application, 2020-2035
  • Table 31: Western Europe Market Value (USD Billion) Forecast by End User, 2020-2035
  • Table 32: Western Europe Market Volume (Units) Forecast by End User, 2020-2035
  • Table 33: Eastern Europe Market Value (USD Billion) Forecast by Country, 2020-2035
  • Table 34: Eastern Europe Market Volume (Units) Forecast by Country, 2020-2035
  • Table 35: Eastern Europe Market Value (USD Billion) Forecast by Product Type, 2020-2035
  • Table 36: Eastern Europe Market Volume (Units) Forecast by Product Type, 2020-2035
  • Table 37: Eastern Europe Market Value (USD Billion) Forecast by Application, 2020-2035
  • Table 38: Eastern Europe Market Volume (Units) Forecast by Application, 2020-2035
  • Table 39: Eastern Europe Market Value (USD Billion) Forecast by End User, 2020-2035
  • Table 40: Eastern Europe Market Volume (Units) Forecast by End User, 2020-2035
  • Table 41: East Asia Market Value (USD Billion) Forecast by Country, 2020-2035
  • Table 42: East Asia Market Volume (Units) Forecast by Country, 2020-2035
  • Table 43: East Asia Market Value (USD Billion) Forecast by Product Type, 2020-2035
  • Table 44: East Asia Market Volume (Units) Forecast by Product Type, 2020-2035
  • Table 45: East Asia Market Value (USD Billion) Forecast by Application, 2020-2035
  • Table 46: East Asia Market Volume (Units) Forecast by Application, 2020-2035
  • Table 47: East Asia Market Value (USD Billion) Forecast by End User, 2020-2035
  • Table 48: East Asia Market Volume (Units) Forecast by End User, 2020-2035
  • Table 49: South Asia & Pacific Market Value (USD Billion) Forecast by Country, 2020-2035
  • Table 50: South Asia & Pacific Market Volume (Units) Forecast by Country, 2020-2035
  • Table 51: South Asia & Pacific Market Value (USD Billion) Forecast by Product Type, 2020-2035
  • Table 52: South Asia & Pacific Market Volume (Units) Forecast by Product Type, 2020-2035
  • Table 53: South Asia & Pacific Market Value (USD Billion) Forecast by Application, 2020-2035
  • Table 54: South Asia & Pacific Market Volume (Units) Forecast by Application, 2020-2035
  • Table 55: South Asia & Pacific Market Value (USD Billion) Forecast by End User, 2020-2035
  • Table 56: South Asia & Pacific Market Volume (Units) Forecast by End User, 2020-2035
  • Table 57: Middle East and Africa Market Value (USD Billion) Forecast by Country, 2020-2035
  • Table 58: Middle East and Africa Market Volume (Units) Forecast by Country, 2020-2035
  • Table 59: Middle East and Africa Market Value (USD Billion) Forecast by Product Type, 2020-2035
  • Table 60: Middle East and Africa Market Volume (Units) Forecast by Product Type, 2020-2035
  • Table 61: Middle East and Africa Market Value (USD Billion) Forecast by Application, 2020-2035
  • Table 62: Middle East and Africa Market Volume (Units) Forecast by Application, 2020-2035
  • Table 63: Middle East and Africa Market Value (USD Billion) Forecast by End User, 2020-2035
  • Table 64: Middle East and Africa Market Volume (Units) Forecast by End User, 2020-2035

List of Figures

  • Figure 1: Global Market Volume (Units) Forecast 2020-2035
  • Figure 2: Global Market Pricing Analysis
  • Figure 3: Global Market Value (USD Billion) Forecast 2020-2035
  • Figure 4: Global Market Value Share and BPS Analysis by Product Type, 2025 and 2035
  • Figure 5: Global Market Y-o-Y Growth Comparison by Product Type, 2025-2035
  • Figure 6: Global Market Attractiveness Analysis by Product Type
  • Figure 7: Global Market Value Share and BPS Analysis by Application, 2025 and 2035
  • Figure 8: Global Market Y-o-Y Growth Comparison by Application, 2025-2035
  • Figure 9: Global Market Attractiveness Analysis by Application
  • Figure 10: Global Market Value Share and BPS Analysis by End User, 2025 and 2035
  • Figure 11: Global Market Y-o-Y Growth Comparison by End User, 2025-2035
  • Figure 12: Global Market Attractiveness Analysis by End User
  • Figure 13: Global Market Value (USD Billion) Share and BPS Analysis by Region, 2025 and 2035
  • Figure 14: Global Market Y-o-Y Growth Comparison by Region, 2025-2035
  • Figure 15: Global Market Attractiveness Analysis by Region
  • Figure 16: North America Market Incremental $ Opportunity, 2025-2035
  • Figure 17: Latin America Market Incremental $ Opportunity, 2025-2035
  • Figure 18: Western Europe Market Incremental $ Opportunity, 2025-2035
  • Figure 19: Eastern Europe Market Incremental $ Opportunity, 2025-2035
  • Figure 20: East Asia Market Incremental $ Opportunity, 2025-2035
  • Figure 21: South Asia & Pacific Market Incremental $ Opportunity, 2025-2035
  • Figure 22: Middle East and Africa Market Incremental $ Opportunity, 2025-2035
  • Figure 23: North America Market Value Share and BPS Analysis by Country, 2025 and 2035
  • Figure 24: North America Market Value Share and BPS Analysis by Product Type, 2025 and 2035
  • Figure 25: North America Market Y-o-Y Growth Comparison by Product Type, 2025-2035
  • Figure 26: North America Market Attractiveness Analysis by Product Type
  • Figure 27: North America Market Value Share and BPS Analysis by Application, 2025 and 2035
  • Figure 28: North America Market Y-o-Y Growth Comparison by Application, 2025-2035
  • Figure 29: North America Market Attractiveness Analysis by Application
  • Figure 30: North America Market Value Share and BPS Analysis by End User, 2025 and 2035
  • Figure 31: North America Market Y-o-Y Growth Comparison by End User, 2025-2035
  • Figure 32: North America Market Attractiveness Analysis by End User
  • Figure 33: Latin America Market Value Share and BPS Analysis by Country, 2025 and 2035
  • Figure 34: Latin America Market Value Share and BPS Analysis by Product Type, 2025 and 2035
  • Figure 35: Latin America Market Y-o-Y Growth Comparison by Product Type, 2025-2035
  • Figure 36: Latin America Market Attractiveness Analysis by Product Type
  • Figure 37: Latin America Market Value Share and BPS Analysis by Application, 2025 and 2035
  • Figure 38: Latin America Market Y-o-Y Growth Comparison by Application, 2025-2035
  • Figure 39: Latin America Market Attractiveness Analysis by Application
  • Figure 40: Latin America Market Value Share and BPS Analysis by End User, 2025 and 2035
  • Figure 41: Latin America Market Y-o-Y Growth Comparison by End User, 2025-2035
  • Figure 42: Latin America Market Attractiveness Analysis by End User
  • Figure 43: Western Europe Market Value Share and BPS Analysis by Country, 2025 and 2035
  • Figure 44: Western Europe Market Value Share and BPS Analysis by Product Type, 2025 and 2035
  • Figure 45: Western Europe Market Y-o-Y Growth Comparison by Product Type, 2025-2035
  • Figure 46: Western Europe Market Attractiveness Analysis by Product Type
  • Figure 47: Western Europe Market Value Share and BPS Analysis by Application, 2025 and 2035
  • Figure 48: Western Europe Market Y-o-Y Growth Comparison by Application, 2025-2035
  • Figure 49: Western Europe Market Attractiveness Analysis by Application
  • Figure 50: Western Europe Market Value Share and BPS Analysis by End User, 2025 and 2035
  • Figure 51: Western Europe Market Y-o-Y Growth Comparison by End User, 2025-2035
  • Figure 52: Western Europe Market Attractiveness Analysis by End User
  • Figure 53: Eastern Europe Market Value Share and BPS Analysis by Country, 2025 and 2035
  • Figure 54: Eastern Europe Market Value Share and BPS Analysis by Product Type, 2025 and 2035
  • Figure 55: Eastern Europe Market Y-o-Y Growth Comparison by Product Type, 2025-2035
  • Figure 56: Eastern Europe Market Attractiveness Analysis by Product Type
  • Figure 57: Eastern Europe Market Value Share and BPS Analysis by Application, 2025 and 2035
  • Figure 58: Eastern Europe Market Y-o-Y Growth Comparison by Application, 2025-2035
  • Figure 59: Eastern Europe Market Attractiveness Analysis by Application
  • Figure 60: Eastern Europe Market Value Share and BPS Analysis by End User, 2025 and 2035
  • Figure 61: Eastern Europe Market Y-o-Y Growth Comparison by End User, 2025-2035
  • Figure 62: Eastern Europe Market Attractiveness Analysis by End User
  • Figure 63: East Asia Market Value Share and BPS Analysis by Country, 2025 and 2035
  • Figure 64: East Asia Market Value Share and BPS Analysis by Product Type, 2025 and 2035
  • Figure 65: East Asia Market Y-o-Y Growth Comparison by Product Type, 2025-2035
  • Figure 66: East Asia Market Attractiveness Analysis by Product Type
  • Figure 67: East Asia Market Value Share and BPS Analysis by Application, 2025 and 2035
  • Figure 68: East Asia Market Y-o-Y Growth Comparison by Application, 2025-2035
  • Figure 69: East Asia Market Attractiveness Analysis by Application
  • Figure 70: East Asia Market Value Share and BPS Analysis by End User, 2025 and 2035
  • Figure 71: East Asia Market Y-o-Y Growth Comparison by End User, 2025-2035
  • Figure 72: East Asia Market Attractiveness Analysis by End User
  • Figure 73: South Asia & Pacific Market Value Share and BPS Analysis by Country, 2025 and 2035
  • Figure 74: South Asia & Pacific Market Value Share and BPS Analysis by Product Type, 2025 and 2035
  • Figure 75: South Asia & Pacific Market Y-o-Y Growth Comparison by Product Type, 2025-2035
  • Figure 76: South Asia & Pacific Market Attractiveness Analysis by Product Type
  • Figure 77: South Asia & Pacific Market Value Share and BPS Analysis by Application, 2025 and 2035
  • Figure 78: South Asia & Pacific Market Y-o-Y Growth Comparison by Application, 2025-2035
  • Figure 79: South Asia & Pacific Market Attractiveness Analysis by Application
  • Figure 80: South Asia & Pacific Market Value Share and BPS Analysis by End User, 2025 and 2035
  • Figure 81: South Asia & Pacific Market Y-o-Y Growth Comparison by End User, 2025-2035
  • Figure 82: South Asia & Pacific Market Attractiveness Analysis by End User
  • Figure 83: Middle East and Africa Market Value Share and BPS Analysis by Country, 2025 and 2035
  • Figure 84: Middle East and Africa Market Value Share and BPS Analysis by Product Type, 2025 and 2035
  • Figure 85: Middle East and Africa Market Y-o-Y Growth Comparison by Product Type, 2025-2035
  • Figure 86: Middle East and Africa Market Attractiveness Analysis by Product Type
  • Figure 87: Middle East and Africa Market Value Share and BPS Analysis by Application, 2025 and 2035
  • Figure 88: Middle East and Africa Market Y-o-Y Growth Comparison by Application, 2025-2035
  • Figure 89: Middle East and Africa Market Attractiveness Analysis by Application
  • Figure 90: Middle East and Africa Market Value Share and BPS Analysis by End User, 2025 and 2035
  • Figure 91: Middle East and Africa Market Y-o-Y Growth Comparison by End User, 2025-2035
  • Figure 92: Middle East and Africa Market Attractiveness Analysis by End User
  • Figure 93: Global Market - Tier Structure Analysis
  • Figure 94: Global Market - Company Share Analysis

Frequently Asked Questions

What is the projected size of the IgE allergy blood tests market by 2035?

The market is expected to reach USD 53.6 billion by 2035.

What is the CAGR of the IgE allergy blood tests market from 2025 to 2035?

The global market is projected to grow at a CAGR of 4.9% during this period.

Which product type holds the highest share in the IgE allergy blood tests market in 2025?

ELISA testing kits are expected to lead with over 65% market share in 2025.

What is the projected share of aero allergies in the application segment of the IgE allergy blood tests market by 2025?

Aero allergies are expected to hold approximately 70% of the market share in 2025.

Which country is projected to grow fastest in the IgE allergy blood tests market?

The USA is anticipated to be the fastest-growing market with a CAGR of 5.2% from 2025 to 2035.

Explore Similar Insights

Future Market Insights

IgE Allergy Blood Tests Market