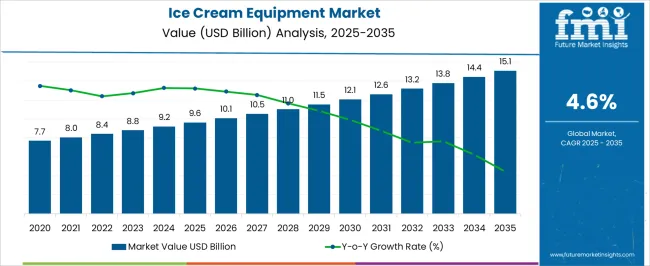
The Ice Cream Equipment Market is estimated to be valued at USD 9.6 billion in 2025 and is projected to reach USD 15.1 billion by 2035, registering a compound annual growth rate (CAGR) of 4.6% over the forecast period.
| Metric | Value |
|---|---|
| Ice Cream Equipment Market Estimated Value in (2025 E) | USD 9.6 billion |
| Ice Cream Equipment Market Forecast Value in (2035 F) | USD 15.1 billion |
| Forecast CAGR (2025 to 2035) | 4.6% |
The Ice Cream Equipment market is experiencing notable growth, supported by increasing global demand for premium and specialty ice cream products. Manufacturers are shifting toward more efficient, automated, and energy-saving equipment to meet evolving consumer preferences and production standards. According to industry-focused news, investor calls, and company statements, the market is being propelled by the surge in commercial-scale ice cream production and the growing need for consistent texture, quality, and hygiene in frozen desserts.
Enhanced focus on customization, clean label formulations, and plant-based alternatives has further increased pressure on producers to invest in advanced machinery capable of adapting to varied product types. Technological innovation in freezing, blending, and packaging has allowed manufacturers to scale operations while maintaining product integrity.
As observed in industry presentations and technology briefings, ongoing developments in energy efficiency and digital monitoring systems have also influenced buying decisions, particularly among medium and large enterprises With demand rising across both developed and emerging regions, the outlook remains optimistic, driven by innovation and market expansion.
The market is segmented by Product Type and Equipment Type and region. By Product Type, the market is divided into Hard Ice Cream Processing Equipment and Soft Ice Cream Processing Equipment. In terms of Equipment Type, the market is classified into Continuous Freezers, Mixing Equipment, Filling Freezers, Homogenizers, Extrusion Equipment, and Moulding Equipment. Regionally, the market is classified into North America, Latin America, Western Europe, Eastern Europe, Balkan & Baltic Countries, Russia & Belarus, Central Asia, East Asia, South Asia & Pacific, and the Middle East & Africa.
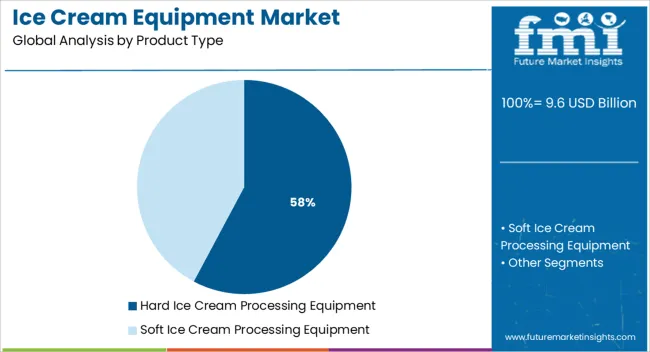
The hard ice cream processing equipment segment is anticipated to lead the Ice Cream Equipment market with a 57.8% revenue share in 2025. This segment’s dominance is being influenced by its widespread use in large-scale commercial production, as outlined in product specifications and corporate press releases. Hard ice cream requires specific processing conditions including rigorous mixing, controlled crystallization, and stable packaging, which these machines are designed to handle efficiently.
It has been observed in technical bulletins that hard ice cream machines are preferred for their ability to maintain consistent texture, manage high-volume outputs, and comply with food safety standards. Manufacturers have adopted these systems for their long-term reliability, automation capabilities, and compatibility with various product formats.
The segment’s continued strength is supported by growing consumer demand for structured frozen desserts and the expansion of global ice cream brands into emerging markets These factors, along with the preference for durable and versatile processing units, are expected to keep this segment at the forefront of industry adoption.
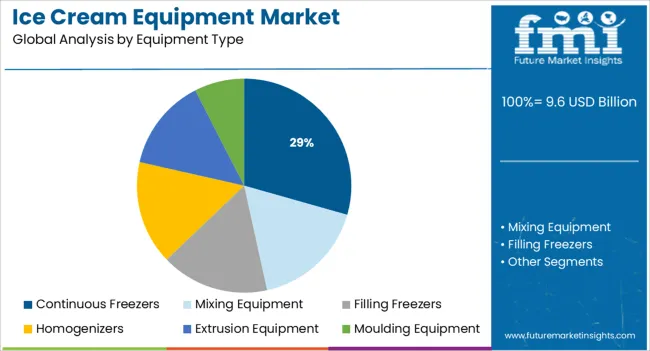
The continuous freezers segment is projected to account for 29.4% of the Ice Cream Equipment market revenue share in 2025. This position is being driven by the segment’s ability to offer uninterrupted and highly efficient production cycles, which are essential for high-demand manufacturing environments. According to equipment manufacturers and technology updates, continuous freezers are increasingly favored due to their superior throughput, precision control over overrun, and capacity for uniform freezing.
The equipment’s design enables integration with downstream packaging and filling systems, allowing manufacturers to streamline operations while maintaining product consistency. Commercial producers have adopted continuous freezing units to ensure scalability, faster production times, and enhanced energy efficiency.
Statements from production managers and engineering leads in published case studies highlight that these systems are vital for maintaining hygiene standards and reducing labor dependency As the global demand for high-quality and efficiently produced ice cream rises, the operational advantages offered by continuous freezers are expected to solidify this segment’s leading role in equipment investments.
The global demand for ice cream equipment is projected to grow at 4.6% CAGR between 203 and 2035 in comparison to the 3.2% CAGR registered during the historical period from 2020 to 2025.
Rising consumption of various types of ice creams and increasing adoption of advanced machines by ice cream manufacturing companies are some of the key factors driving the global ice cream equipment market.
Similarly, innovation in ice cream processing machines, changing lifestyles, and increasing consumer spending are expected to aid in the expansion of the ice cream equipment market during the next ten years.
Growing Popularity of Ice Cream as an Ideal Dessert to Boost Ice Cream Equipment Market
In recent years, ice cream has become one of the most popular desserts across various regions of the world and the trend is likely to continue during the forecast period. This in turn will boost the growth of the ice cream equipment market.
One of the primary reasons that ice cream has become the best dessert is that people can add lots of toppings and flavors. Manufacturers can easily use a wide range of ingredients in ice creams to make them nutritional and more appealing.
Similarly, the development of low-fat and fortified ice creams that are increasingly becoming popular among health-conscious consumers is likely to push the demand for ice cream equipment during the assessment period.
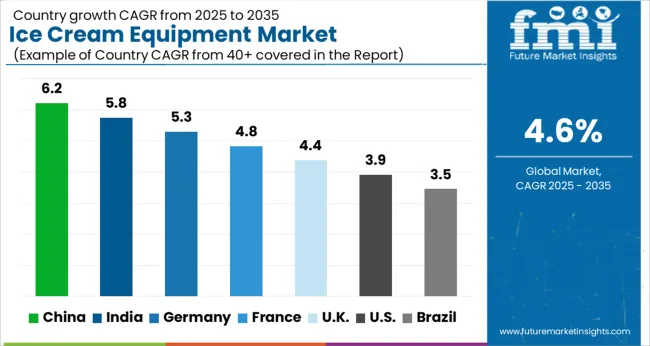
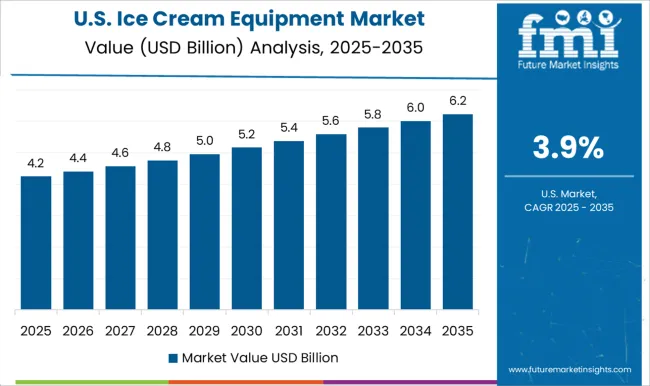
Rising Consumption of Ice Creams Driving Market in the USA.
The US ice cream equipment market is expected to surpass a valuation of USD 9.6 million in 2025 and further expand at a steady pace during the next ten years. This can be attributed to the increasing consumption of ice creams, the availability of technologically advanced machinery, and the booming dairy industry.
Amid changing food habits and rising disposable income, there has been a sharp rise in the consumption of dairy products like ice creams across the US and the trend is likely to continue during the forecast period.
According to the International Dairy Foods Association (IDF), the average American consumes nearly 23 pounds of ice cream and related frozen desserts per year. Driven by this, sales of ice cream equipment across the USA will remain positive during the next ten years.
Rapid Expansion of HoReCa Industry Generating Demand in the UK
As per FMI, the UK ice cream equipment market is currently valued at USD 900.2 Million and it accounts for around 31% share of the Europe ice cream equipment market. Furthermore, emerging trends reveal that the UK will continue to remain the most lucrative ice cream equipment market across Europe during the forecast period.
Factors such as rapid urbanization, the booming dairy industry, and the growing popularity of organic and inorganic ice creams are driving the UK ice cream equipment market.
Similarly, the heavy presence of leading manufacturers, the booming HoReCa sector, and increasing consumer spending are expected to positively influence the sales of ice cream equipment in the country during the projected period.
Rise in the Export of Ice Cream Equipment Boosting Market in China
According to FMI, China's ice cream equipment machine market size is expected to reach over USD 628.3 million in 2025 and further grow at a moderate CAGR over the next decade. Further, China accounts for 34% of the Asia pacific ice cream equipment market, making it one of the leading markets across the region.
Increasing consumption of a variety of ice creams, availability of low-cost machines, and rising export of manufacturing equipment are driving growth in the China ice cream equipment market.
Rising Consumption of Hard Ice Creams Fuelling Demand for Hard Ice Cream Processing Equipment
Based on equipment type, the global ice cream equipment market is segmented into soft ice cream processing equipment and hard ice cream processing equipment. Among these, the hard ice cream processing equipment segment holds the largest revenue share in 2035 while the soft ice cream processing equipment segment is likely to grow at a higher pace.
The rising adoption of hard ice cream processing equipment can be attributed to the increasing consumer preference for hard ice creams worldwide.
Similarly, technological advancements in hard ice cream processing equipment will bode well for the global ice cream equipment market during the projected period.
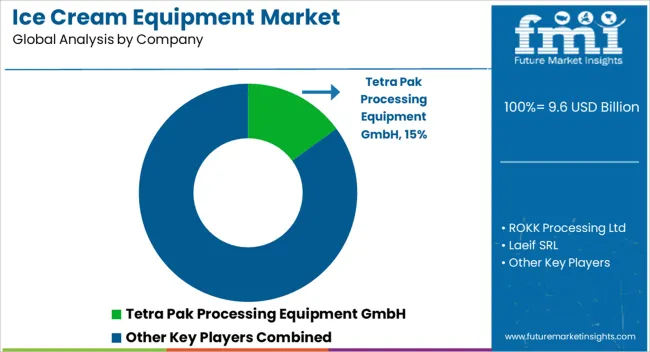
The global ice cream equipment market is highly competitive due to the large presence of domestic and regional market players. To capitalize on the emerging opportunities and increase their revenue share, key manufacturers of ice cream equipment are adopting strategies such as new product launches, mergers, acquisitions, partnerships, and collaborations. For instance,
Ice Cream Lover Rejoice! Carpigiani Group, Tetra Pak Processing Equipment, and Gram Equipment Allowing Consumers to Enjoy the Delicacy of Ice Creams Through Advanced Equipment
Ice cream has become one of the favorite desserts of a large population base throughout the world. As a result, various companies are jumping into this space and introducing novel varieties of ice creams. This has prompted ice cream manufacturers to introduce new and advanced ice cream manufacturing machines.
Carpigiani, an Italian company, has been producing renowned equipment for Italian-style fresh ice cream since 1946. Carpigiani is a subsidiary of the Ali Group, one of the world's major producers and suppliers of food service equipment.
The company is focused on product innovation and expansion to increase its customer base, It is continuously launching a new range of products that focus on improving productivity in ice cream parlors. For example, it has created an innovative line of pumps that are designed to help ice cream shops manage their operations more effectively and efficiently.
Similarly, in July 2024, Carpigiani announced the opening of a new plant dedicated to the production of batch freezers and soft-serve machines.
Another key manufacturer and supplier of ice cream equipment are Tetra Pak. The company offers food processing, packaging, and delivery solutions. Products that may be processed or packed in Tetra Pak processing and packaging lines include dairy products, juices and nectars, ice cream, cheese, dry meals, fruits and vegetables, and pet food. The firm strives to use as little raw materials and energy as possible during the manufacturing and delivery processes.
The firm provides a wide range of goods that are classified into numerous categories, including packages, processing equipment, filling machines, distribution equipment, and service items. It recently (2020) expanded its product range for ice cream producers by acquiring Big Drum Engineering GmbH, a prominent supplier of industrial filling equipment. The transaction expands the company's capacity to deliver end-to-end solutions for food and beverage firms throughout the world, as well as strengthens its worldwide leadership in the industry.
Established in 1901, Gram Equipment has become one of the world's top manufacturers of equipment and solutions for the ice cream business. The company is using strategies such as new product launches and acquisitions to increase sales and expand its footprint.
| Attribute | Details |
|---|---|
| Estimated Market Size (2025) | USD 9.6 billion |
| Projected Market Size (2035) | USD 15.1 billion |
| Anticipated Growth Rate (2025 to 2035) | 4.6% |
| Forecast Period | 2025 to 2035 |
| Historical Data Available for | 2020 to 2025 |
| Market Analysis | USD Million for Value and Units for Volume |
| Key Regions Covered | North America; Latin America; Europe; Asia Pacific; Oceania; Middle East & Africa (MEA) |
| Key Countries Covered | The USA, Canada, Mexico, Germany, The UK, France, Italy, Spain, China, Japan, India, South Korea, Australia, Brazil, Argentina, South Africa, UAE |
| Key Segments Covered | Product Type, Equipment Type, Region |
| Key Companies Profiled | ROKK Processing Ltd; Tetra Pak Processing Equipment GmbH; Gram Equipment A/S; CARPIGIANI Group; Guangzhou Guangshen Electric Produce ; Co. Ltd.; Goma Engineering Pvt. Ltd.; ALFA LAVAL; Technogel SPA; Vojta SRO; CATTA 27 SRL; Ice Group; GEA Group Aktiengesellschaft; TEKNOICE SRL; Laeif SRL; Nanjing Puyuan Ice Cream Machinery ; Manufacturing Co. Ltd.; Clextral; Bonduelle; Dole Food; SVZ International B.V.; Sahyadri Farms; Diana Group S.A.S.; RAJE AGRO FOODS PRIVET LIMITED |
| Report Coverage | Market Forecast, Company Share Analysis, Competitive Landscape, DROT Analysis, Market Dynamics and Challenges, and Strategic Growth Initiatives |
The global ice cream equipment market is estimated to be valued at USD 9.6 billion in 2025.
The market size for the ice cream equipment market is projected to reach USD 15.1 billion by 2035.
The ice cream equipment market is expected to grow at a 4.6% CAGR between 2025 and 2035.
The key product types in ice cream equipment market are hard ice cream processing equipment and soft ice cream processing equipment.
In terms of equipment type, continuous freezers segment to command 29.4% share in the ice cream equipment market in 2025.


Our Research Products

The "Full Research Suite" delivers actionable market intel, deep dives on markets or technologies, so clients act faster, cut risk, and unlock growth.

The Leaderboard benchmarks and ranks top vendors, classifying them as Established Leaders, Leading Challengers, or Disruptors & Challengers.

Locates where complements amplify value and substitutes erode it, forecasting net impact by horizon

We deliver granular, decision-grade intel: market sizing, 5-year forecasts, pricing, adoption, usage, revenue, and operational KPIs—plus competitor tracking, regulation, and value chains—across 60 countries broadly.

Spot the shifts before they hit your P&L. We track inflection points, adoption curves, pricing moves, and ecosystem plays to show where demand is heading, why it is changing, and what to do next across high-growth markets and disruptive tech

Real-time reads of user behavior. We track shifting priorities, perceptions of today’s and next-gen services, and provider experience, then pace how fast tech moves from trial to adoption, blending buyer, consumer, and channel inputs with social signals (#WhySwitch, #UX).

Partner with our analyst team to build a custom report designed around your business priorities. From analysing market trends to assessing competitors or crafting bespoke datasets, we tailor insights to your needs.
Supplier Intelligence
Discovery & Profiling
Capacity & Footprint
Performance & Risk
Compliance & Governance
Commercial Readiness
Who Supplies Whom
Scorecards & Shortlists
Playbooks & Docs
Category Intelligence
Definition & Scope
Demand & Use Cases
Cost Drivers
Market Structure
Supply Chain Map
Trade & Policy
Operating Norms
Deliverables
Buyer Intelligence
Account Basics
Spend & Scope
Procurement Model
Vendor Requirements
Terms & Policies
Entry Strategy
Pain Points & Triggers
Outputs
Pricing Analysis
Benchmarks
Trends
Should-Cost
Indexation
Landed Cost
Commercial Terms
Deliverables
Brand Analysis
Positioning & Value Prop
Share & Presence
Customer Evidence
Go-to-Market
Digital & Reputation
Compliance & Trust
KPIs & Gaps
Outputs
Full Research Suite comprises of:
Market outlook & trends analysis
Interviews & case studies
Strategic recommendations
Vendor profiles & capabilities analysis
5-year forecasts
8 regions and 60+ country-level data splits
Market segment data splits
12 months of continuous data updates
DELIVERED AS:
PDF EXCEL ONLINE
Ice Cream Processing Equipment Market Growth - Trends, Demand & Innovations 2025 to 2035
Ice Cream Coating Market Size and Share Forecast Outlook 2025 to 2035
Ice-cream Premix and Stabilizers Market Size and Share Forecast Outlook 2025 to 2035
Analysis and Growth Projections for Ice Cream and Frozen Dessert Market from 2025 to 2035
Ice Cream Packaging Market - Outlook 2025 to 2035
Ice Cream Service Supplies Market - Premium Serving Essentials 2025 to 2035
Ice Cream Parlor Market Analysis by Type, Product Type, and Region Through 2035
Breaking Down Market Share in the Ice Cream Parlor Industry
Ice Cream Container Market Size & Trends Forecast 2024-2034
Ice-cream Maker Market
A2 Ice Cream Market Size and Share Forecast Outlook 2025 to 2035
Juice Extraction Equipment Market Size and Share Forecast Outlook 2025 to 2035
Foodservice Equipment Market Analysis - Size, Share, and Forecast Outlook 2025 to 2035
Organic Ice Cream Market – Trends & Forecast 2025 to 2035
Market Share Distribution Among Food Service Equipment Companies
Non-Dairy Ice Cream Market Size and Share Forecast Outlook 2025 to 2035
Alcoholic Ice Cream Market
Commercial Ice Equipment and Supplies Market – Industry Trends & Demand 2025-2035
Soft Serve Ice Cream Machines Market
Medical Device & Equipment Tags Market Size and Share Forecast Outlook 2025 to 2035

Thank you!
You will receive an email from our Business Development Manager. Please be sure to check your SPAM/JUNK folder too.
Chat With
MaRIA