Hyperspectral Imaging Market Size and Share Forecast Outlook 2025 to 2035

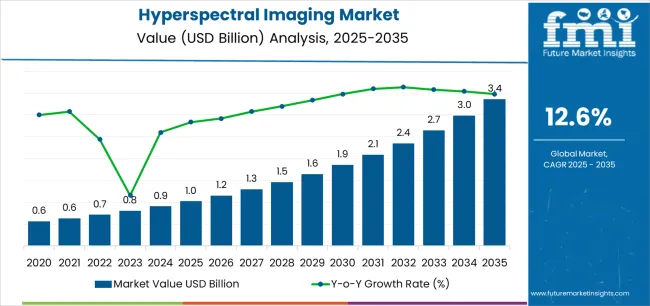
The Hyperspectral Imaging Market is estimated to be valued at USD 1.0 billion in 2025 and is projected to reach USD 3.4 billion by 2035, registering a compound annual growth rate (CAGR) of 12.6% over the forecast period.

The Hyperspectral Imaging market is witnessing steady growth driven by its expanding applications in healthcare, life sciences, agriculture, and industrial inspection. Increasing demand for non-invasive diagnostic techniques, precise material analysis, and quality control solutions is fueling market expansion. The future outlook for this market is shaped by advancements in imaging sensors, data processing algorithms, and integration with AI and machine learning technologies.

Rising awareness of early disease detection, personalized medicine, and advanced research in life sciences is creating opportunities for hyperspectral imaging solutions. Additionally, the development of compact and portable hyperspectral systems is enabling broader adoption across laboratories and field applications.

The market is further supported by increased investment in healthcare infrastructure, research initiatives, and technology-driven monitoring solutions As the need for accurate, high-resolution imaging continues to rise, hyperspectral imaging is anticipated to play a key role in enhancing analytical capabilities, improving operational efficiency, and supporting research and development efforts across diverse sectors, providing sustained growth potential in both established and emerging markets.
Quick Stats for Hyperspectral Imaging Market

  • Hyperspectral Imaging Market Industry Value (2025): USD 1.0 billion
  • Hyperspectral Imaging Market Forecast Value (2035): USD 3.4 billion
  • Hyperspectral Imaging Market Forecast CAGR: 12.6%
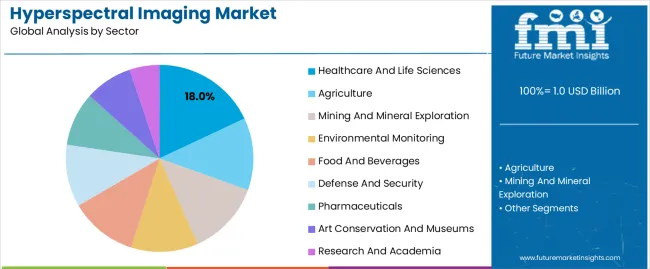
  • Leading Segment in Hyperspectral Imaging Market in 2025: Healthcare And Life Sciences (18.0%)
  • Key Growth Region in Hyperspectral Imaging Market: North America, Asia-Pacific, Europe
  • Top Key Players in Hyperspectral Imaging Market: Headwall Photonics Inc., Galileo Group, Inc., BaySpec Inc., Specim Spectral Imaging Ltd, Corning Incorporated, Surface Optics Corporation, Resonon Inc., HyperMed Imaging Inc., Norsk Elektro Optikk AS, Cubert GmbH, XIMEA GmbH, HinaLea Imaging (TruTag Technologies Inc.), ITRES Research Limited, Telops Inc., Brimrose Corporation of America

Hyperspectral Imaging Market Market Value Analysis

Metric Value
Hyperspectral Imaging Market Estimated Value in (2025 E) USD 1.0 billion
Hyperspectral Imaging Market Forecast Value in (2035 F) USD 3.4 billion
Forecast CAGR (2025 to 2035) 12.6%

Segmental Analysis

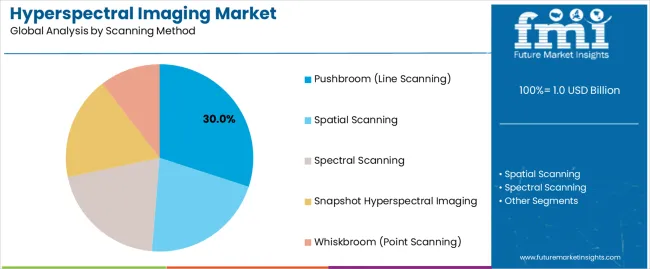
The market is segmented by Sector and Scanning Method and region. By Sector, the market is divided into Healthcare And Life Sciences, Agriculture, Mining And Mineral Exploration, Environmental Monitoring, Food And Beverages, Defense And Security, Pharmaceuticals, Art Conservation And Museums, and Research And Academia. In terms of Scanning Method, the market is classified into Pushbroom (Line Scanning), Spatial Scanning, Spectral Scanning, Snapshot Hyperspectral Imaging, and Whiskbroom (Point Scanning). Regionally, the market is classified into North America, Latin America, Western Europe, Eastern Europe, Balkan & Baltic Countries, Russia & Belarus, Central Asia, East Asia, South Asia & Pacific, and the Middle East & Africa.
Insights into the Healthcare and Life Sciences Sector

Hyperspectral Imaging Market Analysis By Sector

The healthcare and life sciences sector is projected to hold 18.0% of the hyperspectral imaging market revenue share in 2025, establishing it as a leading application segment. This growth is driven by the increasing use of hyperspectral imaging for non-invasive diagnostics, early disease detection, and biomedical research.

The technology allows detailed visualization of tissue composition, molecular signatures, and chemical variations, which supports enhanced clinical decision-making and research outcomes. Rising investments in personalized medicine and advanced healthcare infrastructure have further accelerated the adoption of hyperspectral imaging in laboratories and hospitals.

Additionally, the growing focus on efficient and accurate diagnostic workflows has reinforced the prominence of this sector, as hyperspectral systems provide reliable, high-resolution imaging data for medical analysis and research purposes The integration of AI-driven data processing also enhances predictive insights, operational efficiency, and treatment planning, solidifying the role of healthcare and life sciences as a leading segment in the market.
Insights into the Pushbroom (Line Scanning) Scanning Method

Hyperspectral Imaging Market Analysis By Scanning Method

The pushbroom scanning method is expected to account for 30.0% of the hyperspectral imaging market revenue share in 2025, making it the leading scanning method. Its growth is attributed to the ability to capture high-resolution spectral data across a wide field of view, enabling precise analysis of materials and biological samples.

Pushbroom systems provide superior spatial and spectral fidelity, which is critical for applications in healthcare, life sciences, and industrial quality control. The method’s efficiency in data acquisition and its compatibility with advanced processing algorithms allow real-time imaging and analysis, enhancing operational productivity.

Additionally, the adaptability of pushbroom scanners to integrate with laboratory and field-based imaging setups has increased their adoption across diverse sectors Continuous improvements in sensor technology, coupled with the rising demand for detailed and accurate spectral information, have reinforced the prominence of the pushbroom scanning method as the preferred choice in the hyperspectral imaging market.

Top Hyperspectral Imaging Market Dynamics and Industry Trends

Medical Diagnostics and Life Sciences Sector to Implement Hyperspectral Imaging Profiting Sales

Hyperspectral imaging technology offers potential for non-invasive and real time analysis of biological tissues. This technique is valuable for medical diagnosis and research. Thus by capturing detailed spectral information from tissues this technology can help in early detection of diseases. This technology helps in detecting cancer and assists in surgical procedures by differentiating healthy and abnormal tissues. This technology is used in life science sector for studying cellular structures and analyzing biological processes. This increasing popularity of hyperspectral imaging’s capabilities in healthcare and life sciences is soaring the growth and overall development of this industry.

Advancements in Hyperspectral Camera Technology to accelerate Scope for Imaging Technology in varied Applications

Development of compact, lightweight, and high resolution hyperspectral cameras have made this technology more accessible and cost effective. This technology with camera advancements open scope for various industries. Improvement in data processing algorithms and software have enhanced efficiency of image analysis. It is enabling faster interpretation and extraction of valuable insights.

Technological advancements have opened scope for usage of hyperspectral imaging beyond traditional research and defense applications. This is leading to its adoption in agriculture, food quality assessment, mining, and infrastructure inspection industries. These ongoing advancements in technological have made technicalities accessible to wide range of users have propelled the adoption of this imaging techniques.

Precision Agriculture and Environmental Monitoring to Prosper Hyperspectral Imaging Market

This imaging enables farmers to obtain detailed information about crop health, soil conditions, and vegetation growth. Using hyperspectral cameras mounted on drones or satellites farmers can accurately monitor their fields. They can optimize fertilization and irrigation and detect early signs of diseases or pests.

Hyperspectral imaging in environmental monitoring is being utilized to assess vegetation health and map ecosystems. They can also monitor water quality. This imaging can provide precise and comprehensive data for agricultural and environmental landscape. This adoption by fast paced and broader sector can fuel the growth of hyperspectral imaging market globally.

Challenges in the Hyperspectral Imaging Market

Analysis of hyperspectral data require advance knowledge in remote sensing and spectral analysis. Henceforth, the requirement of computational resources, skilled, and experienced technicians may limit pool of qualified professionals.

Another hurdle in the growth is complexity of the imaging technology and higher operational costs for businesses. Also, ensuring data and security pose roadblocks in the development of infrastructure and software solutions.

Comparison of Historical vs Forecast Outlook for Hyperspectral Imaging Sales 2020 to 2025 vs 2025 to 2035

The global hyperspectral imaging market was projected a markup in sensor technology with developmental and advancement in high resolution imaging techniques. During pandemic, the industry have faced bad fall with global lockdown and shutdown of all the properties. This had very severe impact on its overall revenue and even did demolish many grounds to shutdown permanently.

With recovery in the past few years many investors and developers established several AI integrated and advanced technology imaging systems to grow and explore various applications. Advancement in hyperspectral imaging did make huge difference in agricultural and healthcare sector. Industries like mining and environmental monitoring did see many changes in past decade. Adoption of this technology was an indispensable asset for businesses and organizations looking for optimized solution.

Integration of AI and data analytics advanced operating processing in various sectors. Replacing traditional technique and time saving methods have accelerated the adoption and scope for advanced tool like hyperspectral imaging. Also growth in agricultural and health sector using this technique have generated huge revenues in the overall scenario of global landscape.

Analysis of Top Countries Adopting Hyperspectral Imaging Technology

Below data summarizes regions expanding globally hyperspectral imaging market. Market share and recent development with their current trends are mentioned below. North America is at forefront of this development in this industry with expertise in technology and giant tech ecosystem. Following Asian region with fast paced growth in technological segment with growing tech savvy population.

Region Market Share (%)
North America 35%
East Asia 20%

Tech Prowess to Profit the Hyperspectral Imaging Market in North America

North America's hyperspectral imaging market is experiencing significant growth. Increased government funding for research fuels this expansion. The defense sector, too, heavily invests in this technology.

Environmental monitoring agencies in the United States are also adopting these solutions for precise data collection. Besides this, healthcare institutions use it for advanced medical diagnostics.

The demand for these solutions is also seen in the agriculture industry as they employ it for crop health assessment. The region's focus on precision agriculture boosts market growth. Stringent regulations for food quality control also necessitate hyperspectral solutions.

East Asia to Exhibit Decent Industry Growth in the Coming Years

East Asia's hyperspectral imaging market is rapidly expanding as the region's booming electronics industry drives technological advancements. China's space programs heavily utilize hyperspectral imaging capabilities.

Japan leads in miniaturizing hyperspectral sensors for consumer electronics while South Korea integrates this technology into smartphone cameras. The region's manufacturing sector also adopts these technologies for quality control.

Environmental concerns in densely populated areas have also accelerated their adoption. Precision farming in rice cultivation also benefits from hyperspectral analysis.

Governments are also found to be investing in hyperspectral technology for urban planning. The region's rapid industrialization creates new market opportunities. Apart from this, East Asia's focus on AI integration enhances hyperspectral data analysis.

Hyperspectral Imaging Industry Analysis by Top Investment Segments

Below given data projected leading segment of the industry with their respective share values.

Technology’s Remarkable Capabilities in Advanced Medical Diagnostics and Biomedical Research have posed Healthcare and Life Sciences at Top Segment

Hyperspectral imaging enables healthcare professionals to acquire intricate tissue and cellular data. This technique helps in early detection of diseases and provides critical insights into physiological and pathological characteristics of tissues. Medical professionals across the globe are utilizing this imaging to enhance accuracy of diagnoses and treatment planning. This improves patient outcome and best analysis. Healthcare and life sciences segment has accounted value share of 18.0% in the hyperspectral imaging market in 2025.

Segment Healthcare and Life Sciences (Sector)
Value Share 18.0 %

Integration of hyperspectral imaging into surgical procedures and medical imaging systems have made a remarkable shift in precise, personalized, and effective patient care. This technique have accelerated the outcomes and overall process of healthcare and life sector. This technology have revalorized pathology, surgery, and non-invasive diagnostics with its exceptional qualities. Thus this technology have positioned itself as important driver for transformative advancement in medical research and clinical practices.

Pushbroom Scanning Method captures Detailed Images across a Wide Range of Electromagnetic Spectrum making it Preferred Choice

Pushbroom scanning method offers exceptionally high spectral and spatial resolution. It provides a level of precision that is advantageous in agriculture, environmental monitoring, and healthcare. Push broom scanning method enables efficient data collection over large areas. This make it ideal choice for application like precision agriculture.

Segment Pushbroom (Scanning Method)
Value Share 30.0 %

Pushbroom scanning method have acquired share value of 30% in global hyperspectral imaging market. This method stands out for its ability to seamlessly integrating with advanced data analysis technologies like AI and machine learning algorithms. This integration empowers businesses and organization to derive meaningful insights from hyperspectral data. This is propelling advancements in fields ranging from mining to healthcare.
Key Hyperspectral Imaging Market Players and Competitive Outlook

Hyperspectral Imaging Market Analysis By Company

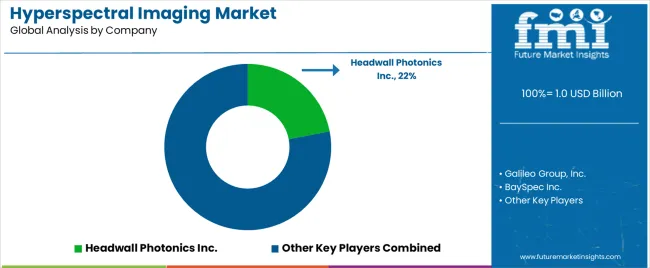
Developers in this industry to define its working in varied sectors. Key players should leverage technological advancements to capture and analyze wide spectrum of light for detailed information across various applications. Players should work on making systems more compact, cost effective and accessible to wider audience.

Startups like FlyGuys, Gamaya, GeologicAI, and Pixxel have immensely expanded in this landscape. They have introduced innovative solutions catering to diverse industry needs. Startups like Pixxel and GeologicAI have democratized access to hyperspectral imaging through their products and services. They have made it more accessible and applicable in real world scenarios.

Industry Update

  • On January 15, 2025, space startup Pixxel announced its plans to launch satellites by mid-year and to have a constellation of 24 satellites by 2025, enabling global coverage with daily revisits.
  • On May 17, 2025, HySpex by NEO was selected as the supplier of a state-of-the-art hyperspectral camera for an in-orbit servicing mission. Their expertise in hyperspectral technology ensured the delivery of a tailored solution.
  • On December 3, 2024, XIMEA released new versions of the xiSpec hyperspectral cameras in collaboration with imec. The xiSpec2 series features improved spectral performance and calibration, while maintaining compact dimensions and lightweight design.
  • On April 21, 2025, KP Labs announced the successful capture of the first hyperspectral images by the Intuition-1 satellite. This marked a significant advancement in Earth observation capabilities, supported by AI onboard data processing.

Leading Companies in the Hyperspectral Imaging Market

  • Galileo Group, Inc.
  • BaySpec Inc.
  • Specim Spectral Imaging Ltd
  • Corning Incorporated
  • Surface Optics Corporation
  • Headwall Photonics Inc.
  • Resonon Inc.
  • HyperMed Imaging Inc.
  • Norsk Elektro Optikk AS
  • Cubert GmbH
  • XIMEA GmbH
  • HinaLea Imaging (TruTag Technologies Inc.)
  • ITRES Research Limited
  • Telops Inc.
  • Brimrose Corporation of America

Top Investment Segments Studied in the Hyperspectral Imaging Market

By Sector:

Hyperspectral imaging industry is applied to agriculture, mining and mineral exploration, environmental monitoring, healthcare and life sciences, food and beverages, defense and security, pharmaceuticals, art conservation and museums, and research and academia sectors.

By Scanning Method:

The segment is categorized into spatial scanning, spectral; scanning, snapshot hyperspectral imaging, pushbroom (line scanning), and whiskbroom (point scanning).

By Region:

A regional analysis has been carried out in key countries of North America, Latin America, Asia Pacific, Middle East and Africa (MEA), and Europe.

Frequently Asked Questions

How big is the hyperspectral imaging market in 2025?

The global hyperspectral imaging market is estimated to be valued at USD 1.0 billion in 2025.

What will be the size of hyperspectral imaging market in 2035?

The market size for the hyperspectral imaging market is projected to reach USD 3.4 billion by 2035.

How much will be the hyperspectral imaging market growth between 2025 and 2035?

The hyperspectral imaging market is expected to grow at a 12.6% CAGR between 2025 and 2035.

What are the key product types in the hyperspectral imaging market?

The key product types in hyperspectral imaging market are healthcare and life sciences, agriculture, mining and mineral exploration, environmental monitoring, food and beverages, defense and security, pharmaceuticals, art conservation and museums and research and academia.

Which scanning method segment to contribute significant share in the hyperspectral imaging market in 2025?

In terms of scanning method, pushbroom (line scanning) segment to command 30.0% share in the hyperspectral imaging market in 2025.

Table of Content

  1. Executive Summary
    • Global Market Outlook
    • Demand-side Trends
    • Supply-side Trends
    • Technology Roadmap Analysis
    • Analysis and Recommendations
  2. Market Overview
    • Market Coverage / Taxonomy
    • Market Definition / Scope / Limitations
  3. Market Background
    • Market Dynamics
      • Drivers
      • Restraints
      • Opportunity
      • Trends
    • Scenario Forecast
      • Demand in Optimistic Scenario
      • Demand in Likely Scenario
      • Demand in Conservative Scenario
    • Opportunity Map Analysis
    • Product Life Cycle Analysis
    • Supply Chain Analysis
    • Investment Feasibility Matrix
    • Value Chain Analysis
    • PESTLE and Porter’s Analysis
    • Regulatory Landscape
    • Regional Parent Market Outlook
    • Production and Consumption Statistics
    • Import and Export Statistics
  4. Global Market Analysis 2020 to 2024 and Forecast, 2025 to 2035
    • Historical Market Size Value (USD Million) Analysis, 2020 to 2024
    • Current and Future Market Size Value (USD Million) Projections, 2025 to 2035
      • Y-o-Y Growth Trend Analysis
      • Absolute $ Opportunity Analysis
  5. Global Market Pricing Analysis 2020 to 2024 and Forecast 2025 to 2035
  6. Global Market Analysis 2020 to 2024 and Forecast 2025 to 2035, By Sector
    • Introduction / Key Findings
    • Historical Market Size Value (USD Million) Analysis By Sector , 2020 to 2024
    • Current and Future Market Size Value (USD Million) Analysis and Forecast By Sector , 2025 to 2035
      • Healthcare And Life Sciences
      • Agriculture
      • Mining And Mineral Exploration
      • Environmental Monitoring
      • Food And Beverages
      • Defense And Security
      • Pharmaceuticals
      • Art Conservation And Museums
      • Research And Academia
    • Y-o-Y Growth Trend Analysis By Sector , 2020 to 2024
    • Absolute $ Opportunity Analysis By Sector , 2025 to 2035
  7. Global Market Analysis 2020 to 2024 and Forecast 2025 to 2035, By Scanning Method
    • Introduction / Key Findings
    • Historical Market Size Value (USD Million) Analysis By Scanning Method, 2020 to 2024
    • Current and Future Market Size Value (USD Million) Analysis and Forecast By Scanning Method, 2025 to 2035
      • Pushbroom (Line Scanning)
      • Spatial Scanning
      • Spectral Scanning
      • Snapshot Hyperspectral Imaging
      • Whiskbroom (Point Scanning)
    • Y-o-Y Growth Trend Analysis By Scanning Method, 2020 to 2024
    • Absolute $ Opportunity Analysis By Scanning Method, 2025 to 2035
  8. Global Market Analysis 2020 to 2024 and Forecast 2025 to 2035, By Region
    • Introduction
    • Historical Market Size Value (USD Million) Analysis By Region, 2020 to 2024
    • Current Market Size Value (USD Million) Analysis and Forecast By Region, 2025 to 2035
      • North America
      • Latin America
      • Western Europe
      • Eastern Europe
      • East Asia
      • South Asia and Pacific
      • Middle East & Africa
    • Market Attractiveness Analysis By Region
  9. North America Market Analysis 2020 to 2024 and Forecast 2025 to 2035, By Country
    • Historical Market Size Value (USD Million) Trend Analysis By Market Taxonomy, 2020 to 2024
    • Market Size Value (USD Million) Forecast By Market Taxonomy, 2025 to 2035
      • By Country
        • USA
        • Canada
        • Mexico
      • By Sector
      • By Scanning Method
    • Market Attractiveness Analysis
      • By Country
      • By Sector
      • By Scanning Method
    • Key Takeaways
  10. Latin America Market Analysis 2020 to 2024 and Forecast 2025 to 2035, By Country
    • Historical Market Size Value (USD Million) Trend Analysis By Market Taxonomy, 2020 to 2024
    • Market Size Value (USD Million) Forecast By Market Taxonomy, 2025 to 2035
      • By Country
        • Brazil
        • Chile
        • Rest of Latin America
      • By Sector
      • By Scanning Method
    • Market Attractiveness Analysis
      • By Country
      • By Sector
      • By Scanning Method
    • Key Takeaways
  11. Western Europe Market Analysis 2020 to 2024 and Forecast 2025 to 2035, By Country
    • Historical Market Size Value (USD Million) Trend Analysis By Market Taxonomy, 2020 to 2024
    • Market Size Value (USD Million) Forecast By Market Taxonomy, 2025 to 2035
      • By Country
        • Germany
        • UK
        • Italy
        • Spain
        • France
        • Nordic
        • BENELUX
        • Rest of Western Europe
      • By Sector
      • By Scanning Method
    • Market Attractiveness Analysis
      • By Country
      • By Sector
      • By Scanning Method
    • Key Takeaways
  12. Eastern Europe Market Analysis 2020 to 2024 and Forecast 2025 to 2035, By Country
    • Historical Market Size Value (USD Million) Trend Analysis By Market Taxonomy, 2020 to 2024
    • Market Size Value (USD Million) Forecast By Market Taxonomy, 2025 to 2035
      • By Country
        • Russia
        • Poland
        • Hungary
        • Balkan & Baltic
        • Rest of Eastern Europe
      • By Sector
      • By Scanning Method
    • Market Attractiveness Analysis
      • By Country
      • By Sector
      • By Scanning Method
    • Key Takeaways
  13. East Asia Market Analysis 2020 to 2024 and Forecast 2025 to 2035, By Country
    • Historical Market Size Value (USD Million) Trend Analysis By Market Taxonomy, 2020 to 2024
    • Market Size Value (USD Million) Forecast By Market Taxonomy, 2025 to 2035
      • By Country
        • China
        • Japan
        • South Korea
      • By Sector
      • By Scanning Method
    • Market Attractiveness Analysis
      • By Country
      • By Sector
      • By Scanning Method
    • Key Takeaways
  14. South Asia and Pacific Market Analysis 2020 to 2024 and Forecast 2025 to 2035, By Country
    • Historical Market Size Value (USD Million) Trend Analysis By Market Taxonomy, 2020 to 2024
    • Market Size Value (USD Million) Forecast By Market Taxonomy, 2025 to 2035
      • By Country
        • India
        • ASEAN
        • Australia & New Zealand
        • Rest of South Asia and Pacific
      • By Sector
      • By Scanning Method
    • Market Attractiveness Analysis
      • By Country
      • By Sector
      • By Scanning Method
    • Key Takeaways
  15. Middle East & Africa Market Analysis 2020 to 2024 and Forecast 2025 to 2035, By Country
    • Historical Market Size Value (USD Million) Trend Analysis By Market Taxonomy, 2020 to 2024
    • Market Size Value (USD Million) Forecast By Market Taxonomy, 2025 to 2035
      • By Country
        • Kingdom of Saudi Arabia
        • Other GCC Countries
        • Turkiye
        • South Africa
        • Other African Union
        • Rest of Middle East & Africa
      • By Sector
      • By Scanning Method
    • Market Attractiveness Analysis
      • By Country
      • By Sector
      • By Scanning Method
    • Key Takeaways
  16. Key Countries Market Analysis
    • USA
      • Pricing Analysis
      • Market Share Analysis, 2024
        • By Sector
        • By Scanning Method
    • Canada
      • Pricing Analysis
      • Market Share Analysis, 2024
        • By Sector
        • By Scanning Method
    • Mexico
      • Pricing Analysis
      • Market Share Analysis, 2024
        • By Sector
        • By Scanning Method
    • Brazil
      • Pricing Analysis
      • Market Share Analysis, 2024
        • By Sector
        • By Scanning Method
    • Chile
      • Pricing Analysis
      • Market Share Analysis, 2024
        • By Sector
        • By Scanning Method
    • Germany
      • Pricing Analysis
      • Market Share Analysis, 2024
        • By Sector
        • By Scanning Method
    • UK
      • Pricing Analysis
      • Market Share Analysis, 2024
        • By Sector
        • By Scanning Method
    • Italy
      • Pricing Analysis
      • Market Share Analysis, 2024
        • By Sector
        • By Scanning Method
    • Spain
      • Pricing Analysis
      • Market Share Analysis, 2024
        • By Sector
        • By Scanning Method
    • France
      • Pricing Analysis
      • Market Share Analysis, 2024
        • By Sector
        • By Scanning Method
    • India
      • Pricing Analysis
      • Market Share Analysis, 2024
        • By Sector
        • By Scanning Method
    • ASEAN
      • Pricing Analysis
      • Market Share Analysis, 2024
        • By Sector
        • By Scanning Method
    • Australia & New Zealand
      • Pricing Analysis
      • Market Share Analysis, 2024
        • By Sector
        • By Scanning Method
    • China
      • Pricing Analysis
      • Market Share Analysis, 2024
        • By Sector
        • By Scanning Method
    • Japan
      • Pricing Analysis
      • Market Share Analysis, 2024
        • By Sector
        • By Scanning Method
    • South Korea
      • Pricing Analysis
      • Market Share Analysis, 2024
        • By Sector
        • By Scanning Method
    • Russia
      • Pricing Analysis
      • Market Share Analysis, 2024
        • By Sector
        • By Scanning Method
    • Poland
      • Pricing Analysis
      • Market Share Analysis, 2024
        • By Sector
        • By Scanning Method
    • Hungary
      • Pricing Analysis
      • Market Share Analysis, 2024
        • By Sector
        • By Scanning Method
    • Kingdom of Saudi Arabia
      • Pricing Analysis
      • Market Share Analysis, 2024
        • By Sector
        • By Scanning Method
    • Turkiye
      • Pricing Analysis
      • Market Share Analysis, 2024
        • By Sector
        • By Scanning Method
    • South Africa
      • Pricing Analysis
      • Market Share Analysis, 2024
        • By Sector
        • By Scanning Method
  17. Market Structure Analysis
    • Competition Dashboard
    • Competition Benchmarking
    • Market Share Analysis of Top Players
      • By Regional
      • By Sector
      • By Scanning Method
  18. Competition Analysis
    • Competition Deep Dive
      • Headwall Photonics Inc.
        • Overview
        • Product Portfolio
        • Profitability by Market Segments (Product/Age /Sales Channel/Region)
        • Sales Footprint
        • Strategy Overview
          • Marketing Strategy
          • Product Strategy
          • Channel Strategy
      • Galileo Group, Inc.
      • BaySpec Inc.
      • Specim Spectral Imaging Ltd
      • Corning Incorporated
      • Surface Optics Corporation
      • Resonon Inc.
      • HyperMed Imaging Inc.
      • Norsk Elektro Optikk AS
      • Cubert GmbH
      • XIMEA GmbH
      • HinaLea Imaging (TruTag Technologies Inc.)
      • ITRES Research Limited
      • Telops Inc.
      • Brimrose Corporation of America
  19. Assumptions & Acronyms Used
  20. Research Methodology

List of Tables

  • Table 1: Global Market Value (USD Million) Forecast by Region, 2020-2035
  • Table 2: Global Market Value (USD Million) Forecast by Sector , 2020-2035
  • Table 3: Global Market Value (USD Million) Forecast by Scanning Method, 2020-2035
  • Table 4: North America Market Value (USD Million) Forecast by Country, 2020-2035
  • Table 5: North America Market Value (USD Million) Forecast by Sector , 2020-2035
  • Table 6: North America Market Value (USD Million) Forecast by Scanning Method, 2020-2035
  • Table 7: Latin America Market Value (USD Million) Forecast by Country, 2020-2035
  • Table 8: Latin America Market Value (USD Million) Forecast by Sector , 2020-2035
  • Table 9: Latin America Market Value (USD Million) Forecast by Scanning Method, 2020-2035
  • Table 10: Western Europe Market Value (USD Million) Forecast by Country, 2020-2035
  • Table 11: Western Europe Market Value (USD Million) Forecast by Sector , 2020-2035
  • Table 12: Western Europe Market Value (USD Million) Forecast by Scanning Method, 2020-2035
  • Table 13: Eastern Europe Market Value (USD Million) Forecast by Country, 2020-2035
  • Table 14: Eastern Europe Market Value (USD Million) Forecast by Sector , 2020-2035
  • Table 15: Eastern Europe Market Value (USD Million) Forecast by Scanning Method, 2020-2035
  • Table 16: East Asia Market Value (USD Million) Forecast by Country, 2020-2035
  • Table 17: East Asia Market Value (USD Million) Forecast by Sector , 2020-2035
  • Table 18: East Asia Market Value (USD Million) Forecast by Scanning Method, 2020-2035
  • Table 19: South Asia and Pacific Market Value (USD Million) Forecast by Country, 2020-2035
  • Table 20: South Asia and Pacific Market Value (USD Million) Forecast by Sector , 2020-2035
  • Table 21: South Asia and Pacific Market Value (USD Million) Forecast by Scanning Method, 2020-2035
  • Table 22: Middle East & Africa Market Value (USD Million) Forecast by Country, 2020-2035
  • Table 23: Middle East & Africa Market Value (USD Million) Forecast by Sector , 2020-2035
  • Table 24: Middle East & Africa Market Value (USD Million) Forecast by Scanning Method, 2020-2035

List of Figures

  • Figure 1: Global Market Pricing Analysis
  • Figure 2: Global Market Value (USD Million) Forecast 2020-2035
  • Figure 3: Global Market Value Share and BPS Analysis by Sector , 2025 and 2035
  • Figure 4: Global Market Y-o-Y Growth Comparison by Sector , 2025-2035
  • Figure 5: Global Market Attractiveness Analysis by Sector
  • Figure 6: Global Market Value Share and BPS Analysis by Scanning Method, 2025 and 2035
  • Figure 7: Global Market Y-o-Y Growth Comparison by Scanning Method, 2025-2035
  • Figure 8: Global Market Attractiveness Analysis by Scanning Method
  • Figure 9: Global Market Value (USD Million) Share and BPS Analysis by Region, 2025 and 2035
  • Figure 10: Global Market Y-o-Y Growth Comparison by Region, 2025-2035
  • Figure 11: Global Market Attractiveness Analysis by Region
  • Figure 12: North America Market Incremental Dollar Opportunity, 2025-2035
  • Figure 13: Latin America Market Incremental Dollar Opportunity, 2025-2035
  • Figure 14: Western Europe Market Incremental Dollar Opportunity, 2025-2035
  • Figure 15: Eastern Europe Market Incremental Dollar Opportunity, 2025-2035
  • Figure 16: East Asia Market Incremental Dollar Opportunity, 2025-2035
  • Figure 17: South Asia and Pacific Market Incremental Dollar Opportunity, 2025-2035
  • Figure 18: Middle East & Africa Market Incremental Dollar Opportunity, 2025-2035
  • Figure 19: North America Market Value Share and BPS Analysis by Country, 2025 and 2035
  • Figure 20: North America Market Value Share and BPS Analysis by Sector , 2025 and 2035
  • Figure 21: North America Market Y-o-Y Growth Comparison by Sector , 2025-2035
  • Figure 22: North America Market Attractiveness Analysis by Sector
  • Figure 23: North America Market Value Share and BPS Analysis by Scanning Method, 2025 and 2035
  • Figure 24: North America Market Y-o-Y Growth Comparison by Scanning Method, 2025-2035
  • Figure 25: North America Market Attractiveness Analysis by Scanning Method
  • Figure 26: Latin America Market Value Share and BPS Analysis by Country, 2025 and 2035
  • Figure 27: Latin America Market Value Share and BPS Analysis by Sector , 2025 and 2035
  • Figure 28: Latin America Market Y-o-Y Growth Comparison by Sector , 2025-2035
  • Figure 29: Latin America Market Attractiveness Analysis by Sector
  • Figure 30: Latin America Market Value Share and BPS Analysis by Scanning Method, 2025 and 2035
  • Figure 31: Latin America Market Y-o-Y Growth Comparison by Scanning Method, 2025-2035
  • Figure 32: Latin America Market Attractiveness Analysis by Scanning Method
  • Figure 33: Western Europe Market Value Share and BPS Analysis by Country, 2025 and 2035
  • Figure 34: Western Europe Market Value Share and BPS Analysis by Sector , 2025 and 2035
  • Figure 35: Western Europe Market Y-o-Y Growth Comparison by Sector , 2025-2035
  • Figure 36: Western Europe Market Attractiveness Analysis by Sector
  • Figure 37: Western Europe Market Value Share and BPS Analysis by Scanning Method, 2025 and 2035
  • Figure 38: Western Europe Market Y-o-Y Growth Comparison by Scanning Method, 2025-2035
  • Figure 39: Western Europe Market Attractiveness Analysis by Scanning Method
  • Figure 40: Eastern Europe Market Value Share and BPS Analysis by Country, 2025 and 2035
  • Figure 41: Eastern Europe Market Value Share and BPS Analysis by Sector , 2025 and 2035
  • Figure 42: Eastern Europe Market Y-o-Y Growth Comparison by Sector , 2025-2035
  • Figure 43: Eastern Europe Market Attractiveness Analysis by Sector
  • Figure 44: Eastern Europe Market Value Share and BPS Analysis by Scanning Method, 2025 and 2035
  • Figure 45: Eastern Europe Market Y-o-Y Growth Comparison by Scanning Method, 2025-2035
  • Figure 46: Eastern Europe Market Attractiveness Analysis by Scanning Method
  • Figure 47: East Asia Market Value Share and BPS Analysis by Country, 2025 and 2035
  • Figure 48: East Asia Market Value Share and BPS Analysis by Sector , 2025 and 2035
  • Figure 49: East Asia Market Y-o-Y Growth Comparison by Sector , 2025-2035
  • Figure 50: East Asia Market Attractiveness Analysis by Sector
  • Figure 51: East Asia Market Value Share and BPS Analysis by Scanning Method, 2025 and 2035
  • Figure 52: East Asia Market Y-o-Y Growth Comparison by Scanning Method, 2025-2035
  • Figure 53: East Asia Market Attractiveness Analysis by Scanning Method
  • Figure 54: South Asia and Pacific Market Value Share and BPS Analysis by Country, 2025 and 2035
  • Figure 55: South Asia and Pacific Market Value Share and BPS Analysis by Sector , 2025 and 2035
  • Figure 56: South Asia and Pacific Market Y-o-Y Growth Comparison by Sector , 2025-2035
  • Figure 57: South Asia and Pacific Market Attractiveness Analysis by Sector
  • Figure 58: South Asia and Pacific Market Value Share and BPS Analysis by Scanning Method, 2025 and 2035
  • Figure 59: South Asia and Pacific Market Y-o-Y Growth Comparison by Scanning Method, 2025-2035
  • Figure 60: South Asia and Pacific Market Attractiveness Analysis by Scanning Method
  • Figure 61: Middle East & Africa Market Value Share and BPS Analysis by Country, 2025 and 2035
  • Figure 62: Middle East & Africa Market Value Share and BPS Analysis by Sector , 2025 and 2035
  • Figure 63: Middle East & Africa Market Y-o-Y Growth Comparison by Sector , 2025-2035
  • Figure 64: Middle East & Africa Market Attractiveness Analysis by Sector
  • Figure 65: Middle East & Africa Market Value Share and BPS Analysis by Scanning Method, 2025 and 2035
  • Figure 66: Middle East & Africa Market Y-o-Y Growth Comparison by Scanning Method, 2025-2035
  • Figure 67: Middle East & Africa Market Attractiveness Analysis by Scanning Method
  • Figure 68: Global Market - Tier Structure Analysis
  • Figure 69: Global Market - Company Share Analysis
Dashboard
Dashboard
Dashboard
Dashboard
Dashboard
Dashboard

Full Research Suite comprises of:

Market outlook & trends analysis

Market outlook & trends analysis

Interviews & case studies

Interviews & case studies

Strategic recommendations

Strategic recommendations

Vendor profiles & capabilities analysis

Vendor profiles & capabilities analysis

5-year forecasts

5-year forecasts

8 regions and 60+ country-level data splits

8 regions and 60+ country-level data splits

Market segment data splits

Market segment data splits

12 months of continuous data updates

12 months of continuous data updates

DELIVERED AS:

PDF EXCEL ONLINE

Full Research Suite


$5000

$7500

$10000

Buy Report Now
Similar Industry Reports

Similar Industry Reports

Hyperspectral Imaging Camera Market

Hyperspectral Imaging Camera Market Size and Share Forecast Outlook 2025 to 2035

Hyperspectral Imaging for Seal Integrity Market

Hyperspectral Imaging for Seal Integrity Market Analysis Size and Share Forecast Outlook 2025 to 2035

Medical Hyperspectral Imaging Market

Medical Hyperspectral Imaging Market - Growth, Demand & Forecast 2024 to 2034

Imaging Markers Market

Imaging Markers Market Analysis - Size, Share, and Forecast Outlook 2025 to 2035

3D Imaging Surgical Solution Market

3D Imaging Surgical Solution Market Size and Share Forecast Outlook 2025 to 2035

Gel Imaging Documentation Market

Gel Imaging Documentation Market Size and Share Forecast Outlook 2025 to 2035

PET Imaging Workflow Market

PET Imaging Workflow Market Analysis - Size, Share, and Forecast Outlook 2025 to 2035

Brain Imaging And Neuroimaging Market

Brain Imaging and Neuroimaging Market Size and Share Forecast Outlook 2025 to 2035

Dental Imaging Equipment Market

Dental Imaging Equipment Market Forecast and Outlook 2025 to 2035

Remote Imaging Collaboration Market

Remote Imaging Collaboration Market Analysis - Size, Share, and Forecast Outlook 2025 to 2035

Aerial Imaging Market Share Analysis

Competitive Overview of Aerial Imaging Market Share

Aerial Imaging Market

Aerial Imaging Market Growth - Trends & Forecast 2025 to 2035

Breast Imaging Market

Breast Imaging Market Analysis - Size, Share & Growth Forecast 2024 to 2034

Spinal Imaging Market

Spinal Imaging Market Trends – Growth, Demand & Forecast 2022-2032

Hybrid Imaging System Market

Hybrid Imaging System Market

Optical Imaging Market

Optical Imaging Market Size and Share Forecast Outlook 2025 to 2035

Quantum Imaging Devices Market

Quantum Imaging Devices Market Analysis - Size, Share, and Forecast Outlook 2025 to 2035

Medical Imaging Software Market

Medical Imaging Software Market Size and Share Forecast Outlook 2025 to 2035

Nuclear Imaging Devices Market

Nuclear Imaging Devices Market Size and Share Forecast Outlook 2025 to 2035

Urology Imaging Systems Market

Urology Imaging Systems Market Size and Share Forecast Outlook 2025 to 2035

Future Market Insights

Hyperspectral Imaging Market

Chat With MaRIA

Chat With

MaRIA

Hi There, I am MaRIA, Your Market Research Intelligence Assistant. How may I help you?