The global hybrid rice seeds market is projected to grow from USD 5.9 billion in 2025 to USD 12.4 billion by 2035, registering a CAGR of 7.7%.
The market expansion is being driven by the increasing demand for higher yields, improved seed quality, and enhanced resistance to pests and diseases. Government initiatives, particularly in countries like India and China, are pushing the adoption of hybrid rice varieties to meet food security demands. Hybrid rice seeds are also gaining popularity due to their adaptability to various climatic conditions, including drought and salinity tolerance, which make them ideal for regions with challenging agricultural environments.
The market holds varying shares across its parent markets. It commands approximately 15% of the global agricultural seeds market, driven by the demand for high-yield and disease-resistant varieties. In the crop seeds market, it represents around 5%, reflecting its key role in rice cultivation. Although indirectly related, the hybrid rice seeds market contributes about 1% to the food and beverage market through increased rice production.
Within the agricultural equipment market, it holds a minimal share of less than 1%, as the equipment is generally designed for broader agricultural applications. Finally, in the seed treatment market, hybrid rice seeds account for roughly 3%, due to the necessity of specific treatments for enhanced germination and pest resistance.
Government regulations in major rice-producing countries such as India and China focus on ensuring food security, enhancing agricultural productivity, and promoting sustainable farming practices. Programs like India's National Food Security Mission (NFSM) and China's Super Rice Breeding Program are pushing the adoption of hybrid rice seeds to address the needs of growing populations.
These regulations, alongside initiatives in other Asian countries such as Vietnam and Indonesia, are accelerating the demand for high-yielding, disease-resistant hybrid rice seeds, ensuring that agriculture can keep up with the increasing food demand in the coming decades.
Japan is projected to be the fastest-growing market, with an expected CAGR of 8% from 2025 to 2035. Long grains will lead the grain size segment with a 50% share, while the 111 to 140 days will dominate the duration segment with a 40% share. The UK and Germany markets are also expected to grow steadily at CAGRs of 7.4% and 7.8%, respectively. The USA market is anticipated to grow at a CAGR of 7.2%, while France will witness moderate growth at a 7.7% CAGR.
Supply chain management considerations demonstrate unique challenges related to international seed trade and phytosanitary compliance for hybrid rice products. Seed companies must implement enhanced tracking systems to ensure compliance with import certification requirements while managing inventory across different regulatory jurisdictions. Distribution networks require specialized handling procedures for hybrid seeds that may have different storage and transportation requirements compared to conventional varieties, creating operational cost implications that influence pricing strategies.
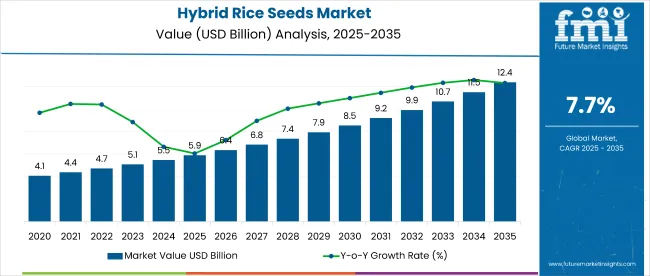
The market is segmented by grain size, duration, and region. By grain size, the market is divided into long grains, medium-sized grains, and short grains. In terms of duration, the market is classified into up to 110 days, 111 to 140 days, and 140+ days. Regionally, the market is categorized into North America, Latin America, Europe, Asia Pacific, and the Middle East & Africa.
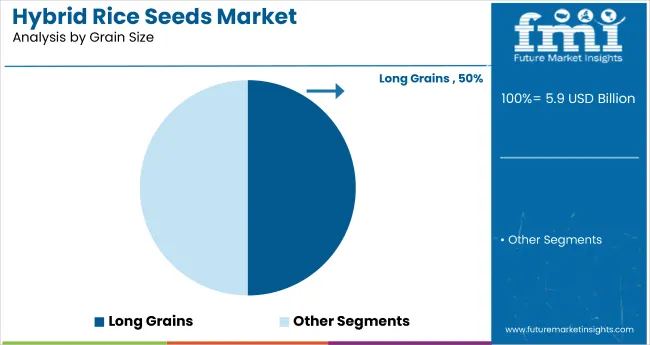
Long grains are projected to lead the grain size segment, capturing 50% of the market share by 2025. These varieties are gaining preference in the UK, USA, Japan, Germany, and France for their higher yield and longer shelf life.
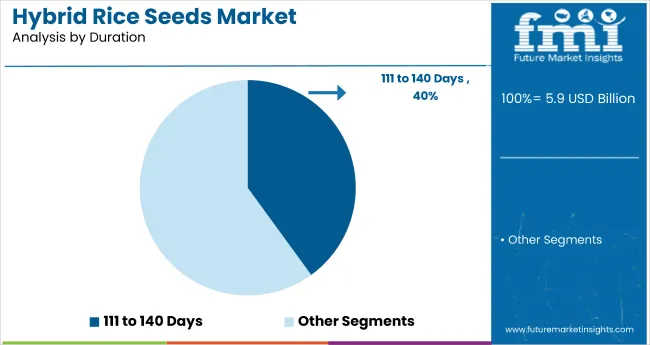
Hybrid rice seeds with a growing duration of 111 to 140 days are expected to lead the duration segment, capturing 40% of the global market share by 2025, favored for their optimal yield and adaptability.
The global hybrid rice seeds market is experiencing steady growth, driven by the increasing demand for higher yields, improved pest resistance, and the need to meet food security challenges across regions. Hybrid rice seeds play a crucial role in enhancing agricultural productivity and ensuring food supply stability.
Recent Trends in the Hybrid Rice Seeds Market
Challenges in the Hybrid Rice Seeds Market
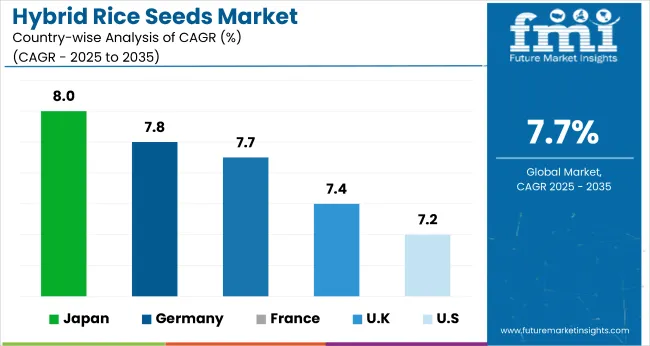
Japan's momentum is driven by advanced agricultural technologies and government-driven food security initiatives. Germany and France maintain steady demand, supported by EU sustainability goals and funding for agricultural modernization under the Green Deal. In contrast, developed economies like the USA (7.2% CAGR), UK (7.4%), and Japan (8%) are expected to expand at a steady 0.91-1.05x of the global growth rate.
The Japan hybrid rice seed market is experiencing the highest growth, driven by advancements in technology and precision farming. Germany and France both exhibit strong growth, fueled by EU sustainability goals and climate resilience measures. The USA follows closely with robust demand, especially from research-driven farming programs in states like Arkansas and Louisiana.
The UK has the slowest growth rate, influenced by post-Brexit regulatory challenges, but continues to show steady demand in small- and medium-scale organic farming. Overall, Japan leads in growth, while the UK sees the most modest expansion among these countries.
The report covers in-depth analysis of 40+ countries; five top-performing OECD countries are highlighted below.
The Japan hybrid rice seed revenue is growing at a CAGR of 8% from 2025 to 2035. Growth is driven by agricultural modernization and government policies focused on sustainable rice production. Japan’s technology-driven agricultural landscape prioritizes high-efficiency hybrid varieties, integrated with automated farming systems.
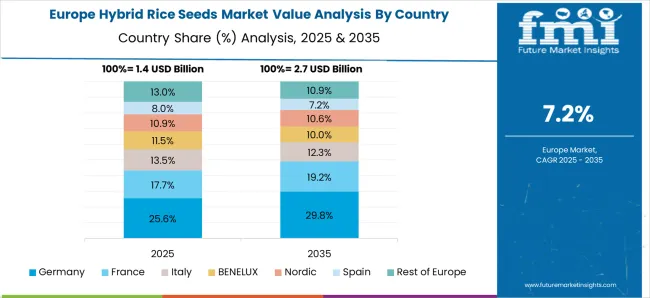
The sales of hybrid rice seeds in Germany are expected to expand at 7.8% CAGR during the forecast period, slightly below the global average but strongly regulation-led. EU food security goals, climate change adaptation measures, and sustainable farming practices are driving the adoption of hybrid rice seeds.
The French hybrid rice seed market is projected to grow at a 7.7% CAGR during the forecast period, in line with the global market growth rate. Demand is driven by national food security targets, sustainable farming regulations, and regional rice cultivation initiatives. Hybrid rice seeds are being adopted in regions requiring efficient and eco-friendly farming solutions.
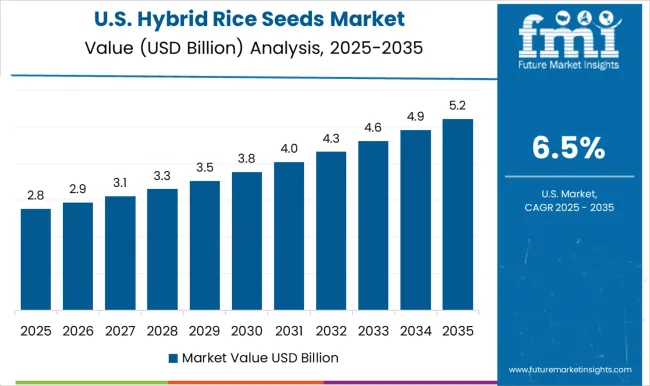
The USA hybrid rice seed market is projected to grow at a 7.2% CAGR from 2025 to 2035, translating to 0.93x the global growth rate. USA demand is primarily driven by research and technology adoption in rice farming, especially in states like Arkansas and Louisiana. The market is focused on improving yield and pest resistance in hybrid rice varieties, supporting food security.
The UK hybrid rice seed revenue is projected to grow at a 7.4% CAGR from 2025 to 2035, slightly below the global average. Growth is supported by government initiatives promoting sustainable agriculture, with increasing interest in hybrid varieties that offer better yield and resilience.
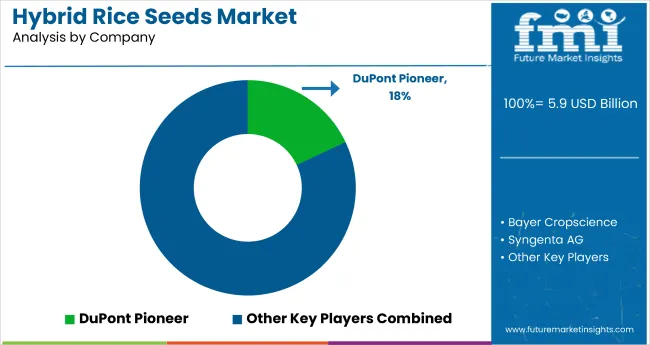
The Hybrid Rice Seeds Market is expanding steadily as global demand for high-yield, pest-resistant, and climate-resilient rice varieties continues to rise. Leading agribusinesses such as Syngenta AG and Bayer AG are at the forefront, developing next-generation hybrid rice varieties that combine high productivity with improved grain quality and resistance to biotic and abiotic stresses. These companies are investing heavily in R&D and biotechnology platforms to strengthen food security in Asia, Africa, and Latin America.
UPL Ltd., Nath Bio-Genes Ltd., and Nirmal Seeds Pvt. Ltd. are focusing on hybrid seed development tailored for tropical and subtropical conditions, emphasizing water-use efficiency and adaptability to diverse soil types. Biostadt India Ltd. is integrating bio-stimulants and seed treatment innovations to enhance germination and early growth, supporting higher farm productivity.
In China, Yuan Longping High-Tech Agriculture Co. Ltd. leads with its pioneering work in super hybrid rice technologies, achieving record yields and driving large-scale adoption across Asian markets. Nuziveedu Seeds Ltd. and Advanta Limited are expanding their portfolios across South and Southeast Asia, combining local breeding expertise with advanced genetic screening to improve yield stability. RiceTec Inc., a key player in North America, continues to advance hybrid rice seed innovation with a focus on sustainability, traceability, and grain quality enhancement for premium segments.
| Report Attributes | Details |
|---|---|
| Market Size (2025) | USD 5.9 billion |
| Projected Market Size (2035) | USD 12.4 billion |
| CAGR (2025 to 2035) | 7.7% |
| Base Year for Estimation | 2024 |
| Historical Period | 2020 to 2024 |
| Projections Period | 2025 to 2035 |
| Report Parameter | USD billion for value/ volume in metric tons |
| Grain Size Analyzed | Long Grains, Medium-Sized Grains, Sand hort Grains |
| Duration Analyzed | 111 to 140 Days, 140+ Days, and Up To 110 Days |
| Region Analyzed | North America, Latin America, Western Europe, South Asia, East Asia, Eastern Europe, Middle East & Africa |
| Countries Covered | United States, United Kingdom, Germany, France, Japan, China, India, Brazil, South Korea, Australia add this 40+ countries in report scope |
| Key Players Influencing the Market |
Syngenta AG, Bayer AG, UPL Ltd., Nath Bio-Genes Ltd., Nirmal Seeds Pvt. Ltd., Biostadt India Ltd., Yuan Longping High-Tech Agriculture Co. Ltd., Nuziveedu Seeds Ltd., RiceTec Inc., Advanta Limited |
| Additional Attributes | Dollar sales by grain size, share by duration, regional demand growth, policy influence, government support, competitive benchmarking |
The global hybrid rice seeds market is estimated to be valued at USD 5.9 billion in 2025.
The market size for the hybrid rice seeds market is projected to reach USD 12.4 billion by 2035.
The hybrid rice seeds market is expected to grow at a 7.7% CAGR between 2025 and 2035.
The key product types in hybrid rice seeds market are long grains, medium-sized grains and short grains.
In terms of durability, up to 110 days segment to command 47.6% share in the hybrid rice seeds market in 2025.


Our Research Products

The "Full Research Suite" delivers actionable market intel, deep dives on markets or technologies, so clients act faster, cut risk, and unlock growth.

The Leaderboard benchmarks and ranks top vendors, classifying them as Established Leaders, Leading Challengers, or Disruptors & Challengers.

Locates where complements amplify value and substitutes erode it, forecasting net impact by horizon

We deliver granular, decision-grade intel: market sizing, 5-year forecasts, pricing, adoption, usage, revenue, and operational KPIs—plus competitor tracking, regulation, and value chains—across 60 countries broadly.

Spot the shifts before they hit your P&L. We track inflection points, adoption curves, pricing moves, and ecosystem plays to show where demand is heading, why it is changing, and what to do next across high-growth markets and disruptive tech

Real-time reads of user behavior. We track shifting priorities, perceptions of today’s and next-gen services, and provider experience, then pace how fast tech moves from trial to adoption, blending buyer, consumer, and channel inputs with social signals (#WhySwitch, #UX).

Partner with our analyst team to build a custom report designed around your business priorities. From analysing market trends to assessing competitors or crafting bespoke datasets, we tailor insights to your needs.
Supplier Intelligence
Discovery & Profiling
Capacity & Footprint
Performance & Risk
Compliance & Governance
Commercial Readiness
Who Supplies Whom
Scorecards & Shortlists
Playbooks & Docs
Category Intelligence
Definition & Scope
Demand & Use Cases
Cost Drivers
Market Structure
Supply Chain Map
Trade & Policy
Operating Norms
Deliverables
Buyer Intelligence
Account Basics
Spend & Scope
Procurement Model
Vendor Requirements
Terms & Policies
Entry Strategy
Pain Points & Triggers
Outputs
Pricing Analysis
Benchmarks
Trends
Should-Cost
Indexation
Landed Cost
Commercial Terms
Deliverables
Brand Analysis
Positioning & Value Prop
Share & Presence
Customer Evidence
Go-to-Market
Digital & Reputation
Compliance & Trust
KPIs & Gaps
Outputs
Full Research Suite comprises of:
Market outlook & trends analysis
Interviews & case studies
Strategic recommendations
Vendor profiles & capabilities analysis
5-year forecasts
8 regions and 60+ country-level data splits
Market segment data splits
12 months of continuous data updates
DELIVERED AS:
PDF EXCEL ONLINE
Hybrid Seeds Market Size and Share Forecast Outlook 2025 to 2035
Hybrid Sleeve Cartridges Market Analysis - Size and Share Forecast Outlook 2025 to 2035
Hybrid Reactive Power and Harmonic Compensation Device Market Size and Share Forecast Outlook 2025 to 2035
Hybrid Vision Sensor Chips Market Size and Share Forecast Outlook 2025 to 2035
Rice Bran Fatty Alcohols Market Size and Share Forecast Outlook 2025 to 2035
Hybrid Printing Market Forecast Outlook 2025 to 2035
Rice Water Skincare Market Forecast and Outlook 2025 to 2035
Hybrid Boat Market Size and Share Forecast Outlook 2025 to 2035
Hybrid Metal-Paper Seamers Market Size and Share Forecast Outlook 2025 to 2035
Rice Water Haircare Market Size and Share Forecast Outlook 2025 to 2035
Rice Shampoo Bar Market Size and Share Forecast Outlook 2025 to 2035
Hybrid Sealing-Cut Machines Market Analysis - Size and Share Forecast Outlook 2025 to 2035
Hybrid Powertrain Market Size and Share Forecast Outlook 2025 to 2035
Hybrid Additive Manufacturing Machines Market Size and Share Forecast Outlook 2025 to 2035
Hybrid Integration Platform Market Size and Share Forecast Outlook 2025 to 2035
Rice Bran Oil for Skin Care Market Size and Share Forecast Outlook 2025 to 2035
Rice Bran Oil Infusions Market Analysis - Size and Share Forecast Outlook 2025 to 2035
Hybrid Marine Gensets Market Size and Share Forecast Outlook 2025 to 2035
Rice Milling Machine Market Size and Share Forecast Outlook 2025 to 2035
Hybrid Meat Products Market Size and Share Forecast Outlook 2025 to 2035

Thank you!
You will receive an email from our Business Development Manager. Please be sure to check your SPAM/JUNK folder too.
Chat With
MaRIA