Humectants Market Outlook from 2025 to 2035

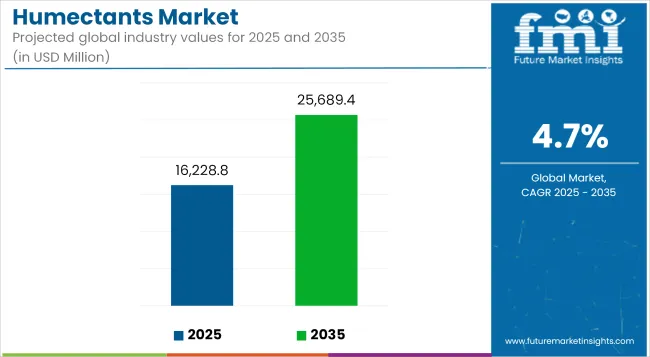
Between 2025 and 2035, the humectants market is projected to gain momentum on the back of increasing application of moisture retaining ingredients across food & beverages, cosmetics, personal care and pharmaceutical sectors. Increasing consumer inclination towards clean-label, skin-friendly, and naturally derived products is driving up the use of plant-based humectants. It is estimated that the market is going to be worth USD 16,228.8 million in 2025 and USD 25,689.4 million in 2035, hearing a compound annual growth rate (CAGR) of 4.7% throughout the forecast period.

Hygroscopic humectants retain moisture by absorbing water molecules from the surrounding atmosphere. They have a number of uses in formulations to help improve thickness, preserve foods, and increase stability of products. Some of the most common humectants include glycerine, sorbitol, hyaluronic acid and propylene glycol, with new plant-based options coming to the forefront as clean beauty and health-conscious trends take hold.

Market Metrics

Metric Value (USD)
Industry Size (2025E) USD 16,228.8 million
Industry Value (2035F) USD 25,689.4 million
CAGR (2025 to 2035) 4.7%

Manufacturers are also creating multifunctional humectants, which provide hydration while delivering some antioxidant, antimicrobial or soothing effects. Humectants are increasingly used in vegan food formulations and clean-label skincare. Bio-based options are regaining a focus in the name of sustainability, while synthetics like propylene glycol are undergoing reformulations to lessen irritation potential. Increasing regulatory scrutiny on ingredient safety and claims regarding origin of products is impacting R&D direction across geographies.

Regional Market Trends

North America

The North American market continues to be a significant consumer of humectants driven by high demand from cosmetics, pharmaceuticals, and processed foods. There is an extensive use of natural humectants in skin hydration products and low-calorie sweeteners, as well as functional beverages in the United States. Innovation in ingredient portfolios is driven by regulatory clarity through the FDA, a growing adoption of cruelty-free and vegan-certified formulations being sought after.

Europe

Changes driven by strong clean beauty developments in Europe, as well as their regulatory landscape that incentivizes safe, natural, and traceable ingredients further drive market growth. Germany, France, the UK, these countries are investing in eco-conscious personal care formulations, with humectants including glycerine and hyaluronic acid as major moisture players. Furthermore, food & beverage manufacturers are widening the application scope of humectants in sugar-free confectionery and baked products.

Asia-Pacific

Rising consumer awareness of ingredients for topical use has the potential to drive growth in humectants, specifically in the Asia-Pacific region which accounts for high consumption and production of high volume humectants with the popularity of functional foods and mass-scale cosmetic manufacturing hubs.

The main markets are China, Japan, South Korea, and India, with fast growth of tree-free personal care brands that include plant-based humectants like aloe Vera and honey extracts. This has been the main factor for pharmaceutical applications also growing, driven by the aging population in the region and OTC skin hydration treatment.

Challenges and Opportunities

Challenges

Regulatory Pressures and Safety Perception

Manufacturers are under increasing scrutiny regarding the use of synthetic humectants, such as propylene glycol and polyethylene glycol, which are on regulatory watch lists in various countries over concerns about skin sensitivity and toxicity. Evolving ingredient regulations and increasing consumer demand for transparency on labels are driving brands to reformulate and substantiate claims about ingredient safety and sustainability.

Opportunities

Demand for Natural and Multifunctional Formulations

This trend towards natural, organic and multifunctional ingredients creates tremendous potential for humectant suppliers. Consumers are also turning to plant-derived versions, such as glycerine from coconut or soy, honey-based variations, and hyaluronic acid for their skin care. These ingredients are increasingly well-known in the market to not only support hydration, but also speak to clean-label, cruelty-free and sustainable product positioning.

Shifts in the Humectants Market from 2020 to 2024 and Future Trends 2025 to 2035

The demand for humectants market remained strong from year 2020 to 2024 due to its wide application scope in market for personal care and cosmetics, food & beverage, and pharmaceutical sectors. Humectants (glycerine, sorbitol, propylene glycol, hyaluronic acid), so-called because they attract moisture, gained popularity, and use spiked as consumers became more aware of skincare and wellness during COVID-19. Consumers embraced health-conscious, hydration-forward formulations, fuelling demand for natural and plant-based humectants.

It hasn’t been smooth sailing for the market. Price volatility in petrochemical-based ingredients, increasing regulatory scrutiny around synthetic components and an expanded call for clean-label transparency were driving reformulation strategies across industries. The theme of sustainable sourcing, ethical manufacturing and ingredient traceability, rose as the holy grail for brand innovation and consumer loyalty.

As such, the period 2025 to 2035 could see the humectants market driven by biotechnology-led ingredient innovation, integration into personalized skincare and functional nutrition. Bio-fermented and upcycled humectants will come into their own, while AI-driven formulation systems will optimize blends according to climate, skin type or dietary needs. Pain and opportunity exist, and the collision of beauty, wellness, and sustainability will detail the next-gen product pipelines and supply chain models.

Market Shifts: A Comparative Analysis (2020 to 2024 vs. 2025 to 2035)

Market Shift 2020 to 2024 Trends
Regulatory Landscape Compliance with IFRA, REACH, FDA, and national cosmetics/food codes; focus on allergen and toxicity disclosures.
Technological Innovation Use of traditional humectants (e.g., glycerol, sorbitol); early incorporation of naturally derived hyaluronic acid.
Industry Adoption Personal care, food preservation, and pharma dominated use; hydration claims on the rise in wellness products.
Smart & AI-Enabled Solutions Formulations guided by R&D teams using static databases and traditional efficacy testing.
Market Competition Led by Dow, BASF, Cargill, Ashland, and Roquette; product range centered on proven multifunctional humectants.
Market Growth Drivers Hydration-focused personal care trends, sugar alcohol use in foods, and growing pharma applications.
Sustainability and Environmental Impact Gradual shift from synthetic to natural humectants; concerns over palm derivatives and petrochemical bases.
Integration of AI & Digitalization ERP systems and formulation databases for ingredient management.
Advancements in Product Design Focus on cost-effective humectant blending for moisture retention and stability.
Market Shift 2025 to 2035 Projections
Regulatory Landscape Tighter global transparency laws, mandatory ingredient origin disclosure, carbon footprint labeling, and biodegradable certification frameworks.
Technological Innovation Rise of lab-engineered humectants, precision fermentation techniques, encapsulated moisture systems, and AI-optimized absorption matrices.
Industry Adoption Expanded use in climate-adaptive skincare, plant-based meat texturizers, smart wound care, and bio-personalized nutrition supplements.
Smart & AI-Enabled Solutions AI-powered ingredient synergy engines, climate-aware skincare platforms, and real-time feedback loops between consumer wearables and product design.
Market Competition Entry of biotech firms, direct-to-lab skincare startups, and agricultural waste valorisation players producing novel humectant compounds.
Market Growth Drivers Climate-resilient beauty, sustainability mandates, biocompatible packaging trends, and wellness stack integrations in personalized care platforms.
Sustainability and Environmental Impact Sourcing from food/agricultural waste, carbon-neutral fermentation processes, water-saving ingredient production, and closed-loop packaging ecosystems.
Integration of AI & Digitalization AI-led R&D modelling , blockchain-based traceability in sourcing, and real-time personalization based on user biosignal and geographic humidity.
Advancements in Product Design Creation of smart humectant complexes for timed hydration release, multifunctional ingredient systems (e.g., humectant + antioxidant), and sensorial enhanced textures.

Country-wise Outlook

United States

The USA humectants market is one of the major owing to high demand with personal care, food & beverage and pharmaceutical industries growing steadily. Humectants such as glycerine and hyaluronic acid are key ingredients in moisturising and anti-ageing skincare/cosmetic formulations. The growth of clean-label beauty and health conscious food products are also driving the market. The surge in R&D of multifunctional ingredients and growing consumer consciousness regarding skin wellness adds fuel to the market traction.

Country CAGR (2025 to 2035)
USA 5.0%

United Kingdom

With a surge in the demand for natural content in personal care and wellness products, the humectants market is witnessing an upsurge in the UK. With the rising appeal of clean beauty, the use of humectants such as honey, sorbitol, and aloe Vera extract have surged in cosmetics. Also, the food industry is adopting humectants to improve palace moisture retention and increase shelf life in confectionery and bakery products. Regulatory backing for safer, transparent formulations further supports sustained market growth.

Country CAGR (2025 to 2035)
UK 4.5%

European Union

With widespread use in cosmetics, food preservation, and oral care products, the laws of humectants in the EU is a most growing area. Germany, France, and Italy are some of the countries performing strongly on consumption due to their developed consumer goods industries, and their focus on product quality and sustainability.

And data with regulatory force, like EU standards in favour of safe, bio-based ingredients, has led many manufacturers to look for humectants sourced from nature. Humectants popular in the food industry are used for maintaining moisture equilibrium and texture in ready-to-eat meals and sugar-free confections.

Region CAGR (2025 to 2035)
EU 4.6%

Japan

The humectants market in Japan is going gradually with the influence on the country’s developed beauty industry and aging population. Humectants are instrumental for moisture retention and sensitivity control in functional skincare, haircare, and oral hygiene products.

Japanese consumers value quality, purity, and gentle formulations, and have been leaning toward natural humectants, fuelling demand. Food and pharmaceutical applications mainly in functional snacks and health supplements - are further contributing to broader market growth.

Country CAGR (2025 to 2035)
Japan 4.4%

South Korea

The potentially strong humectants market in South Korea is driven in part by the county's world-leading beauty and personal care industry. The K-beauty industry’s obsession with dewy, hydrates skin has put humectants front and center as a key ingredient in serums, creams and masks.

Domestic manufacturers are also looking to innovate with sugar alcohols and amino acid-based humectants that fit in with the clean beauty trend. They are also increasingly used in the manufacturing of processed foods and health drinks, a trend underpinned by the increasing consumption of functional and convenience products.

Country CAGR (2025 to 2035)
South Korea 4.8%

Category-wise Insights

Sugar Alcohols Lead the Humectants Market by Product Type

Product Type Market Share (2025)

Product Type Value Share (%)
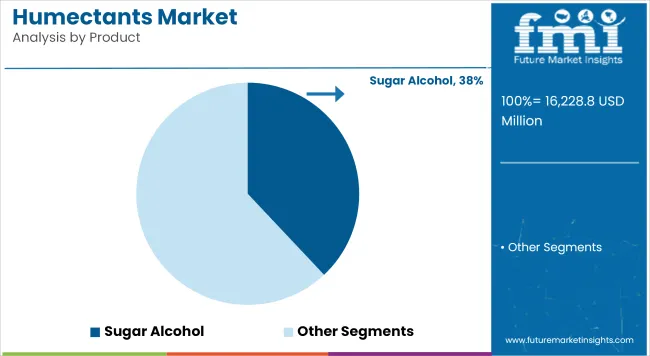
Sugar Alcohol 38.2%

Sugar alcohols are expected to represent 38.2% of the global humectants market value by 2025, becoming the most lucrative type of product. Such compounds - sorbitol, xylitol, maltitol, etc. are extensively applied in food, cosmetics and pharmaceuticals due to their moisture-retaining, low-calorie, naturally sweet properties.

In particular, sugar alcohols work effectively as a sweetener & humectant in sugar-free confectionary, baked items, chewing gum & personal care products that require moisture balance & texture management. Thanks to the fact they do not promote tooth decay, they are also ideal as ingredients in dental health products and diabetic-friendly foods.

As demand increases for clean-label, functional, and reduced-sugar products, sugar alcohols are forecast to continue to be a choice of choice for manufacturers across multiple sectors and will maintain its dominant position in the humectants landscape.

Food & Beverage Segment Dominates the Humectants Market by Application

Application Market Share (2025)

Application Value Share (%)
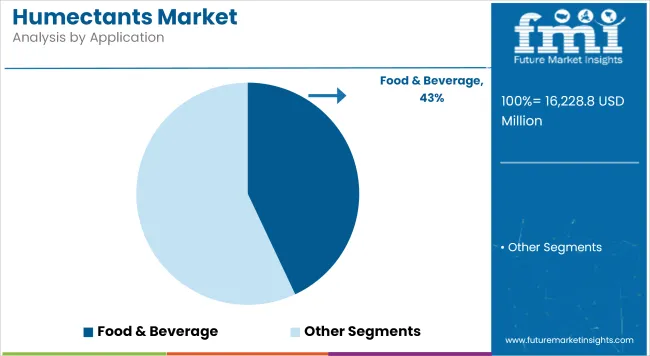
Food & Beverage 41.7%

This non-toxic characteristic of humectants allows them to take up water in numerous applications, which is anticipated to foster growth in the industry. In 2025, food & beverage, based on application, is anticipated to dominate the humectants market, where 41.7% of total value of humectants market derives from food & beverage segment. Humectants are used in food processing for moisture retention, shelf-life extension, improvement of mouthfeel, and freshness maintenance in products such as baked foods, confections, jams, and syrups.

Such components are essential for delivering product stability in fluctuating storage environments, but also for the development of low- and no-sugar products that align with current health expectations of consumers. Humectants are integral to shaping the development of food trends like functional foods, clean label and sugar reduction.

The continued growing food & beverage industry in developing markets and premiumization in developed regions upholds consistent demand for humectants because of their multifunctional properties.

Competitive Outlook

Humectants are substances that are particularly effective in enhancing the moisture retention in both texture and shelf life of various goods. Glycerine, sorbitol, propylene glycol and hyaluronic acid are among the most common humectants. Market growth is attributed to the rising consumer preference toward clean-label, multi-functional ingredients, advancements in bio-based formulations, and the growing trend of sustainable and natural alternatives for cosmetics and food applications.

Market Share Analysis by Key Players

Company/Organization Name Estimated Market Share (%)
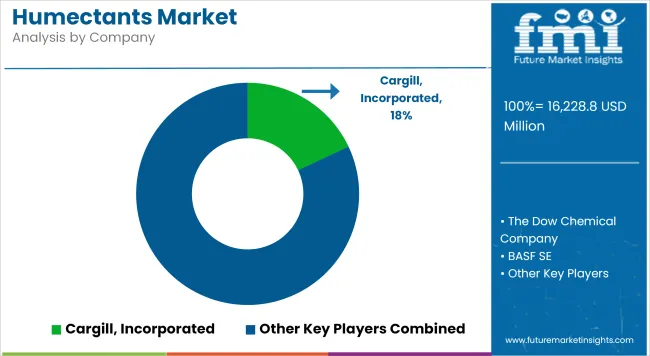
Cargill, Incorporated 15 - 18%
The Dow Chemical Company 13 - 16%
BASF SE 10 - 14%
Archer Daniels Midland Company 8 - 11%
Roquette Frères 6 - 9%
Others 32 - 38%

Key Company & Market Offerings

Company/Organization Name Key Offerings/Activities
Cargill, Incorporated In 2024, Cargill expanded its portfolio of naturally derived humectants for use in clean-label bakery, confectionery, and personal care products.
The Dow Chemical Company Released a new line of multifunctional humectants in 2023, including propylene glycol blends designed for pharmaceutical and industrial use.
BASF SE In 2025, BASF launched plant-based personal care humectants with strong moisturizing properties, targeting premium skincare and haircare brands.
Archer Daniels Midland (ADM) Expanded sorbitol production in 2024 to meet increasing demand from the beverage, oral care, and nutraceutical industries.
Roquette Frères Introduced sustainable sugar-derived humectants for food preservation and cosmetic hydration applications, aligning with EU clean beauty trends.

Key Market Insights

Cargill, Incorporated (15-18%)

A key global supplier of food-grade humectants, Cargill focuses on naturally sourced, GMO-free ingredients for F&B and personal care markets, supported by broad distribution and regulatory compliance.

The Dow Chemical Company (13-16%)

Dow leads in synthetic and multifunctional humectants for industrial, pharmaceutical, and hygiene applications, offering reliable performance and regulatory approvals across geographies.

BASF SE (10-14%)

BASF’s strength lies in R&D-driven innovation, particularly in the personal care space, where it provides high-purity, sensory-enhancing humectants aligned with consumer wellness trends.

Archer Daniels Midland Company (8-11%)

ADM specializes in carbohydrate-based humectants like sorbitol and maltitol, with strong positions in oral care, beverage stabilization, and low-calorie sweetener markets.

Roquette Frères (6-9%)

Roquette is known for plant-based, biodegradable humectant solutions catering to clean-label demands in food, pharma, and dermocosmetic, with deep roots in European markets.

Other Key Players (Combined Share: 32-38%)

Numerous regional and niche producers support market diversity by supplying customized, application-specific, and sustainable humectant formulations for emerging markets and specialty segments:

  • Ashland Global Holdings Inc.- Offers bio-based humectants and moisture-retention agents for high-performance skin and hair care applications.
  • Givaudan Active Beauty- Supplies hyaluronic acid and glycerine alternatives for hydration-centric cosmetic lines, emphasizing natural origin and efficacy.
  • Vantage Specialty Ingredients- Provides multifunctional emollients and humectants for personal care products with a focus on sensorial texture and water binding.
  • Tate & Lyle PLC- Delivers sweetener-derived humectants used in sugar-free and low-calorie food and beverage applications.
  • Symrise AG- Offers humectants with dual functionality (hydration + preservation) for use in fragrances, skincare, and oral hygiene formulations.

Key Segments Covered in the Humectants Market Industry Survey

By Product:

  • Sugar Alcohol
  • Alpha Hydroxy Acid
  • Glycols
  • Others

By Application:

  • Food & Beverage
  • Oral & Personal Care
  • Pharmaceuticals
  • Others

By Region:

  • North America
  • Latin America
  • Europe
  • Asia Pacific
  • Middle East & Africa

Table of Content

  1. Executive Summary
  2. Industry Introduction, including Taxonomy and Market Definition
  3. Market Trends and Success Factors, including Macro-Economic Factors, Market Dynamics, and Recent Industry Developments
  4. Global Market Demand Analysis 2020 to 2024 and Forecast 2025 to 2035, including Historical Analysis and Future Projections
  5. Global Market Analysis 2020 to 2024 and Forecast 2025 to 2035
    • Product
    • Application
  6. Global Market Analysis 2020 to 2024 and Forecast 2025 to 2035, By Product
    • Sugar Alcohol
    • Alpha Hydroxy Acid
    • Glycols
    • Others
  7. Global Market Analysis 2020 to 2024 and Forecast 2025 to 2035, By Application
    • Food & Beverage
    • Oral & Personal Care
    • Pharmaceuticals
    • Others
  8. Global Market Analysis 2020 to 2024 and Forecast 2025 to 2035, By Region
    • North America
    • Latin America
    • Western Europe
    • Eastern Europe
    • East Asia
    • South Asia Pacific
    • Middle East and Africa
  9. North America Sales Analysis 2020 to 2024 and Forecast 2025 to 2035, by Key Segments and Countries
  10. Latin America Sales Analysis 2020 to 2024 and Forecast 2025 to 2035, by Key Segments and Countries
  11. Western Europe Sales Analysis 2020 to 2024 and Forecast 2025 to 2035, by Key Segments and Countries
  12. Eastern Europe Sales Analysis 2020 to 2024 and Forecast 2025 to 2035, by Key Segments and Countries
  13. East Asia Sales Analysis 2020 to 2024 and Forecast 2025 to 2035, by Key Segments and Countries
  14. South Asia Pacific Sales Analysis 2020 to 2024 and Forecast 2025 to 2035, by Key Segments and Countries
  15. Middle East and Africa Sales Analysis 2020 to 2024 and Forecast 2025 to 2035, by Key Segments and Countries
  16. Sales Forecast 2025 to 2035 by Product and Application for 30 Countries
  17. Competition Outlook, including Market Structure Analysis, Company Share Analysis by Key Players, and Competition Dashboard
  18. Company Profile
    • Cargill, Incorporated
    • The Dow Chemical Company
    • BASF SE
    • Archer Daniels Midland Company
    • Roquette Frères
    • Ashland Global Holdings Inc.
    • Givaudan Active Beauty
    • Vantage Specialty Ingredients
    • Tate & Lyle PLC
    • Symrise AG

List of Tables

Table 1: Global Market Value (US$ Million) Forecast by Region, 2018 to 2033

Table 2: Global Market Volume (Tons) Forecast by Region, 2018 to 2033

Table 3: Global Market Value (US$ Million) Forecast by Product, 2018 to 2033

Table 4: Global Market Volume (Tons) Forecast by Product, 2018 to 2033

Table 5: Global Market Value (US$ Million) Forecast by Application, 2018 to 2033

Table 6: Global Market Volume (Tons) Forecast by Application, 2018 to 2033

Table 7: North America Market Value (US$ Million) Forecast by Country, 2018 to 2033

Table 8: North America Market Volume (Tons) Forecast by Country, 2018 to 2033

Table 9: North America Market Value (US$ Million) Forecast by Product, 2018 to 2033

Table 10: North America Market Volume (Tons) Forecast by Product, 2018 to 2033

Table 11: North America Market Value (US$ Million) Forecast by Application, 2018 to 2033

Table 12: North America Market Volume (Tons) Forecast by Application, 2018 to 2033

Table 13: Latin America Market Value (US$ Million) Forecast by Country, 2018 to 2033

Table 14: Latin America Market Volume (Tons) Forecast by Country, 2018 to 2033

Table 15: Latin America Market Value (US$ Million) Forecast by Product, 2018 to 2033

Table 16: Latin America Market Volume (Tons) Forecast by Product, 2018 to 2033

Table 17: Latin America Market Value (US$ Million) Forecast by Application, 2018 to 2033

Table 18: Latin America Market Volume (Tons) Forecast by Application, 2018 to 2033

Table 19: Europe Market Value (US$ Million) Forecast by Country, 2018 to 2033

Table 20: Europe Market Volume (Tons) Forecast by Country, 2018 to 2033

Table 21: Europe Market Value (US$ Million) Forecast by Product, 2018 to 2033

Table 22: Europe Market Volume (Tons) Forecast by Product, 2018 to 2033

Table 23: Europe Market Value (US$ Million) Forecast by Application, 2018 to 2033

Table 24: Europe Market Volume (Tons) Forecast by Application, 2018 to 2033

Table 25: Asia Pacific Market Value (US$ Million) Forecast by Country, 2018 to 2033

Table 26: Asia Pacific Market Volume (Tons) Forecast by Country, 2018 to 2033

Table 27: Asia Pacific Market Value (US$ Million) Forecast by Product, 2018 to 2033

Table 28: Asia Pacific Market Volume (Tons) Forecast by Product, 2018 to 2033

Table 29: Asia Pacific Market Value (US$ Million) Forecast by Application, 2018 to 2033

Table 30: Asia Pacific Market Volume (Tons) Forecast by Application, 2018 to 2033

Table 31: Middle East and Africa Market Value (US$ Million) Forecast by Country, 2018 to 2033

Table 32: Middle East and Africa Market Volume (Tons) Forecast by Country, 2018 to 2033

Table 33: Middle East and Africa Market Value (US$ Million) Forecast by Product, 2018 to 2033

Table 34: Middle East and Africa Market Volume (Tons) Forecast by Product, 2018 to 2033

Table 35: Middle East and Africa Market Value (US$ Million) Forecast by Application, 2018 to 2033

Table 36: Middle East and Africa Market Volume (Tons) Forecast by Application, 2018 to 2033

List of Figures

Figure 1: Global Market Value (US$ Million) by Product, 2023 to 2033

Figure 2: Global Market Value (US$ Million) by Application, 2023 to 2033

Figure 3: Global Market Value (US$ Million) by Region, 2023 to 2033

Figure 4: Global Market Value (US$ Million) Analysis by Region, 2018 to 2033

Figure 5: Global Market Volume (Tons) Analysis by Region, 2018 to 2033

Figure 6: Global Market Value Share (%) and BPS Analysis by Region, 2023 to 2033

Figure 7: Global Market Y-o-Y Growth (%) Projections by Region, 2023 to 2033

Figure 8: Global Market Value (US$ Million) Analysis by Product, 2018 to 2033

Figure 9: Global Market Volume (Tons) Analysis by Product, 2018 to 2033

Figure 10: Global Market Value Share (%) and BPS Analysis by Product, 2023 to 2033

Figure 11: Global Market Y-o-Y Growth (%) Projections by Product, 2023 to 2033

Figure 12: Global Market Value (US$ Million) Analysis by Application, 2018 to 2033

Figure 13: Global Market Volume (Tons) Analysis by Application, 2018 to 2033

Figure 14: Global Market Value Share (%) and BPS Analysis by Application, 2023 to 2033

Figure 15: Global Market Y-o-Y Growth (%) Projections by Application, 2023 to 2033

Figure 16: Global Market Attractiveness by Product, 2023 to 2033

Figure 17: Global Market Attractiveness by Application, 2023 to 2033

Figure 18: Global Market Attractiveness by Region, 2023 to 2033

Figure 19: North America Market Value (US$ Million) by Product, 2023 to 2033

Figure 20: North America Market Value (US$ Million) by Application, 2023 to 2033

Figure 21: North America Market Value (US$ Million) by Country, 2023 to 2033

Figure 22: North America Market Value (US$ Million) Analysis by Country, 2018 to 2033

Figure 23: North America Market Volume (Tons) Analysis by Country, 2018 to 2033

Figure 24: North America Market Value Share (%) and BPS Analysis by Country, 2023 to 2033

Figure 25: North America Market Y-o-Y Growth (%) Projections by Country, 2023 to 2033

Figure 26: North America Market Value (US$ Million) Analysis by Product, 2018 to 2033

Figure 27: North America Market Volume (Tons) Analysis by Product, 2018 to 2033

Figure 28: North America Market Value Share (%) and BPS Analysis by Product, 2023 to 2033

Figure 29: North America Market Y-o-Y Growth (%) Projections by Product, 2023 to 2033

Figure 30: North America Market Value (US$ Million) Analysis by Application, 2018 to 2033

Figure 31: North America Market Volume (Tons) Analysis by Application, 2018 to 2033

Figure 32: North America Market Value Share (%) and BPS Analysis by Application, 2023 to 2033

Figure 33: North America Market Y-o-Y Growth (%) Projections by Application, 2023 to 2033

Figure 34: North America Market Attractiveness by Product, 2023 to 2033

Figure 35: North America Market Attractiveness by Application, 2023 to 2033

Figure 36: North America Market Attractiveness by Country, 2023 to 2033

Figure 37: Latin America Market Value (US$ Million) by Product, 2023 to 2033

Figure 38: Latin America Market Value (US$ Million) by Application, 2023 to 2033

Figure 39: Latin America Market Value (US$ Million) by Country, 2023 to 2033

Figure 40: Latin America Market Value (US$ Million) Analysis by Country, 2018 to 2033

Figure 41: Latin America Market Volume (Tons) Analysis by Country, 2018 to 2033

Figure 42: Latin America Market Value Share (%) and BPS Analysis by Country, 2023 to 2033

Figure 43: Latin America Market Y-o-Y Growth (%) Projections by Country, 2023 to 2033

Figure 44: Latin America Market Value (US$ Million) Analysis by Product, 2018 to 2033

Figure 45: Latin America Market Volume (Tons) Analysis by Product, 2018 to 2033

Figure 46: Latin America Market Value Share (%) and BPS Analysis by Product, 2023 to 2033

Figure 47: Latin America Market Y-o-Y Growth (%) Projections by Product, 2023 to 2033

Figure 48: Latin America Market Value (US$ Million) Analysis by Application, 2018 to 2033

Figure 49: Latin America Market Volume (Tons) Analysis by Application, 2018 to 2033

Figure 50: Latin America Market Value Share (%) and BPS Analysis by Application, 2023 to 2033

Figure 51: Latin America Market Y-o-Y Growth (%) Projections by Application, 2023 to 2033

Figure 52: Latin America Market Attractiveness by Product, 2023 to 2033

Figure 53: Latin America Market Attractiveness by Application, 2023 to 2033

Figure 54: Latin America Market Attractiveness by Country, 2023 to 2033

Figure 55: Europe Market Value (US$ Million) by Product, 2023 to 2033

Figure 56: Europe Market Value (US$ Million) by Application, 2023 to 2033

Figure 57: Europe Market Value (US$ Million) by Country, 2023 to 2033

Figure 58: Europe Market Value (US$ Million) Analysis by Country, 2018 to 2033

Figure 59: Europe Market Volume (Tons) Analysis by Country, 2018 to 2033

Figure 60: Europe Market Value Share (%) and BPS Analysis by Country, 2023 to 2033

Figure 61: Europe Market Y-o-Y Growth (%) Projections by Country, 2023 to 2033

Figure 62: Europe Market Value (US$ Million) Analysis by Product, 2018 to 2033

Figure 63: Europe Market Volume (Tons) Analysis by Product, 2018 to 2033

Figure 64: Europe Market Value Share (%) and BPS Analysis by Product, 2023 to 2033

Figure 65: Europe Market Y-o-Y Growth (%) Projections by Product, 2023 to 2033

Figure 66: Europe Market Value (US$ Million) Analysis by Application, 2018 to 2033

Figure 67: Europe Market Volume (Tons) Analysis by Application, 2018 to 2033

Figure 68: Europe Market Value Share (%) and BPS Analysis by Application, 2023 to 2033

Figure 69: Europe Market Y-o-Y Growth (%) Projections by Application, 2023 to 2033

Figure 70: Europe Market Attractiveness by Product, 2023 to 2033

Figure 71: Europe Market Attractiveness by Application, 2023 to 2033

Figure 72: Europe Market Attractiveness by Country, 2023 to 2033

Figure 73: Asia Pacific Market Value (US$ Million) by Product, 2023 to 2033

Figure 74: Asia Pacific Market Value (US$ Million) by Application, 2023 to 2033

Figure 75: Asia Pacific Market Value (US$ Million) by Country, 2023 to 2033

Figure 76: Asia Pacific Market Value (US$ Million) Analysis by Country, 2018 to 2033

Figure 77: Asia Pacific Market Volume (Tons) Analysis by Country, 2018 to 2033

Figure 78: Asia Pacific Market Value Share (%) and BPS Analysis by Country, 2023 to 2033

Figure 79: Asia Pacific Market Y-o-Y Growth (%) Projections by Country, 2023 to 2033

Figure 80: Asia Pacific Market Value (US$ Million) Analysis by Product, 2018 to 2033

Figure 81: Asia Pacific Market Volume (Tons) Analysis by Product, 2018 to 2033

Figure 82: Asia Pacific Market Value Share (%) and BPS Analysis by Product, 2023 to 2033

Figure 83: Asia Pacific Market Y-o-Y Growth (%) Projections by Product, 2023 to 2033

Figure 84: Asia Pacific Market Value (US$ Million) Analysis by Application, 2018 to 2033

Figure 85: Asia Pacific Market Volume (Tons) Analysis by Application, 2018 to 2033

Figure 86: Asia Pacific Market Value Share (%) and BPS Analysis by Application, 2023 to 2033

Figure 87: Asia Pacific Market Y-o-Y Growth (%) Projections by Application, 2023 to 2033

Figure 88: Asia Pacific Market Attractiveness by Product, 2023 to 2033

Figure 89: Asia Pacific Market Attractiveness by Application, 2023 to 2033

Figure 90: Asia Pacific Market Attractiveness by Country, 2023 to 2033

Figure 91: Middle East and Africa Market Value (US$ Million) by Product, 2023 to 2033

Figure 92: Middle East and Africa Market Value (US$ Million) by Application, 2023 to 2033

Figure 93: Middle East and African Market Value (US$ Million) by Country, 2023 to 2033

Figure 94: Middle East and Africa Market Value (US$ Million) Analysis by Country, 2018 to 2033

Figure 95: Middle East and Africa Market Volume (Tons) Analysis by Country, 2018 to 2033

Figure 96: Middle East and Africa Market Value Share (%) and BPS Analysis by Country, 2023 to 2033

Figure 97: Middle East and Africa Market Y-o-Y Growth (%) Projections by Country, 2023 to 2033

Figure 98: Middle East and Africa  Market Value (US$ Million) Analysis by Product, 2018 to 2033

Figure 99: Middle East and Africa Market Volume (Tons) Analysis by Product, 2018 to 2033

Figure 100: Middle East and Africa Market Value Share (%) and BPS Analysis by Product, 2023 to 2033

Figure 101: Middle East and Africa Market Y-o-Y Growth (%) Projections by Product, 2023 to 2033

Figure 102: Middle East and Africa Market Value (US$ Million) Analysis by Application, 2018 to 2033

Figure 103: Middle East and Africa Market Volume (Tons) Analysis by Application, 2018 to 2033

Figure 104: Middle East and Africa Market Value Share (%) and BPS Analysis by Application, 2023 to 2033

Figure 105: Middle East and Africa Market Y-o-Y Growth (%) Projections by Application, 2023 to 2033

Figure 106: Middle East and Africa Market Attractiveness by Product, 2023 to 2033

Figure 107: Middle East and Africa Market Attractiveness by Application, 2023 to 2033

Figure 108: Middle East and Africa Market Attractiveness by Country, 2023 to 2033

Frequently Asked Questions

What was the overall size of the humectants market in 2025?

The overall market size for the humectants market was USD 16,228.8 million in 2025.

How big is the humectants market expected to be in 2035?

The humectants market is expected to reach USD 25,689.4 million in 2035.

What will drive the demand for the humectants market during the forecast period?

Demand will be driven by increasing use in personal care and cosmetic products, rising consumption in food and beverage formulations, expanding applications in pharmaceuticals and animal feed, and growing awareness around moisture-retaining ingredients in health and wellness sectors.

List the top 5 countries contributing to the humectants market.

The top 5 countries driving the market are the United States, China, Germany, Japan, and India.

Which segment in type is expected to lead in the humectants market?

The food & beverage segment is expected to command a significant share over the assessment period.

Future Market Insights

Humectants Market