Himalayan Salt Market Outlook (2024 to 2034)

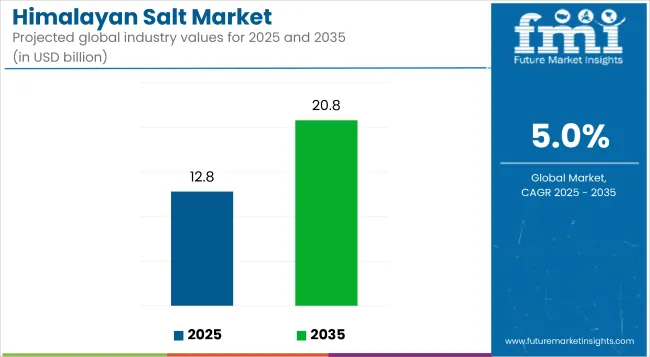
The global Himalayan salt market size is anticipated to be worth US$ 19,859 million by 2034. According to the estimates, the market is projected to clock a 5.00% CAGR until 2034. In 2024, the Himalayan salt market size is valued at US$ 12,158.4 million.

Attributes Details
Himalayan Salt Market Size, 2024 US$ 12,158.4 million
Himalayan Salt Market Size, 2034 US$ 19,859 million
Forecasted Value CAGR (2024 to 2034) 5.00%

Don't pay for what you don't need

Customize your report by selecting specific countries or regions and save 30%!

Key Market Highlights

Escalating Health and Wellness Trends Boost Growth in the Market

The general trend of consumer concern for health and wellness is influencing the demand for Himalayan salt. Himalayan salt is experiencing a surge in demand as consumers prioritize better lifestyles. Businesses are gaining on this trend by carefully marketing Himalayan salt crystals as a superior substitute for regular table salt.

They are highlighting its mineral content and possible health advantages. This is in line with the general market trend towards goods that are thought to promote general well-being, providing firms with a profitable chance to appeal to health-conscious customer groups and set themselves apart in a crowded market.

eCommerce Growth Continues to Surge Sales of Himalayan Salt

Himalayan salt vendors have enormous chances to grow their customer base, considering the growing digitization of the procurement procedure. It is now essential to invest in focused digital marketing efforts, social media techniques, and user-friendly e-commerce platforms. This helps in facilitating direct consumer interaction.

This digital presence also makes data-driven insights for customized marketing strategies possible. Development in eCommerce can be achieved using digital analytics, secure payment gateway implementation, and optimization of the online customer journey. Since online shopping is still the most popular trend, having a strong digital strategy is essential to remaining competitive in the changing industry.

Social Media Influence Emerges as a Critical Catalyst for Market Growth

Effective marketing and social media influence greatly impact the demand for Himalayan salt. Marketing strategies that are visually appealing and emphasize the product's health advantages can effectively reach customers on digital channels.

Brand exposure is increased by cooperating with social media influencers, putting targeted advertising campaigns into action, and encouraging user-generated content. Businesses can maintain agility in the quickly changing digital world by keeping an eye on and responding to social media trends. This helps them maintain a strong online presence and communicate with their target audience.

Himalayan Salt Market Trends Analysis

Trends Himalayan salt lamps, bath salts, and massage stones are becoming increasingly popular, helping to expand the industry outside the culinary realm. The emphasis on sustainability and ecologically friendly endeavors is impacting consumer purchasing decisions. Sensory marketing is becoming increasingly important in the Himalayan salt industry. Exploring new distribution methods outside of regular retail pathways is a distinct trend. Businesses can collaborate with meal kit providers, subscription box platforms, or specialist food vending machines. Himalayan salt adoption is rising in functional foods.
Opportunities Partnerships with influencers or businesses in the health and wellness space can be useful for entering the industry. Considering cross-industry partnerships offers Himalayan salt businesses a lucrative opportunity. It is possible to enter new markets and diversify products by partnering with firms specializing in home design, fitness, sports nutrition, and beauty brands. Businesses can promote Himalayan salt as an artisanal and high-end product. Partnering with spas, wellness resorts, and the hospitality sector can support the expanding wellness tourism trend. Marketing campaigns for educating consumers on the history, advantages, and applications of Himalayan salt offer a chance to establish businesses as industry leaders.
Challenges Alternative specialized salts like fleur de sel, sea salt, and gourmet salts compete with the market. The presence of these substitutes can prove risky, particularly if they become popular or have distinctive qualities that draw in customers. The selling price of Himalayan salt can vary due to changes in manufacturing costs caused by labor, transportation, or environmental laws, among other variables. Price fluctuation is problematic, particularly when it impacts how affordable and valuable a product is thought to be.
Nandini Roy Choudhury

Principal Consultant

Talk to Analyst

Find your sweet spots for generating winning opportunities in this market.

Category-wise Insights

Iodized Himalayan Salt Continues to be the Leading Product Type

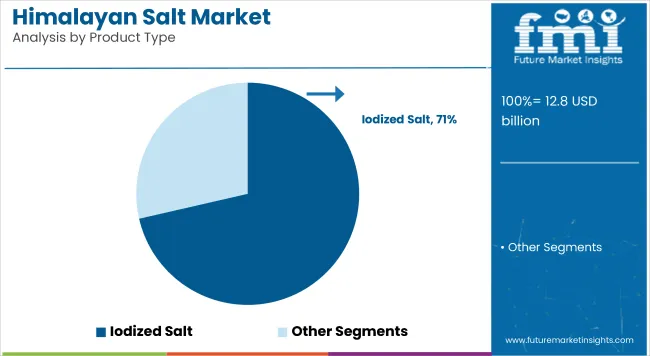
Segment Iodized (Product Type)
Value Share (2024) 71.4%

Based on product type, the iodized segment holds 71.4% of the Himalayan salt market shares in 2024.

Iodized salt is aggressively promoted by international health organizations like UNICEF and the World Health Organization (WHO) as a practical way to enhance public health. These organizations run educational programs highlighting iodine's need to avoid iodine-deficient conditions, which increases consumer demand for iodized salt.

Iodized Himalayan salt is becoming increasingly connected to proactive health and well-being among consumers. In line with wider consumer trends centered on nutrition, wellness, and illness prevention, iodized salt is positively seen as a preventive tool against iodine deficiency.

Food & Beverage Prevails as the Leading Application of Himalayan Salt

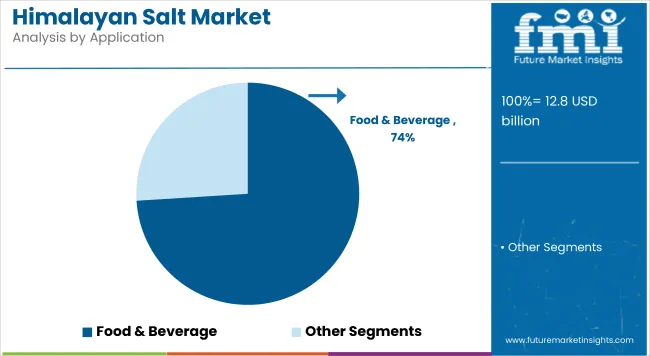
Segment Food & Beverage (Application)
Value Share (2024) 74.0%

Based on application, the food and beverage segment captured 74.0% of Himalayan salt market shares in 2024.

Consumers are gravitating toward natural and clean-label items as their understanding of health and well-being increases. Since Himalayan salt is a naturally occurring, lightly processed salt, it fits in nicely with this trend. Customers who want nutritious and transparent components in their food and beverages are drawn to its purity and lack of additions.

The increased demand for Himalayan salt can be attributed to its flexibility in various culinary applications, such as seasoning, grilling, curing, and presentation. Himalayan salt can be used in a variety of culinary techniques since it adds taste and aesthetic appeal to food preparation. This is particularly apparent with salt blocks and grilled planks.

Country-wise Insights

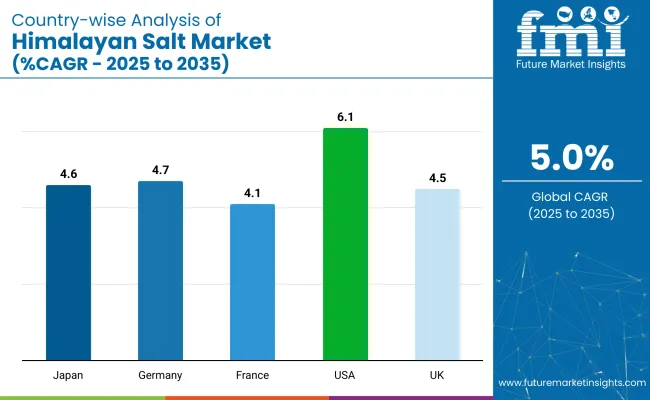
Countries Forecasted Value CAGR (2024 to 2034)
United States 6.1%
Germany 4.7%
Japan 4.6%
India 4.1%

Premium Salt-based Snack Innovations Drive Demand in the United States

The demand for Himalayan salt in the United States is projected to rise at a 6.1% CAGR through 2034.

Developing premium Himalayan salt-based snacks is a distinctive factor propelling the market's growth in the United States. Food producers are capitalizing on the unique qualities of Himalayan salt to create gourmet snack lines that include salted chocolates, popcorn, and specialized chips. This aligns with the consumer trend toward decadent, expensive treats, which gives businesses chances to stand out from the competition and premiumize their offerings.

An emerging niche trend that is fueling industry expansion is the adoption of Himalayan salt in interior design. Aesthetic items such as decorative salt lamps and blocks are becoming increasingly popular. Companies are capitalizing on this trend by providing high-end, design-focused salt products that appeal to customers looking for unusual and eye-catching home décor pieces.

Rising Demand for Natural and Organic Products Fuels Sales in Germany

Sales of Himalayan salt in Germany are predicted to surge at a 4.7% CAGR through 2034.

Health consciousness and concerns about sustainability have led to a high customer demand for natural and organic products in Germany. Himalayan salt satisfies this demand as it is marketed as a natural and lightly processed alternative to regular table salt. The expanding demand for natural food ingredients presents an opportunity for businesses that highlight the purity and organic sourcing of Himalayan salt.

The German government has established several health programs to encourage healthy lives and reduce lifestyle-related disorders. Himalayan salt, marketed as a better alternative to table salt owing to its mineral content, is consistent with these health objectives. Businesses that match their marketing activities with government-sponsored health programs can use this assistance to increase consumer awareness and market share.

Culinary Fusion and Gourmet Trends Bolster Market Growth in Japan

Himalayan salt market growth in Japan is estimated at a 4.6% CAGR through 2034.

Gourmet and foreign cuisines are becoming increasingly popular in Japan, known for its rich culinary legacy. Himalayan salt products become popular in Japanese cooking due to their distinct flavor and attractive appearance.

By appealing to the sophisticated tastes of Japanese customers, companies capitalize on the trend of culinary fusion. For example, creating unique salt mixes for Japanese and international cuisines or spices infused with Himalayan salt can propel their market development.

Japan has a long history of using holistic healing techniques, such as salt treatment and bathing onsen (hot spring). These conventional wellness methods align with Himalayan salt, well-known for its alleged health advantages and use in spa treatments. Businesses that sell wellness items based on Himalayan salt, such as inhalers, bath salts, and salt lamps, target the Japanese market's inclination towards natural and holistic health solutions.

Rise of Online Platforms Fuels Sales in India

Himalayan salt sales in India are anticipated to rise at a 4.1% CAGR through 2034.

The growth of eCommerce platforms specializing in holistic health and natural items presents a strategic opportunity for market expansion. Businesses that use online platforms to market and sell Himalayan salt products can attract a larger audience, particularly urban consumers seeking health solutions delivered right to their homes.

The increased demand for organic and health-conscious products in India creates a potential for Himalayan salt market growth. Businesses that deliberately place their products in organic and health food stores, stressing the natural and mineral-rich features of Himalayan salt, can draw in a specific demographic of health-conscious consumers while also increasing market awareness.

Get the data you need at a Fraction of the cost

Personalize your report by choosing insights you need
and save 40%!

Competitive Landscape

The Himalayan salt market's competitive environment is dynamic, featuring incumbent competitors, new entrants, and strategic partnerships.

Key competitors, such as SaltWorks, Mineral Salt Corporation, and Evolution Salt Co., dominate the industry and benefit from substantial distribution networks, solid supply chains, and extensive brand equity. These industry titans frequently set the tone for prices and innovation, leveraging their market dominance to influence customer preferences.

Recent Developments

  • In August 2023, Himalayan Source launched the Himalayan Salt Capsule to assist spa, health, and fitness centers and households in expanding their halotherapy offerings.
  • In July 2023, Cargill, a food ingredient firm, displayed its latest innovation in salty solutions at IFT FIRST with a new range of Pink Himalayan Salt products. Food producers are increasingly looking to the ingredient for its perceived better-for-you advantage.

Key Players in the Himalayan Salt Market

  • SaltWorks, Inc.
  • Mineral Salt Corporation
  • Evolution Salt Co.
  • Himalayan Salt Company
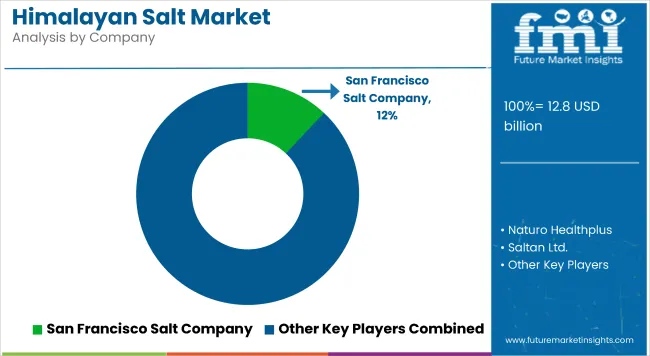
  • San Francisco Salt Company
  • SaltPur
  • Himalayan Chef
  • SaltSkill
  • Nature's Artifacts
  • The Spice Lab

Key Coverage in the Himalayan Salt Market Report

  • Consumption Analysis of Himalayan Pink Salt
  • Insights on How Pink Salt Thrives in China
  • Quantity-wise Consumption Analysis of Himalayan Salt
  • Demand Analysis of Himalayan Salt Lamps & Spa-at-Home Products

Himalayan Salt Market Segmentation

By Product Type:

  • Iodized
  • Non-Iodized

By Application:

  • Food & Beverage
  • Bath Salts
  • Salt lamps
  • Others

By Sales Channel:

  • Offline Sales Channel
    • Supermarkets/Hypermarkets
    • Departmental Stores
    • Convenience Store
    • Other Sales Channel
  • Online Sales Channel
    • Company Website
    • E-commerce Platform

By Region:

  • North America
  • Latin America
  • Western Europe
  • Eastern Europe
  • Asia Pacific (APAC)
  • Middle East & Africa (MEA)
  • Japan

Frequently Asked Questions

How Big is the Himalayan Salt Market?

The Himalayan salt market is valued at US$ 12,158.4 million in 2024.

What is the Forecasted CAGR of the Himalayan Salt Market?

The Himalayan salt market size is estimated to develop at a 5.00% CAGR through 2034.

What are the Future Prospects for the Himalayan Salt Market?

The Himalayan salt market is anticipated to be valued at US$ 19,859 million by 2034.

Which is the Most Popular Product Type in the Himalayan Salt Market?

Iodized Himalayan salt is in high demand in the market.

Which Country is Experiencing a Higher CAGR in the Himalayan Salt Market?

The United States’ market is predicted to rise at a 4.7% CAGR through 2034.

Table of Content

1. Executive Summary

    1.1. Global Market Outlook

    1.2. Demand-side Trends

    1.3. Supply-side Trends

    1.4. Technology Roadmap Analysis

    1.5. Analysis and Recommendations

2. Market Overview

    2.1. Market Coverage / Taxonomy

    2.2. Market Definition / Scope / Limitations

3. Market Background

    3.1. Market Dynamics

        3.1.1. Drivers

        3.1.2. Restraints

        3.1.3. Opportunity

        3.1.4. Trends

    3.2. Scenario Forecast

        3.2.1. Demand in Optimistic Scenario

        3.2.2. Demand in Likely Scenario

        3.2.3. Demand in Conservative Scenario

    3.3. Opportunity Map Analysis

    3.4. Product Life Cycle Analysis

    3.5. Supply Chain Analysis

        3.5.1. Supply Side Participants and their Roles

            3.5.1.1. Manufacturer

            3.5.1.2. Mid-Level Participants (Traders)

            3.5.1.3. Wholesalers and Distributors

        3.5.2. Value Added and Value Created at Node in the Supply Chain

        3.5.3. List of Raw Material Suppliers

        3.5.4. List of Existing and Potential Buyer’s

    3.6. Investment Feasibility Matrix

    3.7. Value Chain Analysis

        3.7.1. Profit Margin Analysis

        3.7.2. Wholesalers and Distributors

        3.7.3. Retailers

    3.8. PESTLE and Porter’s Analysis

    3.9. Regulatory Landscape

        3.9.1. By Key Regions

        3.9.2. By Key Countries

    3.10. Regional Parent Market Outlook

    3.11. Production and Consumption Statistics

    3.12. Import and Export Statistics

4. Global Market Analysis 2019 to 2023 and Forecast, 2024 to 2034

    4.1. Historical Market Size Value (US$ Million) & Volume (Unit Pack) Analysis, 2019 to 2023

    4.2. Current and Future Market Size Value (US$ Million) & Volume (Unit Pack) Projections, 2024 to 2034

        4.2.1. Y-o-Y Growth Trend Analysis

        4.2.2. Absolute $ Opportunity Analysis

5. Global Market Analysis 2019 to 2023 and Forecast 2024 to 2034, By Product Type

    5.1. Introduction / Key Findings

    5.2. Historical Market Size Value (US$ Million) & Volume (Unit Pack) Analysis By Product Type, 2019 to 2023

    5.3. Current and Future Market Size Value (US$ Million) & Volume (Unit Pack) Analysis and Forecast By Product Type, 2024 to 2034

        5.3.1. Iodized Salt

        5.3.2. Non-Iodized Salt

    5.4. Y-o-Y Growth Trend Analysis By Product Type, 2019 to 2023

    5.5. Absolute $ Opportunity Analysis By Product Type, 2024 to 2034

6. Global Market Analysis 2019 to 2023 and Forecast 2024 to 2034, By Application

    6.1. Introduction / Key Findings

    6.2. Historical Market Size Value (US$ Million) & Volume (Unit Pack) Analysis By Application, 2019 to 2023

    6.3. Current and Future Market Size Value (US$ Million) & Volume (Unit Pack) Analysis and Forecast By Application, 2024 to 2034

        6.3.1. Food & Beverage

        6.3.2. Bath Salts

        6.3.3. Salt lamps

        6.3.4. Others

    6.4. Y-o-Y Growth Trend Analysis By Application, 2019 to 2023

    6.5. Absolute $ Opportunity Analysis By Application, 2024 to 2034

7. Global Market Analysis 2019 to 2023 and Forecast 2024 to 2034, By Sales Channel

    7.1. Introduction / Key Findings

    7.2. Historical Market Size Value (US$ Million) & Volume (Unit Pack) Analysis By Sales Channel, 2019 to 2023

    7.3. Current and Future Market Size Value (US$ Million) & Volume (Unit Pack) Analysis and Forecast By Sales Channel, 2024 to 2034

        7.3.1. Offline Sales Channel

            7.3.1.1. Supermarkets/Hypermarkets

            7.3.1.2. Departmental Stores

            7.3.1.3. Convenience Store

            7.3.1.4. Other Sales Channel

        7.3.2. Online Sales Channel

            7.3.2.1. Company Website

            7.3.2.2. E-commerce Platform

    7.4. Y-o-Y Growth Trend Analysis By Sales Channel, 2019 to 2023

    7.5. Absolute $ Opportunity Analysis By Sales Channel, 2024 to 2034

8. Global Market Analysis 2019 to 2023 and Forecast 2024 to 2034, By Region

    8.1. Introduction

    8.2. Historical Market Size Value (US$ Million) & Volume (Unit Pack) Analysis By Region, 2019 to 2023

    8.3. Current Market Size Value (US$ Million) & Volume (Unit Pack) Analysis and Forecast By Region, 2024 to 2034

        8.3.1. North America

        8.3.2. Latin America

        8.3.3. Western Europe

        8.3.4. Eastern Europe

        8.3.5. South Asia and Pacific

        8.3.6. East Asia

        8.3.7. Middle East and Africa

    8.4. Market Attractiveness Analysis By Region

9. North America Market Analysis 2019 to 2023 and Forecast 2024 to 2034, By Country

    9.1. Historical Market Size Value (US$ Million) & Volume (Unit Pack) Trend Analysis By Market Taxonomy, 2019 to 2023

    9.2. Market Size Value (US$ Million) & Volume (Unit Pack) Forecast By Market Taxonomy, 2024 to 2034

        9.2.1. By Country

            9.2.1.1. USA

            9.2.1.2. Canada

        9.2.2. By Product Type

        9.2.3. By Application

        9.2.4. By Sales Channel

    9.3. Market Attractiveness Analysis

        9.3.1. By Country

        9.3.2. By Product Type

        9.3.3. By Application

        9.3.4. By Sales Channel

    9.4. Key Takeaways

10. Latin America Market Analysis 2019 to 2023 and Forecast 2024 to 2034, By Country

    10.1. Historical Market Size Value (US$ Million) & Volume (Unit Pack) Trend Analysis By Market Taxonomy, 2019 to 2023

    10.2. Market Size Value (US$ Million) & Volume (Unit Pack) Forecast By Market Taxonomy, 2024 to 2034

        10.2.1. By Country

            10.2.1.1. Brazil

            10.2.1.2. Mexico

            10.2.1.3. Rest of Latin America

        10.2.2. By Product Type

        10.2.3. By Application

        10.2.4. By Sales Channel

    10.3. Market Attractiveness Analysis

        10.3.1. By Country

        10.3.2. By Product Type

        10.3.3. By Application

        10.3.4. By Sales Channel

    10.4. Key Takeaways

11. Western Europe Market Analysis 2019 to 2023 and Forecast 2024 to 2034, By Country

    11.1. Historical Market Size Value (US$ Million) & Volume (Unit Pack) Trend Analysis By Market Taxonomy, 2019 to 2023

    11.2. Market Size Value (US$ Million) & Volume (Unit Pack) Forecast By Market Taxonomy, 2024 to 2034

        11.2.1. By Country

            11.2.1.1. Germany

            11.2.1.2. UK

            11.2.1.3. France

            11.2.1.4. Spain

            11.2.1.5. Italy

            11.2.1.6. Rest of Western Europe

        11.2.2. By Product Type

        11.2.3. By Application

        11.2.4. By Sales Channel

    11.3. Market Attractiveness Analysis

        11.3.1. By Country

        11.3.2. By Product Type

        11.3.3. By Application

        11.3.4. By Sales Channel

    11.4. Key Takeaways

12. Eastern Europe Market Analysis 2019 to 2023 and Forecast 2024 to 2034, By Country

    12.1. Historical Market Size Value (US$ Million) & Volume (Unit Pack) Trend Analysis By Market Taxonomy, 2019 to 2023

    12.2. Market Size Value (US$ Million) & Volume (Unit Pack) Forecast By Market Taxonomy, 2024 to 2034

        12.2.1. By Country

            12.2.1.1. Poland

            12.2.1.2. Russia

            12.2.1.3. Czech Republic

            12.2.1.4. Romania

            12.2.1.5. Rest of Eastern Europe

        12.2.2. By Product Type

        12.2.3. By Application

        12.2.4. By Sales Channel

    12.3. Market Attractiveness Analysis

        12.3.1. By Country

        12.3.2. By Product Type

        12.3.3. By Application

        12.3.4. By Sales Channel

    12.4. Key Takeaways

13. South Asia and Pacific Market Analysis 2019 to 2023 and Forecast 2024 to 2034, By Country

    13.1. Historical Market Size Value (US$ Million) & Volume (Unit Pack) Trend Analysis By Market Taxonomy, 2019 to 2023

    13.2. Market Size Value (US$ Million) & Volume (Unit Pack) Forecast By Market Taxonomy, 2024 to 2034

        13.2.1. By Country

            13.2.1.1. India

            13.2.1.2. Bangladesh

            13.2.1.3. Australia

            13.2.1.4. New Zealand

            13.2.1.5. Rest of South Asia and Pacific

        13.2.2. By Product Type

        13.2.3. By Application

        13.2.4. By Sales Channel

    13.3. Market Attractiveness Analysis

        13.3.1. By Country

        13.3.2. By Product Type

        13.3.3. By Application

        13.3.4. By Sales Channel

    13.4. Key Takeaways

14. East Asia Market Analysis 2019 to 2023 and Forecast 2024 to 2034, By Country

    14.1. Historical Market Size Value (US$ Million) & Volume (Unit Pack) Trend Analysis By Market Taxonomy, 2019 to 2023

    14.2. Market Size Value (US$ Million) & Volume (Unit Pack) Forecast By Market Taxonomy, 2024 to 2034

        14.2.1. By Country

            14.2.1.1. China

            14.2.1.2. Japan

            14.2.1.3. South Korea

        14.2.2. By Product Type

        14.2.3. By Application

        14.2.4. By Sales Channel

    14.3. Market Attractiveness Analysis

        14.3.1. By Country

        14.3.2. By Product Type

        14.3.3. By Application

        14.3.4. By Sales Channel

    14.4. Key Takeaways

15. Middle East and Africa Market Analysis 2019 to 2023 and Forecast 2024 to 2034, By Country

    15.1. Historical Market Size Value (US$ Million) & Volume (Unit Pack) Trend Analysis By Market Taxonomy, 2019 to 2023

    15.2. Market Size Value (US$ Million) & Volume (Unit Pack) Forecast By Market Taxonomy, 2024 to 2034

        15.2.1. By Country

            15.2.1.1. GCC Countries

            15.2.1.2. South Africa

            15.2.1.3. Israel

            15.2.1.4. Rest of MEA

        15.2.2. By Product Type

        15.2.3. By Application

        15.2.4. By Sales Channel

    15.3. Market Attractiveness Analysis

        15.3.1. By Country

        15.3.2. By Product Type

        15.3.3. By Application

        15.3.4. By Sales Channel

    15.4. Key Takeaways

16. Key Countries Market Analysis

    16.1. USA

        16.1.1. Pricing Analysis

        16.1.2. Market Share Analysis, 2023

            16.1.2.1. By Product Type

            16.1.2.2. By Application

            16.1.2.3. By Sales Channel

    16.2. Canada

        16.2.1. Pricing Analysis

        16.2.2. Market Share Analysis, 2023

            16.2.2.1. By Product Type

            16.2.2.2. By Application

            16.2.2.3. By Sales Channel

    16.3. Brazil

        16.3.1. Pricing Analysis

        16.3.2. Market Share Analysis, 2023

            16.3.2.1. By Product Type

            16.3.2.2. By Application

            16.3.2.3. By Sales Channel

    16.4. Mexico

        16.4.1. Pricing Analysis

        16.4.2. Market Share Analysis, 2023

            16.4.2.1. By Product Type

            16.4.2.2. By Application

            16.4.2.3. By Sales Channel

    16.5. Germany

        16.5.1. Pricing Analysis

        16.5.2. Market Share Analysis, 2023

            16.5.2.1. By Product Type

            16.5.2.2. By Application

            16.5.2.3. By Sales Channel

    16.6. UK

        16.6.1. Pricing Analysis

        16.6.2. Market Share Analysis, 2023

            16.6.2.1. By Product Type

            16.6.2.2. By Application

            16.6.2.3. By Sales Channel

    16.7. France

        16.7.1. Pricing Analysis

        16.7.2. Market Share Analysis, 2023

            16.7.2.1. By Product Type

            16.7.2.2. By Application

            16.7.2.3. By Sales Channel

    16.8. Spain

        16.8.1. Pricing Analysis

        16.8.2. Market Share Analysis, 2023

            16.8.2.1. By Product Type

            16.8.2.2. By Application

            16.8.2.3. By Sales Channel

    16.9. Italy

        16.9.1. Pricing Analysis

        16.9.2. Market Share Analysis, 2023

            16.9.2.1. By Product Type

            16.9.2.2. By Application

            16.9.2.3. By Sales Channel

    16.10. Poland

        16.10.1. Pricing Analysis

        16.10.2. Market Share Analysis, 2023

            16.10.2.1. By Product Type

            16.10.2.2. By Application

            16.10.2.3. By Sales Channel

    16.11. Russia

        16.11.1. Pricing Analysis

        16.11.2. Market Share Analysis, 2023

            16.11.2.1. By Product Type

            16.11.2.2. By Application

            16.11.2.3. By Sales Channel

    16.12. Czech Republic

        16.12.1. Pricing Analysis

        16.12.2. Market Share Analysis, 2023

            16.12.2.1. By Product Type

            16.12.2.2. By Application

            16.12.2.3. By Sales Channel

    16.13. Romania

        16.13.1. Pricing Analysis

        16.13.2. Market Share Analysis, 2023

            16.13.2.1. By Product Type

            16.13.2.2. By Application

            16.13.2.3. By Sales Channel

    16.14. India

        16.14.1. Pricing Analysis

        16.14.2. Market Share Analysis, 2023

            16.14.2.1. By Product Type

            16.14.2.2. By Application

            16.14.2.3. By Sales Channel

    16.15. Bangladesh

        16.15.1. Pricing Analysis

        16.15.2. Market Share Analysis, 2023

            16.15.2.1. By Product Type

            16.15.2.2. By Application

            16.15.2.3. By Sales Channel

    16.16. Australia

        16.16.1. Pricing Analysis

        16.16.2. Market Share Analysis, 2023

            16.16.2.1. By Product Type

            16.16.2.2. By Application

            16.16.2.3. By Sales Channel

    16.17. New Zealand

        16.17.1. Pricing Analysis

        16.17.2. Market Share Analysis, 2023

            16.17.2.1. By Product Type

            16.17.2.2. By Application

            16.17.2.3. By Sales Channel

    16.18. China

        16.18.1. Pricing Analysis

        16.18.2. Market Share Analysis, 2023

            16.18.2.1. By Product Type

            16.18.2.2. By Application

            16.18.2.3. By Sales Channel

    16.19. Japan

        16.19.1. Pricing Analysis

        16.19.2. Market Share Analysis, 2023

            16.19.2.1. By Product Type

            16.19.2.2. By Application

            16.19.2.3. By Sales Channel

    16.20. South Korea

        16.20.1. Pricing Analysis

        16.20.2. Market Share Analysis, 2023

            16.20.2.1. By Product Type

            16.20.2.2. By Application

            16.20.2.3. By Sales Channel

    16.21. GCC Countries

        16.21.1. Pricing Analysis

        16.21.2. Market Share Analysis, 2023

            16.21.2.1. By Product Type

            16.21.2.2. By Application

            16.21.2.3. By Sales Channel

    16.22. South Africa

        16.22.1. Pricing Analysis

        16.22.2. Market Share Analysis, 2023

            16.22.2.1. By Product Type

            16.22.2.2. By Application

            16.22.2.3. By Sales Channel

    16.23. Israel

        16.23.1. Pricing Analysis

        16.23.2. Market Share Analysis, 2023

            16.23.2.1. By Product Type

            16.23.2.2. By Application

            16.23.2.3. By Sales Channel

17. Market Structure Analysis

    17.1. Competition Dashboard

    17.2. Competition Benchmarking

    17.3. Market Share Analysis of Top Players

        17.3.1. By Regional

        17.3.2. By Product Type

        17.3.3. By Application

        17.3.4. By Sales Channel

18. Competition Analysis

    18.1. Competition Deep Dive

        18.1.1. San Francisco Salt Company

            18.1.1.1. Overview

            18.1.1.2. Product Portfolio

            18.1.1.3. Profitability by Market Segments

            18.1.1.4. Sales Footprint

            18.1.1.5. Strategy Overview

                18.1.1.5.1. Marketing Strategy

                18.1.1.5.2. Product Strategy

                18.1.1.5.3. Channel Strategy

        18.1.2. Naturo Healthplus

            18.1.2.1. Overview

            18.1.2.2. Product Portfolio

            18.1.2.3. Profitability by Market Segments

            18.1.2.4. Sales Footprint

            18.1.2.5. Strategy Overview

                18.1.2.5.1. Marketing Strategy

                18.1.2.5.2. Product Strategy

                18.1.2.5.3. Channel Strategy

        18.1.3. Saltan Ltd.

            18.1.3.1. Overview

            18.1.3.2. Product Portfolio

            18.1.3.3. Profitability by Market Segments

            18.1.3.4. Sales Footprint

            18.1.3.5. Strategy Overview

                18.1.3.5.1. Marketing Strategy

                18.1.3.5.2. Product Strategy

                18.1.3.5.3. Channel Strategy

        18.1.4. Morton Salt Inc.

            18.1.4.1. Overview

            18.1.4.2. Product Portfolio

            18.1.4.3. Profitability by Market Segments

            18.1.4.4. Sales Footprint

            18.1.4.5. Strategy Overview

                18.1.4.5.1. Marketing Strategy

                18.1.4.5.2. Product Strategy

                18.1.4.5.3. Channel Strategy

        18.1.5. The Spice Lab

            18.1.5.1. Overview

            18.1.5.2. Product Portfolio

            18.1.5.3. Profitability by Market Segments

            18.1.5.4. Sales Footprint

            18.1.5.5. Strategy Overview

                18.1.5.5.1. Marketing Strategy

                18.1.5.5.2. Product Strategy

                18.1.5.5.3. Channel Strategy

        18.1.6. HimalayanChef

            18.1.6.1. Overview

            18.1.6.2. Product Portfolio

            18.1.6.3. Profitability by Market Segments

            18.1.6.4. Sales Footprint

            18.1.6.5. Strategy Overview

                18.1.6.5.1. Marketing Strategy

                18.1.6.5.2. Product Strategy

                18.1.6.5.3. Channel Strategy

        18.1.7. Viva Doria

            18.1.7.1. Overview

            18.1.7.2. Product Portfolio

            18.1.7.3. Profitability by Market Segments

            18.1.7.4. Sales Footprint

            18.1.7.5. Strategy Overview

                18.1.7.5.1. Marketing Strategy

                18.1.7.5.2. Product Strategy

                18.1.7.5.3. Channel Strategy

        18.1.8. Evolution Salt Co.

            18.1.8.1. Overview

            18.1.8.2. Product Portfolio

            18.1.8.3. Profitability by Market Segments

            18.1.8.4. Sales Footprint

            18.1.8.5. Strategy Overview

                18.1.8.5.1. Marketing Strategy

                18.1.8.5.2. Product Strategy

                18.1.8.5.3. Channel Strategy

        18.1.9. Kutch Brine Chem Industries

            18.1.9.1. Overview

            18.1.9.2. Product Portfolio

            18.1.9.3. Profitability by Market Segments

            18.1.9.4. Sales Footprint

            18.1.9.5. Strategy Overview

                18.1.9.5.1. Marketing Strategy

                18.1.9.5.2. Product Strategy

                18.1.9.5.3. Channel Strategy

19. Assumptions & Acronyms Used

20. Research Methodology

Recommendations

Food and Beverage

Sea Salt Market

March 2024

REP-GB-6067

342 pages

Food and Beverage

Gourmet Salt Market

March 2023

REP-GB-13928

250 pages

Food and Beverage

Flavored Salt Market

March 2023

REP-GB-13824

250 pages

Food and Beverage

Solar Salt Market

February 2023

REP-GB-6078

250 pages

Explore Food and Beverage Insights

View Reports
Future Market Insights

Himalayan Salt Market

Schedule a Call