Heavy Wall Bottles Market Size and Share Forecast Outlook 2025 to 2035

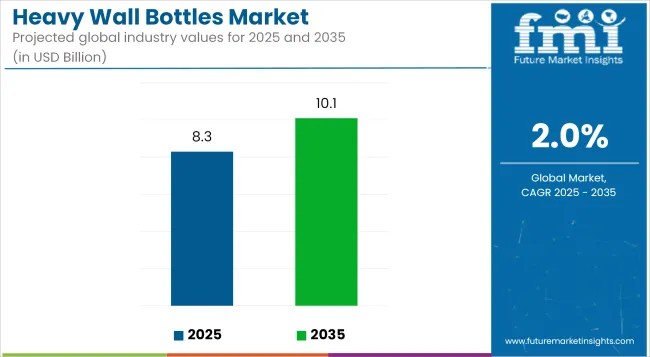
The heavy wall bottles market is projected to grow from USD 8.3 billion in 2025 to USD 10.1 billion by 2035, registering a CAGR of 2.0% during the forecast period. Sales in 2024 reached USD 7.5 billion, indicating a robust demand trajectory.
Quick Stats of Heavy Wall Bottles Market

  • Market Value (2025): USD 8.3 billion
  • Forecast Value (2035): USD 10.1 billion
  • Forecast CAGR: 2.0%
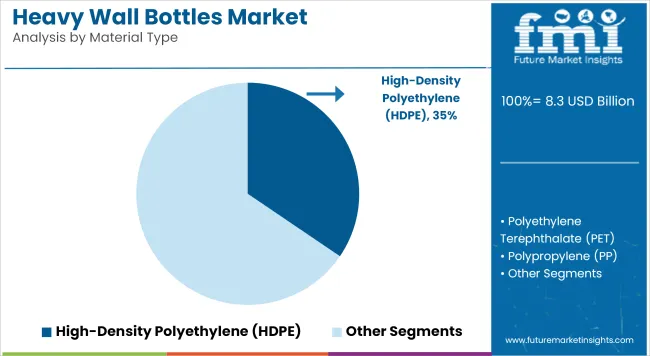
  • Material Leader in 2025: HDPE (34.5% market share)
  • Top End Use: Cosmetics and personal care (38.1% share)
  • Key Growth Country: USA (USA is the fastest-growing market with 3.5% CAGR)

Heavy Wall Bottles Market Industry Value Analysis

Metric Value
Industry Size (2025E) USD 8.3 billion
Industry Value (2035F) USD 10.1 billion
CAGR (2025 to 2035) 2.0%

This growth has been attributed to the increasing consumer preference for premium and durable packaging solutions across various industries, including cosmetics, pharmaceuticals, and food and beverages.

The rise in demand for aesthetically appealing and protective packaging has necessitated the adoption of heavy wall bottles that ensure product safety and enhance brand image. Additionally, innovations in sustainable materials and manufacturing processes have further propelled market growth, aligning with the growing emphasis on environmental responsibility among consumers and manufacturers alike.

In May 2025, Gerresheimer, an innovative systems and solutions provider and global partner for the pharma, biotech and cosmetics industries, has successfully completed an expansion and modernization project at its Lohr site.

“Our investments in cutting-edge production technology, such as the new facility in Lohr, secure the future,” explains Dietmar Siemssen, CEO of Gerresheimer AG. “With state-of-the-art facilities for high-value products, we are strengthening our competitiveness, securing long-term jobs in the region and making significant progress toward our ambitious sustainability goals.”

The heavy wall bottles sales is expected to witness robust growth, driven by increasing demand in the cosmetics, pharmaceuticals, and beverage sectors. Manufacturers focusing on sustainable and innovative solutions are anticipated to gain a competitive edge.

Emerging markets in Asia-Pacific and Latin America are projected to offer significant growth opportunities due to rising consumer awareness and industrialization. Strategic collaborations and investments in research and development are likely to foster product innovation and market expansion. As environmental concerns continue to influence consumer behavior, the adoption of eco-friendly heavy wall bottles is expected to become a key differentiator in the industry.

Analyzing Heavy Wall Bottles Market by Top Investment Segment

The market is segmented based on material type, size, end use, sales channel, and region. By material type, the market includes polyethylene terephthalate (PET), high-density polyethylene (HDPE), polypropylene (PP), glass, and acrylic. In terms of size, the market is categorized into 20&-30 ml, 50-80 ml, 80-120 ml, 120-150 ml, and 150-200 ml.

By end use, the market comprises cosmetics & personal care, pharmaceuticals & nutraceuticals, food & beverages, chemicals & industrial liquids, and luxury packaging. Based on sales channel, the market is segmented into hypermarkets/supermarkets, independent stores, specialty stores, multi-brand stores, online retailers, direct sales, and other sales channels. Regionally, the market is analyzed across North America, Latin America, East Asia, South Asia & Pacific, Eastern Europe, Western Europe, Oceania, and the Middle East & Africa.
HDPE Used Widely for Its Rigidity, Chemical Resistance, and Cost-Efficiency

Heavy Wall Bottles Market Analysis By Material Type

HDPE has been projected to account for 34.5% of the heavy wall bottles market by 2025 due to its superior strength, impact resistance, and excellent moisture barrier. It has been utilized extensively for packaging creams, shampoos, cleaning liquids, and pharmaceutical syrups.

The material has been favored for its compatibility with extrusion blow molding, which enables precise wall thickness and dimensional consistency. HDPE’s recyclability and cost-effectiveness have further increased its acceptance among manufacturers prioritizing durability and sustainability.

Customization in color, texture, and closure compatibility has been supported effectively by HDPE, allowing brands to maintain identity without compromising performance. Surface treatment options have also been explored to enhance label adhesion and printability.

Global regulations for food contact and pharmaceutical packaging have been met by medical-grade HDPE variants, enabling its use in critical packaging formats. The material has continued to be deployed across both high- and low-volume production cycles with consistent reliability.

Cosmetics and Personal Care Drive Premium Bottle Adoption across Segments

The cosmetics and personal care industry has been estimated to contribute 38.1% to the global heavy wall bottles market in 2025, led by demand for premium packaging across skincare, haircare, and fragrance categories. These bottles have been chosen for their visual appeal, ergonomic design, and product protection qualities.

Luxury brands have adopted thick-walled bottles to convey product richness and improve shelf impact in competitive beauty retail environments. Compatibility with droppers, pumps, and dispensing closures has enhanced consumer convenience and product dosing accuracy.

Sustainability trends have encouraged the use of refillable and recyclable heavy wall designs, particularly in prestige skincare and clean beauty ranges. PET and HDPE have been coated or treated to simulate glass while preserving functionality and safety. Global expansion of cosmetic brands and the rise of e-commerce platforms have accelerated demand for durable and visually distinct packaging. Heavy wall bottles have been favored for their resistance to deformation during shipping and ability to maintain product quality under varied environmental conditions.

Challenges and Opportunities

Challenge

High production costs and recycling difficulties

Challenges in the heavy wall bottles market include high production costs of thick-walled bottle fabrication as well as difficulties in recycling caused by material density. Though the moulds used to make these bottles needs to be tougher, cooling times are longer and they are manufactured using specific techniques to ensure uniform wall thickness and durability used in pharmaceuticals, cosmetics and speciality chemicals.

They're also less economical, as the increased raw material usage means a higher price tag compared to standard bottles. Thick plastic and glass bottles face challenges in being recycled because of the greater energy requirement to reprocess them and their limited acceptance in traditional recycling streams.

Opportunity

Demand for premium packaging and sustainable alternatives

The increase in demand for high-durability premium packaging solutions are driving the heavy wall bottles market. Heavy wall bottles are favoured in product categories like luxury cosmetics, high-end pharmaceuticals, and specialty food packaging due to their high-quality feel, durability, and ultimate protection for the product inside.

The wide range of advanced eco-friendly material formulations, including biodegradable resins and lightweight reinforced glass that is at the same time, non-permeable, offers sustainable alternatives to heavier wall packaging. Innovation in refillable and reusable packaging solutions is also driving growth among circular economy initiatives, making it a win for brands to use high quality, long-lasting heavy wall bottles that contribute towards sustainability goals.
Country-Wise Outlook

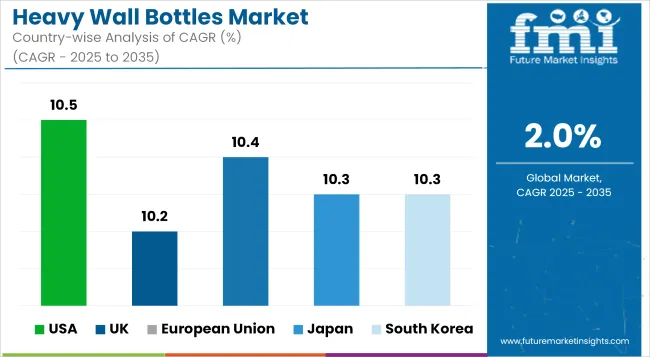
Heavy Wall Bottles Market Cagr Analysis By Country

United States

Growing demand across the cosmetics, pharmaceuticals, and personal care industries and the growing investment in the heavy wall brands are projected to be the primary drivers sustaining growth in the heavy wall bottles market in the United States. Luxury packaging applications are increasingly featuring heavy wall bottles, which are more durable, have a premium aesthetic and are less prone to breakage.

The increasing beauty and skincare industry, along with the rising demand for sustainable and premium packaging solutions, is driving the heavy wall PET and glass bottles market. Pharmaceutical industries also require chemically resistant and tamper-proof containers for commercial reasons, which actively fuels market growth.

The growth of direct-to-consumer (DTC) brands and e-commerce platforms has created a new challenge for these brands, namely the need for durable packaging to ensure product integrity during transit.

Country CAGR (2025 to 2035)
USA 10.5%

United Kingdom

The UK heavy wall bottles market is fuelled by a rise in the demand for luxury packaging in cosmetics, personal care, and specialty beverages. Luxury botellones tend to be thicker walled, which many luxury skin and fragrance brands prefer for their upscale look and protective qualities.

Sustainability trends in the marketplace are also driving the market, with brands looking for recyclable, reusable and eco-friendly materials. Glass and PET heavy wall bottle trends are becoming more common as the UK’s plastic packaging regulations drive manufacturers to lift the quality of lightweight, refillable bottle solutions.

Country CAGR (2025 to 2035)
UK 10.2%

European Union

Demand for luxury packaging for cosmetics, pharmaceuticals, and beverages are fuelling the growth of the EU heavy wall bottles market. Markets are mainly concentrated in France, Germany, and Italy where high consumer demand for premium skincare, perfumes, and nutraceuticals drives the industry.

The EU’s strict sustainability regulations have led to brands using recyclable and bio-based materials when it comes to packaging. Also, improvements in glass moulding and PET manufacturing technology allow for lightweight but durable heavy wall bottles. The concept of refillable and reusable packaging has also expanded and further stimulates innovations in this segment.

Region CAGR (2025 to 2035)
European Union 10.4%

Japan

The heavy wall bottles market for cosmetics and pharmaceuticals in Japan is becoming increasingly competitive, driven by demand for high-end cosmetics and drug packaging. Japanese brands tend to focus on minimalist but high-quality packaging designs, which leads to a lot of demand for thick-walled glass and PET bottles in skincare, wellness and high-end beverages.

The market is being shaped by a number of factors, including the growth of Japan’s beauty and nutraceutical sectors, and a growing focus on sustainable and refillable packaging solutions. Moreover, the rising trends of precision moulding and lightweight glass manufacturing provide an impetus to attract the luxury heavy wall bottle specifications.

Country CAGR (2025 to 2035)
Japan 10.3%

South Korea

The South Korean heavy wall bottles market is somewhat nascent and is growing at a healthy pace with the renovation of K-beauty products & growing requirement for premium personal care products. High wall PET and glass containers are widely used for premium cosmetic brands and herbal health supplements as South Korea focuses heavily on innovative and sustainable packaging.

The company's low-Carbon heavy wall containers are also becoming recyclable with the projections of the target from eco-friendly and refillable packaging are pushing it towards South Korea's environmental regulations. As the e-commerce market and overseas K-beauty exports grow, more and more demand is still remaining for packaging that is both shock-resistant and aesthetically pleasing, so packaging manufacturers are trying to rely on those factors and make packaging that satisfies customers.

Country CAGR (2025 to 2035)
South Korea 10.3%

Competitive Outlook

The heavy wall bottles market operates as a competitive field which serves pharmaceutical and cosmetic sectors and food & beverage and chemicals industries because it provides lasting protective solutions. Heavy wall bottles establish three essential traits through their design because they deliver maximum strength alongside stability along with superior protective capabilities suitable for liquids with high value alongside essential oils and serums and laboratory chemicals.

Leading companies in the market emphasize both premium quality polymer and glass materials together with sustainable packaging developments and regulatory-compliant solutions that serve various industrial requirements. Professional bottle manufacturing along with customized packaging solutions and specialized bottle development form the core group of contributors to this market segment.

Other Key Players

  • SCHOTT AG
  • Nalgene (Thermo Fisher Scientific)
  • O.Berk Company, LLC
  • Berlin Packaging LLC
  • Stoelzle Glass Group
  • Pretium Packaging
  • United States Plastic Corporation

Heavy Wall Bottles Market Segmentation

By Size:

  • 20-30ml
  • 50-80ml
  • 80-120ml
  • 120-150ml
  • 150-200ml

By Industry:

  • Face Care
  • Body Care
  • Perfume
  • Others

By Sales Channel:

  • Hypermarkets/Supermarkets
  • Independent Stores
  • Specialty Stores
  • Multi-brand Stores
  • Online Retailers
  • Direct Sales
  • Other Sales Channel

By Region:

  • North America
  • Latin America
  • Western Europe
  • Eastern Europe
  • East Asia
  • South Asia Pacific
  • Middle East and Africa

Table of Content

  1. Executive Summary
    • Global Market Outlook
    • Demand-side Trends
    • Supply-side Trends
    • Technology Roadmap Analysis
    • Analysis and Recommendations
  2. Market Overview
    • Market Coverage / Taxonomy
    • Market Definition / Scope / Limitations
  3. Market Background
    • Market Dynamics
      • Drivers
      • Restraints
      • Opportunity
      • Trends
    • Scenario Forecast
      • Demand in Optimistic Scenario
      • Demand in Likely Scenario
      • Demand in Conservative Scenario
    • Opportunity Map Analysis
    • Product Life Cycle Analysis
    • Supply Chain Analysis
      • Supply Side Participants and their Roles
        • Manufacturers
        • Mid-Level Participants (Traders/ Agents/ Brokers)
        • Wholesalers and Distributors
      • Value Added in the Supply Chain
      • List of Raw Material Suppliers
      • List of Existing and Potential Buyer’s
    • Investment Feasibility Matrix
    • Value Chain Analysis
      • Profit Margin Analysis
      • Wholesalers and Distributors
      • Retailers
    • PESTLE and Porter’s Analysis
    • Regulatory Landscape
      • By Key Regions
      • By Key Countries
    • Regional Parent Market Outlook
    • Production and Consumption Statistics
    • Import and Export Statistics
  4. Global Market Analysis 2020-2024 and Forecast, 2025-2035
    • Historical Market Size Value (USD Million) & Volume (Units) Analysis, 2020-2024
    • Current and Future Market Size Value (USD Million) & Volume (Units) Projections, 2025-2035
      • Y-o-Y Growth Trend Analysis
      • Absolute $ Opportunity Analysis
  5. Global Market Analysis 2020-2024 and Forecast 2025-2035, By Material Type
    • Introduction / Key Findings
    • Historical Market Size Value (USD Million) & Volume (Units) Analysis By Material Type, 2020-2024
    • Current and Future Market Size Value (USD Million) & Volume (Units) Analysis and Forecast By Material Type, 2025-2035
      • Polyethylene Terephthalate (PET)
      • High-Density Polyethylene (HDPE)
      • Polypropylene (PP)
      • Glass
      • Acrylic
    • Y-o-Y Growth Trend Analysis By Material Type, 2020-2024
    • Absolute $ Opportunity Analysis By Material Type, 2025-2035
  6. Global Market Analysis 2020-2024 and Forecast 2025-2035, By Size
    • Introduction / Key Findings
    • Historical Market Size Value (USD Million) & Volume (Units) Analysis By Size, 2020-2024
    • Current and Future Market Size Value (USD Million) & Volume (Units) Analysis and Forecast By Size, 2025-2035
      • 20-30ml
      • 50-80ml
      • 80-120ml
      • 120-150ml
      • 150-200ml
    • Y-o-Y Growth Trend Analysis By Size, 2020-2024
    • Absolute $ Opportunity Analysis By Size, 2025-2035
  7. Global Market Analysis 2020-2024 and Forecast 2025-2035, By End Use
    • Introduction / Key Findings
    • Historical Market Size Value (USD Million) & Volume (Units) Analysis By End Use, 2020-2024
    • Current and Future Market Size Value (USD Million) & Volume (Units) Analysis and Forecast By End Use, 2025-2035
      • Cosmetics & Personal Care
      • Pharmaceuticals & Nutraceuticals
      • Food & Beverages
      • Chemicals & Industrial Liquids
      • Luxury Packaging
    • Y-o-Y Growth Trend Analysis By End Use, 2020-2024
    • Absolute $ Opportunity Analysis By End Use, 2025-2035
  8. Global Market Analysis 2020-2024 and Forecast 2025-2035, By Sales Channel
    • Introduction / Key Findings
    • Historical Market Size Value (USD Million) & Volume (Units) Analysis By Sales Channel, 2020-2024
    • Current and Future Market Size Value (USD Million) & Volume (Units) Analysis and Forecast By Sales Channel, 2025-2035
      • Hypermarkets/Supermarkets
      • Independent Stores
      • Specialty Stores
      • Multi-brand Stores
      • Online Retailers
      • Direct Sales
      • Other Sales Channel
    • Y-o-Y Growth Trend Analysis By Sales Channel, 2020-2024
    • Absolute $ Opportunity Analysis By Sales Channel, 2025-2035
  9. Global Market Analysis 2020-2024 and Forecast 2025-2035, By Region
    • Introduction
    • Historical Market Size Value (USD Million) & Volume (Units) Analysis By Region, 2020-2024
    • Current Market Size Value (USD Million) & Volume (Units) Analysis and Forecast By Region, 2025-2035
      • North America
      • Latin America
      • Europe
      • East Asia
      • South Asia
      • Oceania
      • MEA
    • Market Attractiveness Analysis By Region
  10. North America Market Analysis 2020-2024 and Forecast 2025-2035, By Country
    • Historical Market Size Value (USD Million) & Volume (Units) Trend Analysis By Market Taxonomy, 2020-2024
    • Market Size Value (USD Million) & Volume (Units) Forecast By Market Taxonomy, 2025-2035
      • By Country
        • USA
        • Canada
      • By Material Type
      • By Size
      • By End Use
      • By Sales Channel
    • Market Attractiveness Analysis
      • By Country
      • By Material Type
      • By Size
      • By End Use
      • By Sales Channel
    • Key Takeaways
  11. Latin America Market Analysis 2020-2024 and Forecast 2025-2035, By Country
    • Historical Market Size Value (USD Million) & Volume (Units) Trend Analysis By Market Taxonomy, 2020-2024
    • Market Size Value (USD Million) & Volume (Units) Forecast By Market Taxonomy, 2025-2035
      • By Country
        • Brazil
        • Mexico
        • Argentina
        • Chile
        • Peru
        • Rest of Latin America
      • By Material Type
      • By Size
      • By End Use
      • By Sales Channel
    • Market Attractiveness Analysis
      • By Country
      • By Material Type
      • By Size
      • By End Use
      • By Sales Channel
    • Key Takeaways
  12. Europe Market Analysis 2020-2024 and Forecast 2025-2035, By Country
    • Historical Market Size Value (USD Million) & Volume (Units) Trend Analysis By Market Taxonomy, 2020-2024
    • Market Size Value (USD Million) & Volume (Units) Forecast By Market Taxonomy, 2025-2035
      • By Country
        • Germany
        • Italy
        • France
        • UK
        • Spain
        • Russia
        • BENELUX
        • Rest of Europe
      • By Material Type
      • By Size
      • By End Use
      • By Sales Channel
    • Market Attractiveness Analysis
      • By Country
      • By Material Type
      • By Size
      • By End Use
      • By Sales Channel
    • Key Takeaways
  13. East Asia Market Analysis 2020-2024 and Forecast 2025-2035, By Country
    • Historical Market Size Value (USD Million) & Volume (Units) Trend Analysis By Market Taxonomy, 2020-2024
    • Market Size Value (USD Million) & Volume (Units) Forecast By Market Taxonomy, 2025-2035
      • By Country
        • China
        • Japan
        • South Korea
      • By Material Type
      • By Size
      • By End Use
      • By Sales Channel
    • Market Attractiveness Analysis
      • By Country
      • By Material Type
      • By Size
      • By End Use
      • By Sales Channel
    • Key Takeaways
  14. South Asia Market Analysis 2020-2024 and Forecast 2025-2035, By Country
    • Historical Market Size Value (USD Million) & Volume (Units) Trend Analysis By Market Taxonomy, 2020-2024
    • Market Size Value (USD Million) & Volume (Units) Forecast By Market Taxonomy, 2025-2035
      • By Country
        • India
        • Thailand
        • Malaysia
        • Indonesia
        • Rest of South Asia
      • By Material Type
      • By Size
      • By End Use
      • By Sales Channel
    • Market Attractiveness Analysis
      • By Country
      • By Material Type
      • By Size
      • By End Use
      • By Sales Channel
    • Key Takeaways
  15. Oceania Market Analysis 2020-2024 and Forecast 2025-2035, By Country
    • Historical Market Size Value (USD Million) & Volume (Units) Trend Analysis By Market Taxonomy, 2020-2024
    • Market Size Value (USD Million) & Volume (Units) Forecast By Market Taxonomy, 2025-2035
      • By Country
        • Australia
        • New Zealand
      • By Material Type
      • By Size
      • By End Use
      • By Sales Channel
    • Market Attractiveness Analysis
      • By Country
      • By Material Type
      • By Size
      • By End Use
      • By Sales Channel
    • Key Takeaways
  16. MEA Market Analysis 2020-2024 and Forecast 2025-2035, By Country
    • Historical Market Size Value (USD Million) & Volume (Units) Trend Analysis By Market Taxonomy, 2020-2024
    • Market Size Value (USD Million) & Volume (Units) Forecast By Market Taxonomy, 2025-2035
      • By Country
        • GCC
        • Rest of MEA
      • By Material Type
      • By Size
      • By End Use
      • By Sales Channel
    • Market Attractiveness Analysis
      • By Country
      • By Material Type
      • By Size
      • By End Use
      • By Sales Channel
    • Key Takeaways
  17. Key Countries Market Analysis
    • USA
      • Pricing Analysis
      • Market Share Analysis, 2024
        • By Material Type
        • By Size
        • By End Use
        • By Sales Channel
    • Canada
      • Pricing Analysis
      • Market Share Analysis, 2024
        • By Material Type
        • By Size
        • By End Use
        • By Sales Channel
    • Brazil
      • Pricing Analysis
      • Market Share Analysis, 2024
        • By Material Type
        • By Size
        • By End Use
        • By Sales Channel
    • Mexico
      • Pricing Analysis
      • Market Share Analysis, 2024
        • By Material Type
        • By Size
        • By End Use
        • By Sales Channel
    • Argentina
      • Pricing Analysis
      • Market Share Analysis, 2024
        • By Material Type
        • By Size
        • By End Use
        • By Sales Channel
  18. Market Structure Analysis
    • Competition Dashboard
    • Competition Benchmarking
    • Market Share Analysis of Top Players
      • By Regional
      • By Material Type
      • By Size
      • By End Use
      • By Sales Channel
  19. Competition Analysis
    • Competition Deep Dive
      • Gerresheimer AG
        • Overview
        • Product Portfolio
        • Profitability by Market Segments (Product/Age /Sales Channel/Region)
        • Sales Footprint
        • Strategy Overview
          • Marketing Strategy
          • Product Strategy
          • Channel Strategy
      • Berry Global Group, Inc.
        • Overview
        • Product Portfolio
        • Profitability by Market Segments (Product/Age /Sales Channel/Region)
        • Sales Footprint
        • Strategy Overview
          • Marketing Strategy
          • Product Strategy
          • Channel Strategy
      • DWK Life Sciences
        • Overview
        • Product Portfolio
        • Profitability by Market Segments (Product/Age /Sales Channel/Region)
        • Sales Footprint
        • Strategy Overview
          • Marketing Strategy
          • Product Strategy
          • Channel Strategy
      • DWK Life Sciences
        • Overview
        • Product Portfolio
        • Profitability by Market Segments (Product/Age /Sales Channel/Region)
        • Sales Footprint
        • Strategy Overview
          • Marketing Strategy
          • Product Strategy
          • Channel Strategy
      • SCHOTT AG
        • Overview
        • Product Portfolio
        • Profitability by Market Segments (Product/Age /Sales Channel/Region)
        • Sales Footprint
        • Strategy Overview
          • Marketing Strategy
          • Product Strategy
          • Channel Strategy
      • O.Berk Company, LLC
        • Overview
        • Product Portfolio
        • Profitability by Market Segments (Product/Age /Sales Channel/Region)
        • Sales Footprint
        • Strategy Overview
          • Marketing Strategy
          • Product Strategy
          • Channel Strategy
      • Berlin Packaging LLC
        • Overview
        • Product Portfolio
        • Profitability by Market Segments (Product/Age /Sales Channel/Region)
        • Sales Footprint
        • Strategy Overview
          • Marketing Strategy
          • Product Strategy
          • Channel Strategy
      • Stoelzle Glass Group
        • Overview
        • Product Portfolio
        • Profitability by Market Segments (Product/Age /Sales Channel/Region)
        • Sales Footprint
        • Strategy Overview
          • Marketing Strategy
          • Product Strategy
          • Channel Strategy
      • Pretium Packaging
        • Overview
        • Product Portfolio
        • Profitability by Market Segments (Product/Age /Sales Channel/Region)
        • Sales Footprint
        • Strategy Overview
          • Marketing Strategy
          • Product Strategy
          • Channel Strategy
      • Value (USD Million) & Volume (Units)ed States Plastic Corporation
        • Overview
        • Product Portfolio
        • Profitability by Market Segments (Product/Age /Sales Channel/Region)
        • Sales Footprint
        • Strategy Overview
          • Marketing Strategy
          • Product Strategy
          • Channel Strategy
  20. Assumptions & Acronyms Used
  21. Research Methodology

List of Tables

  • Table 1: Global Market Value (USD Million) Forecast by Region, 2020-2035
  • Table 2: Global Market Volume (Units) Forecast by Region, 2020-2035
  • Table 3: Global Market Value (USD Million) Forecast by Material Type, 2020-2035
  • Table 4: Global Market Volume (Units) Forecast by Material Type, 2020-2035
  • Table 5: Global Market Value (USD Million) Forecast by Size, 2020-2035
  • Table 6: Global Market Volume (Units) Forecast by Size, 2020-2035
  • Table 7: Global Market Value (USD Million) Forecast by End Use, 2020-2035
  • Table 8: Global Market Volume (Units) Forecast by End Use, 2020-2035
  • Table 9: Global Market Value (USD Million) Forecast by Sales Channel, 2020-2035
  • Table 10: Global Market Volume (Units) Forecast by Sales Channel, 2020-2035
  • Table 11: North America Market Value (USD Million) Forecast by Country, 2020-2035
  • Table 12: North America Market Volume (Units) Forecast by Country, 2020-2035
  • Table 13: North America Market Value (USD Million) Forecast by Material Type, 2020-2035
  • Table 14: North America Market Volume (Units) Forecast by Material Type, 2020-2035
  • Table 15: North America Market Value (USD Million) Forecast by Size, 2020-2035
  • Table 16: North America Market Volume (Units) Forecast by Size, 2020-2035
  • Table 17: North America Market Value (USD Million) Forecast by End Use, 2020-2035
  • Table 18: North America Market Volume (Units) Forecast by End Use, 2020-2035
  • Table 19: North America Market Value (USD Million) Forecast by Sales Channel, 2020-2035
  • Table 20: North America Market Volume (Units) Forecast by Sales Channel, 2020-2035
  • Table 21: Latin America Market Value (USD Million) Forecast by Country, 2020-2035
  • Table 22: Latin America Market Volume (Units) Forecast by Country, 2020-2035
  • Table 23: Latin America Market Value (USD Million) Forecast by Material Type, 2020-2035
  • Table 24: Latin America Market Volume (Units) Forecast by Material Type, 2020-2035
  • Table 25: Latin America Market Value (USD Million) Forecast by Size, 2020-2035
  • Table 26: Latin America Market Volume (Units) Forecast by Size, 2020-2035
  • Table 27: Latin America Market Value (USD Million) Forecast by End Use, 2020-2035
  • Table 28: Latin America Market Volume (Units) Forecast by End Use, 2020-2035
  • Table 29: Latin America Market Value (USD Million) Forecast by Sales Channel, 2020-2035
  • Table 30: Latin America Market Volume (Units) Forecast by Sales Channel, 2020-2035
  • Table 31: Europe Market Value (USD Million) Forecast by Country, 2020-2035
  • Table 32: Europe Market Volume (Units) Forecast by Country, 2020-2035
  • Table 33: Europe Market Value (USD Million) Forecast by Material Type, 2020-2035
  • Table 34: Europe Market Volume (Units) Forecast by Material Type, 2020-2035
  • Table 35: Europe Market Value (USD Million) Forecast by Size, 2020-2035
  • Table 36: Europe Market Volume (Units) Forecast by Size, 2020-2035
  • Table 37: Europe Market Value (USD Million) Forecast by End Use, 2020-2035
  • Table 38: Europe Market Volume (Units) Forecast by End Use, 2020-2035
  • Table 39: Europe Market Value (USD Million) Forecast by Sales Channel, 2020-2035
  • Table 40: Europe Market Volume (Units) Forecast by Sales Channel, 2020-2035
  • Table 41: East Asia Market Value (USD Million) Forecast by Country, 2020-2035
  • Table 42: East Asia Market Volume (Units) Forecast by Country, 2020-2035
  • Table 43: East Asia Market Value (USD Million) Forecast by Material Type, 2020-2035
  • Table 44: East Asia Market Volume (Units) Forecast by Material Type, 2020-2035
  • Table 45: East Asia Market Value (USD Million) Forecast by Size, 2020-2035
  • Table 46: East Asia Market Volume (Units) Forecast by Size, 2020-2035
  • Table 47: East Asia Market Value (USD Million) Forecast by End Use, 2020-2035
  • Table 48: East Asia Market Volume (Units) Forecast by End Use, 2020-2035
  • Table 49: East Asia Market Value (USD Million) Forecast by Sales Channel, 2020-2035
  • Table 50: East Asia Market Volume (Units) Forecast by Sales Channel, 2020-2035
  • Table 51: South Asia Market Value (USD Million) Forecast by Country, 2020-2035
  • Table 52: South Asia Market Volume (Units) Forecast by Country, 2020-2035
  • Table 53: South Asia Market Value (USD Million) Forecast by Material Type, 2020-2035
  • Table 54: South Asia Market Volume (Units) Forecast by Material Type, 2020-2035
  • Table 55: South Asia Market Value (USD Million) Forecast by Size, 2020-2035
  • Table 56: South Asia Market Volume (Units) Forecast by Size, 2020-2035
  • Table 57: South Asia Market Value (USD Million) Forecast by End Use, 2020-2035
  • Table 58: South Asia Market Volume (Units) Forecast by End Use, 2020-2035
  • Table 59: South Asia Market Value (USD Million) Forecast by Sales Channel, 2020-2035
  • Table 60: South Asia Market Volume (Units) Forecast by Sales Channel, 2020-2035
  • Table 61: Oceania Market Value (USD Million) Forecast by Country, 2020-2035
  • Table 62: Oceania Market Volume (Units) Forecast by Country, 2020-2035
  • Table 63: Oceania Market Value (USD Million) Forecast by Material Type, 2020-2035
  • Table 64: Oceania Market Volume (Units) Forecast by Material Type, 2020-2035
  • Table 65: Oceania Market Value (USD Million) Forecast by Size, 2020-2035
  • Table 66: Oceania Market Volume (Units) Forecast by Size, 2020-2035
  • Table 67: Oceania Market Value (USD Million) Forecast by End Use, 2020-2035
  • Table 68: Oceania Market Volume (Units) Forecast by End Use, 2020-2035
  • Table 69: Oceania Market Value (USD Million) Forecast by Sales Channel, 2020-2035
  • Table 70: Oceania Market Volume (Units) Forecast by Sales Channel, 2020-2035
  • Table 71: MEA Market Value (USD Million) Forecast by Country, 2020-2035
  • Table 72: MEA Market Volume (Units) Forecast by Country, 2020-2035
  • Table 73: MEA Market Value (USD Million) Forecast by Material Type, 2020-2035
  • Table 74: MEA Market Volume (Units) Forecast by Material Type, 2020-2035
  • Table 75: MEA Market Value (USD Million) Forecast by Size, 2020-2035
  • Table 76: MEA Market Volume (Units) Forecast by Size, 2020-2035
  • Table 77: MEA Market Value (USD Million) Forecast by End Use, 2020-2035
  • Table 78: MEA Market Volume (Units) Forecast by End Use, 2020-2035
  • Table 79: MEA Market Value (USD Million) Forecast by Sales Channel, 2020-2035
  • Table 80: MEA Market Volume (Units) Forecast by Sales Channel, 2020-2035

List of Figures

  • Figure 1: Global Market Value (USD Million) by Material Type, 2025-2035
  • Figure 2: Global Market Value (USD Million) by Size, 2025-2035
  • Figure 3: Global Market Value (USD Million) by End Use, 2025-2035
  • Figure 4: Global Market Value (USD Million) by Sales Channel, 2025-2035
  • Figure 5: Global Market Value (USD Million) by Region, 2025-2035
  • Figure 6: Global Market Value (USD Million) Analysis by Region, 2020-2035
  • Figure 7: Global Market Volume (Units) Analysis by Region, 2020-2035
  • Figure 8: Global Market Value Share (%) and BPS Analysis by Region, 2025-2035
  • Figure 9: Global Market Y-o-Y Growth (%) Projections by Region, 2025-2035
  • Figure 10: Global Market Value (USD Million) Analysis by Material Type, 2020-2035
  • Figure 11: Global Market Volume (Units) Analysis by Material Type, 2020-2035
  • Figure 12: Global Market Value Share (%) and BPS Analysis by Material Type, 2025-2035
  • Figure 13: Global Market Y-o-Y Growth (%) Projections by Material Type, 2025-2035
  • Figure 14: Global Market Value (USD Million) Analysis by Size, 2020-2035
  • Figure 15: Global Market Volume (Units) Analysis by Size, 2020-2035
  • Figure 16: Global Market Value Share (%) and BPS Analysis by Size, 2025-2035
  • Figure 17: Global Market Y-o-Y Growth (%) Projections by Size, 2025-2035
  • Figure 18: Global Market Value (USD Million) Analysis by End Use, 2020-2035
  • Figure 19: Global Market Volume (Units) Analysis by End Use, 2020-2035
  • Figure 20: Global Market Value Share (%) and BPS Analysis by End Use, 2025-2035
  • Figure 21: Global Market Y-o-Y Growth (%) Projections by End Use, 2025-2035
  • Figure 22: Global Market Value (USD Million) Analysis by Sales Channel, 2020-2035
  • Figure 23: Global Market Volume (Units) Analysis by Sales Channel, 2020-2035
  • Figure 24: Global Market Value Share (%) and BPS Analysis by Sales Channel, 2025-2035
  • Figure 25: Global Market Y-o-Y Growth (%) Projections by Sales Channel, 2025-2035
  • Figure 26: Global Market Attractiveness by Material Type, 2025-2035
  • Figure 27: Global Market Attractiveness by Size, 2025-2035
  • Figure 28: Global Market Attractiveness by End Use, 2025-2035
  • Figure 29: Global Market Attractiveness by Sales Channel, 2025-2035
  • Figure 30: Global Market Attractiveness by Region, 2025-2035
  • Figure 31: North America Market Value (USD Million) by Material Type, 2025-2035
  • Figure 32: North America Market Value (USD Million) by Size, 2025-2035
  • Figure 33: North America Market Value (USD Million) by End Use, 2025-2035
  • Figure 34: North America Market Value (USD Million) by Sales Channel, 2025-2035
  • Figure 35: North America Market Value (USD Million) by Country, 2025-2035
  • Figure 36: North America Market Value (USD Million) Analysis by Country, 2020-2035
  • Figure 37: North America Market Volume (Units) Analysis by Country, 2020-2035
  • Figure 38: North America Market Value Share (%) and BPS Analysis by Country, 2025-2035
  • Figure 39: North America Market Y-o-Y Growth (%) Projections by Country, 2025-2035
  • Figure 40: North America Market Value (USD Million) Analysis by Material Type, 2020-2035
  • Figure 41: North America Market Volume (Units) Analysis by Material Type, 2020-2035
  • Figure 42: North America Market Value Share (%) and BPS Analysis by Material Type, 2025-2035
  • Figure 43: North America Market Y-o-Y Growth (%) Projections by Material Type, 2025-2035
  • Figure 44: North America Market Value (USD Million) Analysis by Size, 2020-2035
  • Figure 45: North America Market Volume (Units) Analysis by Size, 2020-2035
  • Figure 46: North America Market Value Share (%) and BPS Analysis by Size, 2025-2035
  • Figure 47: North America Market Y-o-Y Growth (%) Projections by Size, 2025-2035
  • Figure 48: North America Market Value (USD Million) Analysis by End Use, 2020-2035
  • Figure 49: North America Market Volume (Units) Analysis by End Use, 2020-2035
  • Figure 50: North America Market Value Share (%) and BPS Analysis by End Use, 2025-2035
  • Figure 51: North America Market Y-o-Y Growth (%) Projections by End Use, 2025-2035
  • Figure 52: North America Market Value (USD Million) Analysis by Sales Channel, 2020-2035
  • Figure 53: North America Market Volume (Units) Analysis by Sales Channel, 2020-2035
  • Figure 54: North America Market Value Share (%) and BPS Analysis by Sales Channel, 2025-2035
  • Figure 55: North America Market Y-o-Y Growth (%) Projections by Sales Channel, 2025-2035
  • Figure 56: North America Market Attractiveness by Material Type, 2025-2035
  • Figure 57: North America Market Attractiveness by Size, 2025-2035
  • Figure 58: North America Market Attractiveness by End Use, 2025-2035
  • Figure 59: North America Market Attractiveness by Sales Channel, 2025-2035
  • Figure 60: North America Market Attractiveness by Country, 2025-2035
  • Figure 61: Latin America Market Value (USD Million) by Material Type, 2025-2035
  • Figure 62: Latin America Market Value (USD Million) by Size, 2025-2035
  • Figure 63: Latin America Market Value (USD Million) by End Use, 2025-2035
  • Figure 64: Latin America Market Value (USD Million) by Sales Channel, 2025-2035
  • Figure 65: Latin America Market Value (USD Million) by Country, 2025-2035
  • Figure 66: Latin America Market Value (USD Million) Analysis by Country, 2020-2035
  • Figure 67: Latin America Market Volume (Units) Analysis by Country, 2020-2035
  • Figure 68: Latin America Market Value Share (%) and BPS Analysis by Country, 2025-2035
  • Figure 69: Latin America Market Y-o-Y Growth (%) Projections by Country, 2025-2035
  • Figure 70: Latin America Market Value (USD Million) Analysis by Material Type, 2020-2035
  • Figure 71: Latin America Market Volume (Units) Analysis by Material Type, 2020-2035
  • Figure 72: Latin America Market Value Share (%) and BPS Analysis by Material Type, 2025-2035
  • Figure 73: Latin America Market Y-o-Y Growth (%) Projections by Material Type, 2025-2035
  • Figure 74: Latin America Market Value (USD Million) Analysis by Size, 2020-2035
  • Figure 75: Latin America Market Volume (Units) Analysis by Size, 2020-2035
  • Figure 76: Latin America Market Value Share (%) and BPS Analysis by Size, 2025-2035
  • Figure 77: Latin America Market Y-o-Y Growth (%) Projections by Size, 2025-2035
  • Figure 78: Latin America Market Value (USD Million) Analysis by End Use, 2020-2035
  • Figure 79: Latin America Market Volume (Units) Analysis by End Use, 2020-2035
  • Figure 80: Latin America Market Value Share (%) and BPS Analysis by End Use, 2025-2035
  • Figure 81: Latin America Market Y-o-Y Growth (%) Projections by End Use, 2025-2035
  • Figure 82: Latin America Market Value (USD Million) Analysis by Sales Channel, 2020-2035
  • Figure 83: Latin America Market Volume (Units) Analysis by Sales Channel, 2020-2035
  • Figure 84: Latin America Market Value Share (%) and BPS Analysis by Sales Channel, 2025-2035
  • Figure 85: Latin America Market Y-o-Y Growth (%) Projections by Sales Channel, 2025-2035
  • Figure 86: Latin America Market Attractiveness by Material Type, 2025-2035
  • Figure 87: Latin America Market Attractiveness by Size, 2025-2035
  • Figure 88: Latin America Market Attractiveness by End Use, 2025-2035
  • Figure 89: Latin America Market Attractiveness by Sales Channel, 2025-2035
  • Figure 90: Latin America Market Attractiveness by Country, 2025-2035
  • Figure 91: Europe Market Value (USD Million) by Material Type, 2025-2035
  • Figure 92: Europe Market Value (USD Million) by Size, 2025-2035
  • Figure 93: Europe Market Value (USD Million) by End Use, 2025-2035
  • Figure 94: Europe Market Value (USD Million) by Sales Channel, 2025-2035
  • Figure 95: Europe Market Value (USD Million) by Country, 2025-2035
  • Figure 96: Europe Market Value (USD Million) Analysis by Country, 2020-2035
  • Figure 97: Europe Market Volume (Units) Analysis by Country, 2020-2035
  • Figure 98: Europe Market Value Share (%) and BPS Analysis by Country, 2025-2035
  • Figure 99: Europe Market Y-o-Y Growth (%) Projections by Country, 2025-2035
  • Figure 100: Europe Market Value (USD Million) Analysis by Material Type, 2020-2035
  • Figure 101: Europe Market Volume (Units) Analysis by Material Type, 2020-2035
  • Figure 102: Europe Market Value Share (%) and BPS Analysis by Material Type, 2025-2035
  • Figure 103: Europe Market Y-o-Y Growth (%) Projections by Material Type, 2025-2035
  • Figure 104: Europe Market Value (USD Million) Analysis by Size, 2020-2035
  • Figure 105: Europe Market Volume (Units) Analysis by Size, 2020-2035
  • Figure 106: Europe Market Value Share (%) and BPS Analysis by Size, 2025-2035
  • Figure 107: Europe Market Y-o-Y Growth (%) Projections by Size, 2025-2035
  • Figure 108: Europe Market Value (USD Million) Analysis by End Use, 2020-2035
  • Figure 109: Europe Market Volume (Units) Analysis by End Use, 2020-2035
  • Figure 110: Europe Market Value Share (%) and BPS Analysis by End Use, 2025-2035
  • Figure 111: Europe Market Y-o-Y Growth (%) Projections by End Use, 2025-2035
  • Figure 112: Europe Market Value (USD Million) Analysis by Sales Channel, 2020-2035
  • Figure 113: Europe Market Volume (Units) Analysis by Sales Channel, 2020-2035
  • Figure 114: Europe Market Value Share (%) and BPS Analysis by Sales Channel, 2025-2035
  • Figure 115: Europe Market Y-o-Y Growth (%) Projections by Sales Channel, 2025-2035
  • Figure 116: Europe Market Attractiveness by Material Type, 2025-2035
  • Figure 117: Europe Market Attractiveness by Size, 2025-2035
  • Figure 118: Europe Market Attractiveness by End Use, 2025-2035
  • Figure 119: Europe Market Attractiveness by Sales Channel, 2025-2035
  • Figure 120: Europe Market Attractiveness by Country, 2025-2035
  • Figure 121: East Asia Market Value (USD Million) by Material Type, 2025-2035
  • Figure 122: East Asia Market Value (USD Million) by Size, 2025-2035
  • Figure 123: East Asia Market Value (USD Million) by End Use, 2025-2035
  • Figure 124: East Asia Market Value (USD Million) by Sales Channel, 2025-2035
  • Figure 125: East Asia Market Value (USD Million) by Country, 2025-2035
  • Figure 126: East Asia Market Value (USD Million) Analysis by Country, 2020-2035
  • Figure 127: East Asia Market Volume (Units) Analysis by Country, 2020-2035
  • Figure 128: East Asia Market Value Share (%) and BPS Analysis by Country, 2025-2035
  • Figure 129: East Asia Market Y-o-Y Growth (%) Projections by Country, 2025-2035
  • Figure 130: East Asia Market Value (USD Million) Analysis by Material Type, 2020-2035
  • Figure 131: East Asia Market Volume (Units) Analysis by Material Type, 2020-2035
  • Figure 132: East Asia Market Value Share (%) and BPS Analysis by Material Type, 2025-2035
  • Figure 133: East Asia Market Y-o-Y Growth (%) Projections by Material Type, 2025-2035
  • Figure 134: East Asia Market Value (USD Million) Analysis by Size, 2020-2035
  • Figure 135: East Asia Market Volume (Units) Analysis by Size, 2020-2035
  • Figure 136: East Asia Market Value Share (%) and BPS Analysis by Size, 2025-2035
  • Figure 137: East Asia Market Y-o-Y Growth (%) Projections by Size, 2025-2035
  • Figure 138: East Asia Market Value (USD Million) Analysis by End Use, 2020-2035
  • Figure 139: East Asia Market Volume (Units) Analysis by End Use, 2020-2035
  • Figure 140: East Asia Market Value Share (%) and BPS Analysis by End Use, 2025-2035
  • Figure 141: East Asia Market Y-o-Y Growth (%) Projections by End Use, 2025-2035
  • Figure 142: East Asia Market Value (USD Million) Analysis by Sales Channel, 2020-2035
  • Figure 143: East Asia Market Volume (Units) Analysis by Sales Channel, 2020-2035
  • Figure 144: East Asia Market Value Share (%) and BPS Analysis by Sales Channel, 2025-2035
  • Figure 145: East Asia Market Y-o-Y Growth (%) Projections by Sales Channel, 2025-2035
  • Figure 146: East Asia Market Attractiveness by Material Type, 2025-2035
  • Figure 147: East Asia Market Attractiveness by Size, 2025-2035
  • Figure 148: East Asia Market Attractiveness by End Use, 2025-2035
  • Figure 149: East Asia Market Attractiveness by Sales Channel, 2025-2035
  • Figure 150: East Asia Market Attractiveness by Country, 2025-2035
  • Figure 151: South Asia Market Value (USD Million) by Material Type, 2025-2035
  • Figure 152: South Asia Market Value (USD Million) by Size, 2025-2035
  • Figure 153: South Asia Market Value (USD Million) by End Use, 2025-2035
  • Figure 154: South Asia Market Value (USD Million) by Sales Channel, 2025-2035
  • Figure 155: South Asia Market Value (USD Million) by Country, 2025-2035
  • Figure 156: South Asia Market Value (USD Million) Analysis by Country, 2020-2035
  • Figure 157: South Asia Market Volume (Units) Analysis by Country, 2020-2035
  • Figure 158: South Asia Market Value Share (%) and BPS Analysis by Country, 2025-2035
  • Figure 159: South Asia Market Y-o-Y Growth (%) Projections by Country, 2025-2035
  • Figure 160: South Asia Market Value (USD Million) Analysis by Material Type, 2020-2035
  • Figure 161: South Asia Market Volume (Units) Analysis by Material Type, 2020-2035
  • Figure 162: South Asia Market Value Share (%) and BPS Analysis by Material Type, 2025-2035
  • Figure 163: South Asia Market Y-o-Y Growth (%) Projections by Material Type, 2025-2035
  • Figure 164: South Asia Market Value (USD Million) Analysis by Size, 2020-2035
  • Figure 165: South Asia Market Volume (Units) Analysis by Size, 2020-2035
  • Figure 166: South Asia Market Value Share (%) and BPS Analysis by Size, 2025-2035
  • Figure 167: South Asia Market Y-o-Y Growth (%) Projections by Size, 2025-2035
  • Figure 168: South Asia Market Value (USD Million) Analysis by End Use, 2020-2035
  • Figure 169: South Asia Market Volume (Units) Analysis by End Use, 2020-2035
  • Figure 170: South Asia Market Value Share (%) and BPS Analysis by End Use, 2025-2035
  • Figure 171: South Asia Market Y-o-Y Growth (%) Projections by End Use, 2025-2035
  • Figure 172: South Asia Market Value (USD Million) Analysis by Sales Channel, 2020-2035
  • Figure 173: South Asia Market Volume (Units) Analysis by Sales Channel, 2020-2035
  • Figure 174: South Asia Market Value Share (%) and BPS Analysis by Sales Channel, 2025-2035
  • Figure 175: South Asia Market Y-o-Y Growth (%) Projections by Sales Channel, 2025-2035
  • Figure 176: South Asia Market Attractiveness by Material Type, 2025-2035
  • Figure 177: South Asia Market Attractiveness by Size, 2025-2035
  • Figure 178: South Asia Market Attractiveness by End Use, 2025-2035
  • Figure 179: South Asia Market Attractiveness by Sales Channel, 2025-2035
  • Figure 180: South Asia Market Attractiveness by Country, 2025-2035
  • Figure 181: Oceania Market Value (USD Million) by Material Type, 2025-2035
  • Figure 182: Oceania Market Value (USD Million) by Size, 2025-2035
  • Figure 183: Oceania Market Value (USD Million) by End Use, 2025-2035
  • Figure 184: Oceania Market Value (USD Million) by Sales Channel, 2025-2035
  • Figure 185: Oceania Market Value (USD Million) by Country, 2025-2035
  • Figure 186: Oceania Market Value (USD Million) Analysis by Country, 2020-2035
  • Figure 187: Oceania Market Volume (Units) Analysis by Country, 2020-2035
  • Figure 188: Oceania Market Value Share (%) and BPS Analysis by Country, 2025-2035
  • Figure 189: Oceania Market Y-o-Y Growth (%) Projections by Country, 2025-2035
  • Figure 190: Oceania Market Value (USD Million) Analysis by Material Type, 2020-2035
  • Figure 191: Oceania Market Volume (Units) Analysis by Material Type, 2020-2035
  • Figure 192: Oceania Market Value Share (%) and BPS Analysis by Material Type, 2025-2035
  • Figure 193: Oceania Market Y-o-Y Growth (%) Projections by Material Type, 2025-2035
  • Figure 194: Oceania Market Value (USD Million) Analysis by Size, 2020-2035
  • Figure 195: Oceania Market Volume (Units) Analysis by Size, 2020-2035
  • Figure 196: Oceania Market Value Share (%) and BPS Analysis by Size, 2025-2035
  • Figure 197: Oceania Market Y-o-Y Growth (%) Projections by Size, 2025-2035
  • Figure 198: Oceania Market Value (USD Million) Analysis by End Use, 2020-2035
  • Figure 199: Oceania Market Volume (Units) Analysis by End Use, 2020-2035
  • Figure 200: Oceania Market Value Share (%) and BPS Analysis by End Use, 2025-2035
  • Figure 201: Oceania Market Y-o-Y Growth (%) Projections by End Use, 2025-2035
  • Figure 202: Oceania Market Value (USD Million) Analysis by Sales Channel, 2020-2035
  • Figure 203: Oceania Market Volume (Units) Analysis by Sales Channel, 2020-2035
  • Figure 204: Oceania Market Value Share (%) and BPS Analysis by Sales Channel, 2025-2035
  • Figure 205: Oceania Market Y-o-Y Growth (%) Projections by Sales Channel, 2025-2035
  • Figure 206: Oceania Market Attractiveness by Material Type, 2025-2035
  • Figure 207: Oceania Market Attractiveness by Size, 2025-2035
  • Figure 208: Oceania Market Attractiveness by End Use, 2025-2035
  • Figure 209: Oceania Market Attractiveness by Sales Channel, 2025-2035
  • Figure 210: Oceania Market Attractiveness by Country, 2025-2035
  • Figure 211: MEA Market Value (USD Million) by Material Type, 2025-2035
  • Figure 212: MEA Market Value (USD Million) by Size, 2025-2035
  • Figure 213: MEA Market Value (USD Million) by End Use, 2025-2035
  • Figure 214: MEA Market Value (USD Million) by Sales Channel, 2025-2035
  • Figure 215: MEA Market Value (USD Million) by Country, 2025-2035
  • Figure 216: MEA Market Value (USD Million) Analysis by Country, 2020-2035
  • Figure 217: MEA Market Volume (Units) Analysis by Country, 2020-2035
  • Figure 218: MEA Market Value Share (%) and BPS Analysis by Country, 2025-2035
  • Figure 219: MEA Market Y-o-Y Growth (%) Projections by Country, 2025-2035
  • Figure 220: MEA Market Value (USD Million) Analysis by Material Type, 2020-2035
  • Figure 221: MEA Market Volume (Units) Analysis by Material Type, 2020-2035
  • Figure 222: MEA Market Value Share (%) and BPS Analysis by Material Type, 2025-2035
  • Figure 223: MEA Market Y-o-Y Growth (%) Projections by Material Type, 2025-2035
  • Figure 224: MEA Market Value (USD Million) Analysis by Size, 2020-2035
  • Figure 225: MEA Market Volume (Units) Analysis by Size, 2020-2035
  • Figure 226: MEA Market Value Share (%) and BPS Analysis by Size, 2025-2035
  • Figure 227: MEA Market Y-o-Y Growth (%) Projections by Size, 2025-2035
  • Figure 228: MEA Market Value (USD Million) Analysis by End Use, 2020-2035
  • Figure 229: MEA Market Volume (Units) Analysis by End Use, 2020-2035
  • Figure 230: MEA Market Value Share (%) and BPS Analysis by End Use, 2025-2035
  • Figure 231: MEA Market Y-o-Y Growth (%) Projections by End Use, 2025-2035
  • Figure 232: MEA Market Value (USD Million) Analysis by Sales Channel, 2020-2035
  • Figure 233: MEA Market Volume (Units) Analysis by Sales Channel, 2020-2035
  • Figure 234: MEA Market Value Share (%) and BPS Analysis by Sales Channel, 2025-2035
  • Figure 235: MEA Market Y-o-Y Growth (%) Projections by Sales Channel, 2025-2035
  • Figure 236: MEA Market Attractiveness by Material Type, 2025-2035
  • Figure 237: MEA Market Attractiveness by Size, 2025-2035
  • Figure 238: MEA Market Attractiveness by End Use, 2025-2035
  • Figure 239: MEA Market Attractiveness by Sales Channel, 2025-2035
  • Figure 240: MEA Market Attractiveness by Country, 2025-2035

Frequently Asked Questions

What was the overall size of the heavy wall bottles market in 2025?

The overall market size for the heavy wall bottles market was USD 8.3 billion in 2025.

How big is the heavy wall bottles market expected to be in 2035?

The heavy wall bottles market is expected to reach USD 10.1 billion in 2035.

What will drive the demand for the heavy wall bottles market during the forecast period?

The increasing demand for premium packaging solutions, rising adoption in the cosmetics and personal care industries, and growing preference for sustainable and durable packaging materials fuel the heavy wall bottles market during the forecast period.

List the top 5 countries contributing to the heavy wall bottles market.

The top 5 countries driving the development of the heavy wall bottles market are the USA, UK, European Union, Japan, and South Korea.

Which segment in type is expected to lead in the heavy wall bottles market?

50-80ml bottles and face care segments lead market growth to command a significant share over the assessment period.

Explore Similar Insights

Future Market Insights

Heavy Wall Bottles Market