Hair Bond Multiplier Market Size and Share Forecast Outlook 2025 to 2035

The Hair Bond Multiplier Market is estimated to be valued at USD 213.5 million in 2025 and is projected to reach USD 358.6 million by 2035, registering a compound annual growth rate (CAGR) of 5.3% over the forecast period.
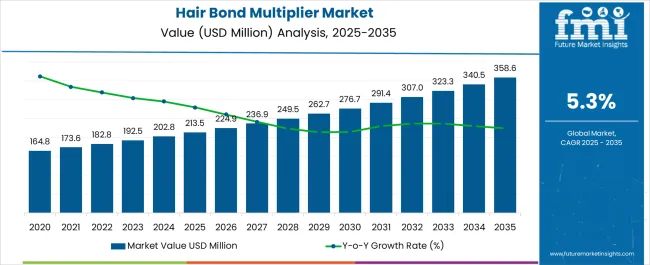
Quick Stats for Hair Bond Multiplier Market

  • Hair Bond Multiplier Market Industry Value (2025): USD 213.5 million
  • Hair Bond Multiplier Market Forecast Value (2035): USD 358.6 million
  • Hair Bond Multiplier Market Forecast CAGR: 5.3%
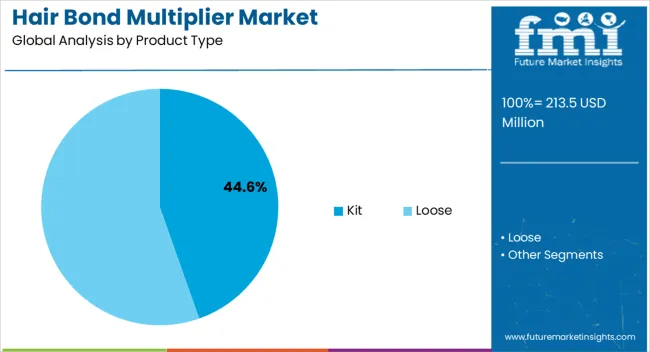
  • Leading Segment in Hair Bond Multiplier Market in 2025: Kit (44.6%)
  • Key Growth Region in Hair Bond Multiplier Market: North America, Asia-Pacific, Europe
  • Top Key Players in Hair Bond Multiplier Market: L’Oréal S.A., Olaplex LLC., Croda International Plc., Henkel AG & Co. KGaA, Keune Haircosmetics Manufacturing B.V., Lakmé Lever Private Limited, Earthly Body, Inc., Brazilian Professionals LLC., Affinage Salon Professional Limited., Unilever
Hair Bond Multiplier Market Market Value Analysis
Metric Value
Hair Bond Multiplier Market Estimated Value in (2025 E) USD 213.5 million
Hair Bond Multiplier Market Forecast Value in (2035 F) USD 358.6 million
Forecast CAGR (2025 to 2035) 5.3%

Rationale for Segmental Growth in the Hair Bond Multiplier Market

The hair bond multiplier market is expanding steadily, supported by the rising demand for premium hair care solutions and increased consumer focus on hair health during chemical treatments. Industry reports and brand announcements have emphasized the growing popularity of products that repair and protect hair bonds from damage caused by coloring, bleaching, and heat styling.

Product innovation has been a major driver, with companies introducing advanced formulations enriched with strengthening and conditioning agents. Rising disposable incomes and lifestyle changes have led to greater consumer spending on salon-based treatments, further accelerating adoption.

Marketing campaigns highlighting professional-grade results and long-term hair protection have enhanced product visibility across global markets. Additionally, the trend of frequent hair coloring and chemical styling has increased consumer reliance on bond multipliers to minimize hair damage. Looking forward, continuous advancements in product formulations, coupled with growing penetration in emerging economies through e-commerce and salon partnerships, are expected to sustain strong growth momentum.
Segmental Analysis

Insights into the Product Type Segment: Kit

Hair Bond Multiplier Market Analysis By Product Type

The Kit segment is projected to contribute 44.60% of the hair bond multiplier market revenue in 2025, establishing itself as the leading product type. Growth of this segment has been driven by the convenience offered to both professionals and consumers, as kits typically include multiple components that work in sequence to repair and protect hair bonds.

Brands have promoted kit formats as comprehensive solutions that enhance treatment outcomes, appealing to salons for professional use and consumers seeking salon-like results at home. The combination of ease of application, bundled value, and consistent results has fueled their widespread adoption.

Furthermore, product kits have gained traction in promotional campaigns and retail packaging strategies, making them a preferred choice for gifting and repeat purchases. With consumer interest in complete, ready-to-use hair care solutions continuing to rise, the Kit segment is expected to maintain its dominant position in the product type category.
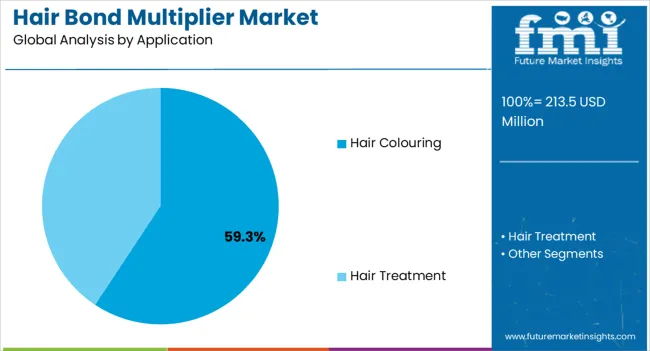
Insights into the Application Segment: Hair Colouring

Hair Bond Multiplier Market Analysis By Application

The Hair Colouring segment is projected to account for 59.30% of the hair bond multiplier market revenue in 2025, positioning itself as the dominant application. This segment’s strength has been shaped by the increasing frequency of hair dyeing and bleaching, which are known to cause structural hair damage.

Bond multipliers have become integral in coloring services, as they protect the hair shaft and maintain strength during chemical exposure. Professional stylists and salons have integrated these products into standard coloring protocols, responding to consumer demand for safe, damage-free color treatments.

Industry updates have emphasized how product efficacy in reducing breakage and improving hair texture has driven higher adoption rates. Additionally, marketing efforts showcasing before-and-after results of hair coloring with bond multipliers have reinforced their importance. As hair coloring trends continue to grow globally, the Hair Colouring segment is expected to sustain its leadership in application use.
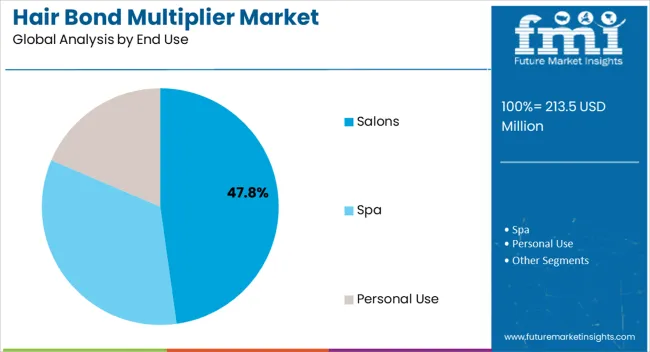
Insights into the End Use Segment: Salons

Hair Bond Multiplier Market Analysis By End Use

The Salons segment is projected to hold 47.80% of the hair bond multiplier market revenue in 2025, confirming its role as the primary end-use channel. Growth of this segment has been attributed to the reliance of professional hairstylists on bond multipliers to deliver high-quality results in coloring, bleaching, and chemical treatments.

Salons have increasingly adopted bond multipliers to enhance client satisfaction by reducing hair damage and improving post-treatment hair health. Annual reports and press releases from beauty brands have highlighted collaborations with salon chains to introduce specialized bond protection services.

The salon environment also provides a platform for direct consumer education, where stylists recommend bond multipliers for at-home maintenance, thereby driving repeat purchases. As the demand for premium hair care experiences rises, particularly in urban centers, salons are expected to remain the dominant end-use channel, supported by professional expertise and client trust.

Historical Sales Analysis Compared to Demand Outlook

The hair bond multiplier market was valued at USD 213.5 million in 2025. The market was driven by the growing interest of consumers in haircare brands and maintaining hair health.

The market is expected to be driven by the increasing awareness about the harsh chemicals used in hair styling and the rising preference for natural hair care and grooming products. The demand for these products is expected to reach USD 358.6 million by 2035.

Consumption Analysis of Hair Bond Multiplier Products

  • The major users of hair bond multiplier products are millennial youth, who like to experiment with their hairstyles and frequently undergo hair bleaching, coloring, and chemical treatments.
  • People with chemically processed hair are also one of the major users of such products. A hair bond multiplier can really help people whose hair strands have become weaker due to the regular use of chemicals.
  • Actors and make-up artists who have to constantly change their hairstyle also fall under the category of hair bond multiplier users. Their profession demands changes in appearance on a regular basis, and frequent use of chemicals damages the health of the hair.
  • People with genetically weaker hair can also benefit from using hair bond multiplier products. The products are designed to repair hair structural bonds, which strengthen the hair quality of individuals with thinner, weaker, or damaged hair.

Factors Driving Expansion of Hair Bond Multipliers Market

Hair Experimentation: A lot of youth these days are very flexible when it comes to frequently changing their hairstyles, hair color, and hair orientation. Hair bond multipliers help them lessen the damage during these transitions by rejuvenating the hydrogen-sulphide bond present in the hair.

Celebrity Endorsements: Social media influencers with millions of virtual followers are one of the key promoters of hair bond multipliers in the market. Their influence plays a major role in bringing a large number of potential customers under the purview of leading players in the market.Easy Advertisements: Thanks to the short video platforms, brands can easily target their audience with product benefits, thus making the advertisements more easy, effective, and insightful. A lot of the millennial population is on these platforms and gets attracted to these products because of this.

Surging Disposable Incomes: The rise in the disposable incomes of individuals all over the world is also considered a prime factor in the growth of the hair bond multiplier market. With individuals paying more attention to hair health, these numbers are bound to grow in the upcoming years.

Influx of Big Brands: Hair Bond Multiplier was a patented product of Olaplex, a US-based hair treatment company with over 100 worldwide patents. With time, the market has experienced an influx of companies, which include L’Oréal S.A., Croda International Plc., Lakme Lever Private Limited, Earthly Body Inc., and many more.

Factors Restraining Hair Bond Multiplier Market

High Costs: Although very effective, hair bond multiplier products are very expensive as compared to other hair care products. This will keep a large number of people who fall into the low-income bracket away from using such products. The current recessionary economy in prominent countries can lead to people spending very little on luxurious hair care items.

Emphasis on Chemical-Free Hair: In these subsequent years, the shift in focus toward treatment-free, natural hair can be another major factor that can slow down the market expansion of hair bond multipliers in the long term. As hair bond multipliers are only used when the hair undergoes regular treatment, this rising trend can lead to reduced consumer demand in the coming years.

Availability of Options: Hair care consists of a plethora of products and treatments. With already a lot of options for individuals to choose from, hair bond multiplier companies have to put a lot of effort into instilling trust in people’s minds regarding the benefits of their product.

Cheaper Substitutes: The market is already filled with inexpensive products such as deep conditioning shampoos, protein treatments, and natural DIY remedies that have a strong foothold in the hearts of people. Their effectiveness at a cheaper cost will definitely be a limiting factor for the growth in revenue of the hair bond multiplier market.

Region-wise Insights

North America Tops the Hair Bond Multiplier’s User Chart

Geographically speaking, the North American region has been the largest user of hair bond multiplier products. It holds a revenue share of 43.1% of the global hair bond multiplier market. The presence of internationally renowned influencers and the tendency of people to follow their fashion idols are the major reasons for this region to top the list.

Attributes Market Share
North America Market Share (2025) 43.1%

The presence of pollutants in the air, coupled with high individual incomes, is also one of the driving forces behind the expansion of the market in this region.

Rising Salon Culture Contributing to Surging Revenue Growth in Asia Pacific Region

Urbanization, the large youth population in countries like India and China, and exposure to Western culture are considered to be some of the major reasons for the popularity of hair bond multiplier products in this region. With awareness towards hair care, even among men, the Asia-Pacific region has experienced a significant surge in the usage of hair care products in recent years.

Attributes Market Share
Asia Pacific Market Share (2025) 26.7%

The Asia-Pacific Belt is the second-largest geographical region, followed by the European countries. A lot of credit goes to the social media influencers on the internet as well for this market growth.

Country-wise Insights

The United States is leading the hair bond multiplier market with a revenue share of 36.8%, followed by China and then Japan. These countries will play a crucial role in the market expansion of bond enhancers in and around the world.

Countries Value Share in 2025
United States 36.8%
China 7.8%
Japan 6.9%
Canada 6.3%
United Kingdom 5.2%

The United States Emerges a Leading Market Player for Hair Bond Multiplier

The presence of Hollywood and celebrities who are renowned worldwide and have fan followings in the millions are some of the major reasons why the United States ranks number one with a market share of 36.8% in the hair bond multiplier market. With the majority of residents following the ongoing trend when it comes to fashion, these numbers seem unprecedented.

Olaplex, one of the pioneers of hair bond multiplier technology, is based in California and plays a very important role in the promotion of products associated with bond enhancement. Research and development in the hair care industry is also crucial and has a positive impact on the overall bond multiplier market.

Beauty and Grooming Culture Influences Hair Bond Multipliers Market in China

The United States is followed by China with a revenue share of 7.8% in the hair bond enhancer market, securing the top-most position in the Asia-Pacific region. The growing population and the emphasis on grooming and self-care can drive great demand for products related to hair treatment in the near future.

Social media platforms like WeChat play a very crucial role in promoting beauty products, where fashion bloggers and even dermatologists share valuable insights, addressing the virtual fan following of millions.

Thriving Salon Industry to Elevate the Hair Bond Multiplier Market in Japan

Japan has always had a diverse beauty culture, and with changing times, there has been a general shift toward hair coloring, thanks to more Westernized beauty standards. The country is also blessed with a thriving salon industry, which gives a lot of importance to innovation. Japan contributes a share of 6.9% to the global market.

Japan also has a very rich consumer base that can afford premium brands and expensive hair care products. As more and more people move towards coloring their hair, the demand for hair bond multipliers is bound to increase.

Rising Consumer Awareness about Benefits of Hair Bond Multipliers in Canada

The hair bond multiplier market in Canada has been experiencing steady growth as more people have turned to professional hair coloring and styling services. The demand for products that protect and strengthen hair has increased. Canada accounts for a share of 6.3% of the global market in 2025.

Consumer awareness about the benefits of hair bond multipliers is rising in Canada. Many consumers are willing to pay premium prices for these products, considering the long-term benefits for their hair health.

United Kingdom’s Well-Developed Market for Haircare Products

The United Kingdom has a well-developed market for haircare products, including hair bond multipliers with a share of 5.2% of the global market. Consumers in the United Kingdom are generally well-informed about these products. These products are popular in professional salons for various hair treatments. Additionally, many consumers in the United Kingdom use them at home as part of their regular haircare routines.

The rise of e-commerce in the United Kingdom has facilitated the easy purchase of hair bond multipliers online. Many brands have a strong online presence and sell their products through e-commerce platforms.

Category-wise Insights

Enhancer Kits Dominate the Hair Bond Multiplier Market

A typical hair bond multiplier kit includes all the products that are curated to strengthen the hair bonds that are damaged due to the regular use of chemicals and hair bleaches. With a market share of 63.40%, this is the most preferred choice among the users of hair bond multiplier products.

Top Product Type Kit
Market Share 63.40%

The kit offers a comprehensive solution where users can get all the products required to repair their damaged hair in one package. Many salons have also incorporated these kit treatments into their services, which again boosts the sales of these kits on the market. These kits are also available in the leading supermarket stores, making the process very easy for customers.

Hair Bond Multiplier proves to be beneficial for preventing the Side-effects of Hair Colouring

By application, the hair bond multiplier market is segmented into hair coloring, hair treatment, and other applications. The hair coloring segment dominates the market with a global revenue share of 45.20%.

Top Application Hair Colouring
Market Share 45.20%

There has been a global trend of highlighting hair with different colors in recent years. This process usually involves a significant use of chemical colors and bleaches, which, in the long term, are very detrimental to the health of the user’s hair.

With continuous usage of such colorants, there is a very likely chance that the hydrogen-sulfide bond weakens, leading to thinner and damaged hair. Hair bond multipliers repair this damage and prevent breakage during and after coloring.
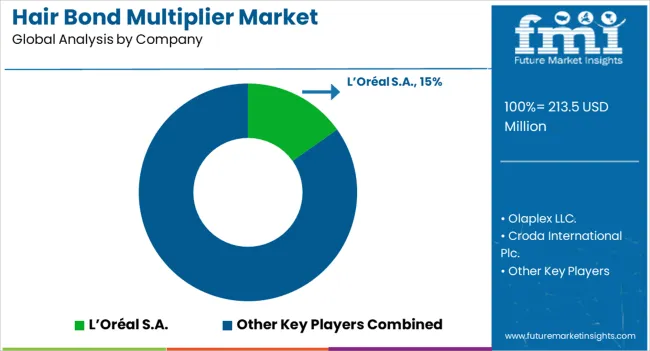
Recent Developments in the Hair Bond Multiplier Market

Hair Bond Multiplier Market Analysis By Company
  • Recently, Olaplex, the leading company that patented the first hair bond multiplier, announced their association with celebrity colorists Tracey Cunningham, Chad Kenyon, Bianca Hillier, Justin Anderson, Guy Tang, Christin Brown, Chrissy Rasmussen, Samantha Cusick, Jimmy Paul, and Laurent Philippon as brand ambassadors of Olaplex on a global scale.
  • With the rise of many companies in the hair bond multiplier market, there has been huge competition, which has resulted in a plunge in revenue for many leading players. Olaplex recently suffered a loss of 22% in the fourth quarter of 2025.

Key Players in the Global Hair Bond Multiplier Market

  • Olaplex LLC
  • Lakme Lever Private Limited
  • Earthly Body, Inc.
  • Croda International Plc
  • Avon Products, Inc.
  • Henkel AG & Co. KGaA
  • L`Oreal S.A.
  • Unilever
  • Kao Corporation (Kao Professional Salon Services Inc.)
  • Brazilian Professionals LLC
  • Affinage Salon Professional Limited
  • The Procter & Gamble Company
  • Keune Haircosmetics Manufacturing B.V.
  • The Estee Lauder Companies, Inc
  • Other Players

Market segmentation

By Product Type:

  • Kit
  • Loose

By Application:

  • Hair Colouring
  • Hair Treatment

By End Use:

  • Salons
  • Spa
  • Personal Use

By Distribution Channel:

  • Direct Sales
  • Retail Sales
  • Modern Trade Distributors and Wholesalers
  • Health & Beauty Stores
  • Online Retailers

By Region:

  • North America
  • Latin America
  • Europe
  • Asia Pacific
  • Middle East and Africa

Table of Content

  1. Executive Summary
    • Global Market Outlook
    • Demand-side Trends
    • Supply-side Trends
    • Technology Roadmap Analysis
    • Analysis and Recommendations
  2. Market Overview
    • Market Coverage / Taxonomy
    • Market Definition / Scope / Limitations
  3. Market Background
    • Market Dynamics
      • Drivers
      • Restraints
      • Opportunity
      • Trends
    • Scenario Forecast
      • Demand in Optimistic Scenario
      • Demand in Likely Scenario
      • Demand in Conservative Scenario
    • Opportunity Map Analysis
    • Product Life Cycle Analysis
    • Supply Chain Analysis
    • Investment Feasibility Matrix
    • Value Chain Analysis
    • PESTLE and Porter’s Analysis
    • Regulatory Landscape
    • Regional Parent Market Outlook
    • Production and Consumption Statistics
    • Import and Export Statistics
  4. Global Market Analysis 2020 to 2024 and Forecast, 2025 to 2035
    • Historical Market Size Value (USD Million) Analysis, 2020 to 2024
    • Current and Future Market Size Value (USD Million) Projections, 2025 to 2035
      • Y-o-Y Growth Trend Analysis
      • Absolute $ Opportunity Analysis
  5. Global Market Pricing Analysis 2020 to 2024 and Forecast 2025 to 2035
  6. Global Market Analysis 2020 to 2024 and Forecast 2025 to 2035, By Product Type
    • Introduction / Key Findings
    • Historical Market Size Value (USD Million) Analysis By Product Type , 2020 to 2024
    • Current and Future Market Size Value (USD Million) Analysis and Forecast By Product Type , 2025 to 2035
      • Kit
      • Loose
    • Y-o-Y Growth Trend Analysis By Product Type , 2020 to 2024
    • Absolute $ Opportunity Analysis By Product Type , 2025 to 2035
  7. Global Market Analysis 2020 to 2024 and Forecast 2025 to 2035, By Application
    • Introduction / Key Findings
    • Historical Market Size Value (USD Million) Analysis By Application, 2020 to 2024
    • Current and Future Market Size Value (USD Million) Analysis and Forecast By Application, 2025 to 2035
      • Hair Colouring
      • Hair Treatment
    • Y-o-Y Growth Trend Analysis By Application, 2020 to 2024
    • Absolute $ Opportunity Analysis By Application, 2025 to 2035
  8. Global Market Analysis 2020 to 2024 and Forecast 2025 to 2035, By End Use
    • Introduction / Key Findings
    • Historical Market Size Value (USD Million) Analysis By End Use, 2020 to 2024
    • Current and Future Market Size Value (USD Million) Analysis and Forecast By End Use, 2025 to 2035
      • Salons
      • Spa
      • Personal Use
    • Y-o-Y Growth Trend Analysis By End Use, 2020 to 2024
    • Absolute $ Opportunity Analysis By End Use, 2025 to 2035
  9. Global Market Analysis 2020 to 2024 and Forecast 2025 to 2035, By Distribution Channel
    • Introduction / Key Findings
    • Historical Market Size Value (USD Million) Analysis By Distribution Channel, 2020 to 2024
    • Current and Future Market Size Value (USD Million) Analysis and Forecast By Distribution Channel, 2025 to 2035
      • Online Retailers
      • Direct Sales
      • Retail Sales
      • Modern Trade Distributors And Wholesalers
      • Health & Beauty Stores
    • Y-o-Y Growth Trend Analysis By Distribution Channel, 2020 to 2024
    • Absolute $ Opportunity Analysis By Distribution Channel, 2025 to 2035
  10. Global Market Analysis 2020 to 2024 and Forecast 2025 to 2035, By Region
    • Introduction
    • Historical Market Size Value (USD Million) Analysis By Region, 2020 to 2024
    • Current Market Size Value (USD Million) Analysis and Forecast By Region, 2025 to 2035
      • North America
      • Latin America
      • Western Europe
      • Eastern Europe
      • East Asia
      • South Asia and Pacific
      • Middle East & Africa
    • Market Attractiveness Analysis By Region
  11. North America Market Analysis 2020 to 2024 and Forecast 2025 to 2035, By Country
    • Historical Market Size Value (USD Million) Trend Analysis By Market Taxonomy, 2020 to 2024
    • Market Size Value (USD Million) Forecast By Market Taxonomy, 2025 to 2035
      • By Country
        • USA
        • Canada
        • Mexico
      • By Product Type
      • By Application
      • By End Use
      • By Distribution Channel
    • Market Attractiveness Analysis
      • By Country
      • By Product Type
      • By Application
      • By End Use
      • By Distribution Channel
    • Key Takeaways
  12. Latin America Market Analysis 2020 to 2024 and Forecast 2025 to 2035, By Country
    • Historical Market Size Value (USD Million) Trend Analysis By Market Taxonomy, 2020 to 2024
    • Market Size Value (USD Million) Forecast By Market Taxonomy, 2025 to 2035
      • By Country
        • Brazil
        • Chile
        • Rest of Latin America
      • By Product Type
      • By Application
      • By End Use
      • By Distribution Channel
    • Market Attractiveness Analysis
      • By Country
      • By Product Type
      • By Application
      • By End Use
      • By Distribution Channel
    • Key Takeaways
  13. Western Europe Market Analysis 2020 to 2024 and Forecast 2025 to 2035, By Country
    • Historical Market Size Value (USD Million) Trend Analysis By Market Taxonomy, 2020 to 2024
    • Market Size Value (USD Million) Forecast By Market Taxonomy, 2025 to 2035
      • By Country
        • Germany
        • UK
        • Italy
        • Spain
        • France
        • Nordic
        • BENELUX
        • Rest of Western Europe
      • By Product Type
      • By Application
      • By End Use
      • By Distribution Channel
    • Market Attractiveness Analysis
      • By Country
      • By Product Type
      • By Application
      • By End Use
      • By Distribution Channel
    • Key Takeaways
  14. Eastern Europe Market Analysis 2020 to 2024 and Forecast 2025 to 2035, By Country
    • Historical Market Size Value (USD Million) Trend Analysis By Market Taxonomy, 2020 to 2024
    • Market Size Value (USD Million) Forecast By Market Taxonomy, 2025 to 2035
      • By Country
        • Russia
        • Poland
        • Hungary
        • Balkan & Baltic
        • Rest of Eastern Europe
      • By Product Type
      • By Application
      • By End Use
      • By Distribution Channel
    • Market Attractiveness Analysis
      • By Country
      • By Product Type
      • By Application
      • By End Use
      • By Distribution Channel
    • Key Takeaways
  15. East Asia Market Analysis 2020 to 2024 and Forecast 2025 to 2035, By Country
    • Historical Market Size Value (USD Million) Trend Analysis By Market Taxonomy, 2020 to 2024
    • Market Size Value (USD Million) Forecast By Market Taxonomy, 2025 to 2035
      • By Country
        • China
        • Japan
        • South Korea
      • By Product Type
      • By Application
      • By End Use
      • By Distribution Channel
    • Market Attractiveness Analysis
      • By Country
      • By Product Type
      • By Application
      • By End Use
      • By Distribution Channel
    • Key Takeaways
  16. South Asia and Pacific Market Analysis 2020 to 2024 and Forecast 2025 to 2035, By Country
    • Historical Market Size Value (USD Million) Trend Analysis By Market Taxonomy, 2020 to 2024
    • Market Size Value (USD Million) Forecast By Market Taxonomy, 2025 to 2035
      • By Country
        • India
        • ASEAN
        • Australia & New Zealand
        • Rest of South Asia and Pacific
      • By Product Type
      • By Application
      • By End Use
      • By Distribution Channel
    • Market Attractiveness Analysis
      • By Country
      • By Product Type
      • By Application
      • By End Use
      • By Distribution Channel
    • Key Takeaways
  17. Middle East & Africa Market Analysis 2020 to 2024 and Forecast 2025 to 2035, By Country
    • Historical Market Size Value (USD Million) Trend Analysis By Market Taxonomy, 2020 to 2024
    • Market Size Value (USD Million) Forecast By Market Taxonomy, 2025 to 2035
      • By Country
        • Kingdom of Saudi Arabia
        • Other GCC Countries
        • Turkiye
        • South Africa
        • Other African Union
        • Rest of Middle East & Africa
      • By Product Type
      • By Application
      • By End Use
      • By Distribution Channel
    • Market Attractiveness Analysis
      • By Country
      • By Product Type
      • By Application
      • By End Use
      • By Distribution Channel
    • Key Takeaways
  18. Key Countries Market Analysis
    • USA
      • Pricing Analysis
      • Market Share Analysis, 2024
        • By Product Type
        • By Application
        • By End Use
        • By Distribution Channel
    • Canada
      • Pricing Analysis
      • Market Share Analysis, 2024
        • By Product Type
        • By Application
        • By End Use
        • By Distribution Channel
    • Mexico
      • Pricing Analysis
      • Market Share Analysis, 2024
        • By Product Type
        • By Application
        • By End Use
        • By Distribution Channel
    • Brazil
      • Pricing Analysis
      • Market Share Analysis, 2024
        • By Product Type
        • By Application
        • By End Use
        • By Distribution Channel
    • Chile
      • Pricing Analysis
      • Market Share Analysis, 2024
        • By Product Type
        • By Application
        • By End Use
        • By Distribution Channel
    • Germany
      • Pricing Analysis
      • Market Share Analysis, 2024
        • By Product Type
        • By Application
        • By End Use
        • By Distribution Channel
    • UK
      • Pricing Analysis
      • Market Share Analysis, 2024
        • By Product Type
        • By Application
        • By End Use
        • By Distribution Channel
    • Italy
      • Pricing Analysis
      • Market Share Analysis, 2024
        • By Product Type
        • By Application
        • By End Use
        • By Distribution Channel
    • Spain
      • Pricing Analysis
      • Market Share Analysis, 2024
        • By Product Type
        • By Application
        • By End Use
        • By Distribution Channel
    • France
      • Pricing Analysis
      • Market Share Analysis, 2024
        • By Product Type
        • By Application
        • By End Use
        • By Distribution Channel
    • India
      • Pricing Analysis
      • Market Share Analysis, 2024
        • By Product Type
        • By Application
        • By End Use
        • By Distribution Channel
    • ASEAN
      • Pricing Analysis
      • Market Share Analysis, 2024
        • By Product Type
        • By Application
        • By End Use
        • By Distribution Channel
    • Australia & New Zealand
      • Pricing Analysis
      • Market Share Analysis, 2024
        • By Product Type
        • By Application
        • By End Use
        • By Distribution Channel
    • China
      • Pricing Analysis
      • Market Share Analysis, 2024
        • By Product Type
        • By Application
        • By End Use
        • By Distribution Channel
    • Japan
      • Pricing Analysis
      • Market Share Analysis, 2024
        • By Product Type
        • By Application
        • By End Use
        • By Distribution Channel
    • South Korea
      • Pricing Analysis
      • Market Share Analysis, 2024
        • By Product Type
        • By Application
        • By End Use
        • By Distribution Channel
    • Russia
      • Pricing Analysis
      • Market Share Analysis, 2024
        • By Product Type
        • By Application
        • By End Use
        • By Distribution Channel
    • Poland
      • Pricing Analysis
      • Market Share Analysis, 2024
        • By Product Type
        • By Application
        • By End Use
        • By Distribution Channel
    • Hungary
      • Pricing Analysis
      • Market Share Analysis, 2024
        • By Product Type
        • By Application
        • By End Use
        • By Distribution Channel
    • Kingdom of Saudi Arabia
      • Pricing Analysis
      • Market Share Analysis, 2024
        • By Product Type
        • By Application
        • By End Use
        • By Distribution Channel
    • Turkiye
      • Pricing Analysis
      • Market Share Analysis, 2024
        • By Product Type
        • By Application
        • By End Use
        • By Distribution Channel
    • South Africa
      • Pricing Analysis
      • Market Share Analysis, 2024
        • By Product Type
        • By Application
        • By End Use
        • By Distribution Channel
  19. Market Structure Analysis
    • Competition Dashboard
    • Competition Benchmarking
    • Market Share Analysis of Top Players
      • By Regional
      • By Product Type
      • By Application
      • By End Use
      • By Distribution Channel
  20. Competition Analysis
    • Competition Deep Dive
      • L’Oréal S.A.
        • Overview
        • Product Portfolio
        • Profitability by Market Segments (Product/Age /Sales Channel/Region)
        • Sales Footprint
        • Strategy Overview
          • Marketing Strategy
          • Product Strategy
          • Channel Strategy
      • Olaplex LLC.
      • Croda International Plc.
      • Henkel AG & Co. KGaA
      • Keune Haircosmetics Manufacturing B.V.
      • Lakmé Lever Private Limited
      • Earthly Body, Inc.
      • Brazilian Professionals LLC.
      • Affinage Salon Professional Limited.
      • Unilever
  21. Assumptions & Acronyms Used
  22. Research Methodology

List of Tables

  • Table 1: Global Market Value (USD Million) Forecast by Region, 2020 to 2035
  • Table 2: Global Market Value (USD Million) Forecast by Product Type , 2020 to 2035
  • Table 3: Global Market Value (USD Million) Forecast by Application, 2020 to 2035
  • Table 4: Global Market Value (USD Million) Forecast by End Use, 2020 to 2035
  • Table 5: Global Market Value (USD Million) Forecast by Distribution Channel, 2020 to 2035
  • Table 6: North America Market Value (USD Million) Forecast by Country, 2020 to 2035
  • Table 7: North America Market Value (USD Million) Forecast by Product Type , 2020 to 2035
  • Table 8: North America Market Value (USD Million) Forecast by Application, 2020 to 2035
  • Table 9: North America Market Value (USD Million) Forecast by End Use, 2020 to 2035
  • Table 10: North America Market Value (USD Million) Forecast by Distribution Channel, 2020 to 2035
  • Table 11: Latin America Market Value (USD Million) Forecast by Country, 2020 to 2035
  • Table 12: Latin America Market Value (USD Million) Forecast by Product Type , 2020 to 2035
  • Table 13: Latin America Market Value (USD Million) Forecast by Application, 2020 to 2035
  • Table 14: Latin America Market Value (USD Million) Forecast by End Use, 2020 to 2035
  • Table 15: Latin America Market Value (USD Million) Forecast by Distribution Channel, 2020 to 2035
  • Table 16: Western Europe Market Value (USD Million) Forecast by Country, 2020 to 2035
  • Table 17: Western Europe Market Value (USD Million) Forecast by Product Type , 2020 to 2035
  • Table 18: Western Europe Market Value (USD Million) Forecast by Application, 2020 to 2035
  • Table 19: Western Europe Market Value (USD Million) Forecast by End Use, 2020 to 2035
  • Table 20: Western Europe Market Value (USD Million) Forecast by Distribution Channel, 2020 to 2035
  • Table 21: Eastern Europe Market Value (USD Million) Forecast by Country, 2020 to 2035
  • Table 22: Eastern Europe Market Value (USD Million) Forecast by Product Type , 2020 to 2035
  • Table 23: Eastern Europe Market Value (USD Million) Forecast by Application, 2020 to 2035
  • Table 24: Eastern Europe Market Value (USD Million) Forecast by End Use, 2020 to 2035
  • Table 25: Eastern Europe Market Value (USD Million) Forecast by Distribution Channel, 2020 to 2035
  • Table 26: East Asia Market Value (USD Million) Forecast by Country, 2020 to 2035
  • Table 27: East Asia Market Value (USD Million) Forecast by Product Type , 2020 to 2035
  • Table 28: East Asia Market Value (USD Million) Forecast by Application, 2020 to 2035
  • Table 29: East Asia Market Value (USD Million) Forecast by End Use, 2020 to 2035
  • Table 30: East Asia Market Value (USD Million) Forecast by Distribution Channel, 2020 to 2035
  • Table 31: South Asia and Pacific Market Value (USD Million) Forecast by Country, 2020 to 2035
  • Table 32: South Asia and Pacific Market Value (USD Million) Forecast by Product Type , 2020 to 2035
  • Table 33: South Asia and Pacific Market Value (USD Million) Forecast by Application, 2020 to 2035
  • Table 34: South Asia and Pacific Market Value (USD Million) Forecast by End Use, 2020 to 2035
  • Table 35: South Asia and Pacific Market Value (USD Million) Forecast by Distribution Channel, 2020 to 2035
  • Table 36: Middle East & Africa Market Value (USD Million) Forecast by Country, 2020 to 2035
  • Table 37: Middle East & Africa Market Value (USD Million) Forecast by Product Type , 2020 to 2035
  • Table 38: Middle East & Africa Market Value (USD Million) Forecast by Application, 2020 to 2035
  • Table 39: Middle East & Africa Market Value (USD Million) Forecast by End Use, 2020 to 2035
  • Table 40: Middle East & Africa Market Value (USD Million) Forecast by Distribution Channel, 2020 to 2035

List of Figures

  • Figure 1: Global Market Pricing Analysis
  • Figure 2: Global Market Value (USD Million) Forecast 2020-2035
  • Figure 3: Global Market Value Share and BPS Analysis by Product Type , 2025 and 2035
  • Figure 4: Global Market Y-o-Y Growth Comparison by Product Type , 2025-2035
  • Figure 5: Global Market Attractiveness Analysis by Product Type
  • Figure 6: Global Market Value Share and BPS Analysis by Application, 2025 and 2035
  • Figure 7: Global Market Y-o-Y Growth Comparison by Application, 2025-2035
  • Figure 8: Global Market Attractiveness Analysis by Application
  • Figure 9: Global Market Value Share and BPS Analysis by End Use, 2025 and 2035
  • Figure 10: Global Market Y-o-Y Growth Comparison by End Use, 2025-2035
  • Figure 11: Global Market Attractiveness Analysis by End Use
  • Figure 12: Global Market Value Share and BPS Analysis by Distribution Channel, 2025 and 2035
  • Figure 13: Global Market Y-o-Y Growth Comparison by Distribution Channel, 2025-2035
  • Figure 14: Global Market Attractiveness Analysis by Distribution Channel
  • Figure 15: Global Market Value (USD Million) Share and BPS Analysis by Region, 2025 and 2035
  • Figure 16: Global Market Y-o-Y Growth Comparison by Region, 2025-2035
  • Figure 17: Global Market Attractiveness Analysis by Region
  • Figure 18: North America Market Incremental Dollar Opportunity, 2025-2035
  • Figure 19: Latin America Market Incremental Dollar Opportunity, 2025-2035
  • Figure 20: Western Europe Market Incremental Dollar Opportunity, 2025-2035
  • Figure 21: Eastern Europe Market Incremental Dollar Opportunity, 2025-2035
  • Figure 22: East Asia Market Incremental Dollar Opportunity, 2025-2035
  • Figure 23: South Asia and Pacific Market Incremental Dollar Opportunity, 2025-2035
  • Figure 24: Middle East & Africa Market Incremental Dollar Opportunity, 2025-2035
  • Figure 25: North America Market Value Share and BPS Analysis by Country, 2025 and 2035
  • Figure 26: North America Market Value Share and BPS Analysis by Product Type , 2025 and 2035
  • Figure 27: North America Market Y-o-Y Growth Comparison by Product Type , 2025-2035
  • Figure 28: North America Market Attractiveness Analysis by Product Type
  • Figure 29: North America Market Value Share and BPS Analysis by Application, 2025 and 2035
  • Figure 30: North America Market Y-o-Y Growth Comparison by Application, 2025-2035
  • Figure 31: North America Market Attractiveness Analysis by Application
  • Figure 32: North America Market Value Share and BPS Analysis by End Use, 2025 and 2035
  • Figure 33: North America Market Y-o-Y Growth Comparison by End Use, 2025-2035
  • Figure 34: North America Market Attractiveness Analysis by End Use
  • Figure 35: North America Market Value Share and BPS Analysis by Distribution Channel, 2025 and 2035
  • Figure 36: North America Market Y-o-Y Growth Comparison by Distribution Channel, 2025-2035
  • Figure 37: North America Market Attractiveness Analysis by Distribution Channel
  • Figure 38: Latin America Market Value Share and BPS Analysis by Country, 2025 and 2035
  • Figure 39: Latin America Market Value Share and BPS Analysis by Product Type , 2025 and 2035
  • Figure 40: Latin America Market Y-o-Y Growth Comparison by Product Type , 2025-2035
  • Figure 41: Latin America Market Attractiveness Analysis by Product Type
  • Figure 42: Latin America Market Value Share and BPS Analysis by Application, 2025 and 2035
  • Figure 43: Latin America Market Y-o-Y Growth Comparison by Application, 2025-2035
  • Figure 44: Latin America Market Attractiveness Analysis by Application
  • Figure 45: Latin America Market Value Share and BPS Analysis by End Use, 2025 and 2035
  • Figure 46: Latin America Market Y-o-Y Growth Comparison by End Use, 2025-2035
  • Figure 47: Latin America Market Attractiveness Analysis by End Use
  • Figure 48: Latin America Market Value Share and BPS Analysis by Distribution Channel, 2025 and 2035
  • Figure 49: Latin America Market Y-o-Y Growth Comparison by Distribution Channel, 2025-2035
  • Figure 50: Latin America Market Attractiveness Analysis by Distribution Channel
  • Figure 51: Western Europe Market Value Share and BPS Analysis by Country, 2025 and 2035
  • Figure 52: Western Europe Market Value Share and BPS Analysis by Product Type , 2025 and 2035
  • Figure 53: Western Europe Market Y-o-Y Growth Comparison by Product Type , 2025-2035
  • Figure 54: Western Europe Market Attractiveness Analysis by Product Type
  • Figure 55: Western Europe Market Value Share and BPS Analysis by Application, 2025 and 2035
  • Figure 56: Western Europe Market Y-o-Y Growth Comparison by Application, 2025-2035
  • Figure 57: Western Europe Market Attractiveness Analysis by Application
  • Figure 58: Western Europe Market Value Share and BPS Analysis by End Use, 2025 and 2035
  • Figure 59: Western Europe Market Y-o-Y Growth Comparison by End Use, 2025-2035
  • Figure 60: Western Europe Market Attractiveness Analysis by End Use
  • Figure 61: Western Europe Market Value Share and BPS Analysis by Distribution Channel, 2025 and 2035
  • Figure 62: Western Europe Market Y-o-Y Growth Comparison by Distribution Channel, 2025-2035
  • Figure 63: Western Europe Market Attractiveness Analysis by Distribution Channel
  • Figure 64: Eastern Europe Market Value Share and BPS Analysis by Country, 2025 and 2035
  • Figure 65: Eastern Europe Market Value Share and BPS Analysis by Product Type , 2025 and 2035
  • Figure 66: Eastern Europe Market Y-o-Y Growth Comparison by Product Type , 2025-2035
  • Figure 67: Eastern Europe Market Attractiveness Analysis by Product Type
  • Figure 68: Eastern Europe Market Value Share and BPS Analysis by Application, 2025 and 2035
  • Figure 69: Eastern Europe Market Y-o-Y Growth Comparison by Application, 2025-2035
  • Figure 70: Eastern Europe Market Attractiveness Analysis by Application
  • Figure 71: Eastern Europe Market Value Share and BPS Analysis by End Use, 2025 and 2035
  • Figure 72: Eastern Europe Market Y-o-Y Growth Comparison by End Use, 2025-2035
  • Figure 73: Eastern Europe Market Attractiveness Analysis by End Use
  • Figure 74: Eastern Europe Market Value Share and BPS Analysis by Distribution Channel, 2025 and 2035
  • Figure 75: Eastern Europe Market Y-o-Y Growth Comparison by Distribution Channel, 2025-2035
  • Figure 76: Eastern Europe Market Attractiveness Analysis by Distribution Channel
  • Figure 77: East Asia Market Value Share and BPS Analysis by Country, 2025 and 2035
  • Figure 78: East Asia Market Value Share and BPS Analysis by Product Type , 2025 and 2035
  • Figure 79: East Asia Market Y-o-Y Growth Comparison by Product Type , 2025-2035
  • Figure 80: East Asia Market Attractiveness Analysis by Product Type
  • Figure 81: East Asia Market Value Share and BPS Analysis by Application, 2025 and 2035
  • Figure 82: East Asia Market Y-o-Y Growth Comparison by Application, 2025-2035
  • Figure 83: East Asia Market Attractiveness Analysis by Application
  • Figure 84: East Asia Market Value Share and BPS Analysis by End Use, 2025 and 2035
  • Figure 85: East Asia Market Y-o-Y Growth Comparison by End Use, 2025-2035
  • Figure 86: East Asia Market Attractiveness Analysis by End Use
  • Figure 87: East Asia Market Value Share and BPS Analysis by Distribution Channel, 2025 and 2035
  • Figure 88: East Asia Market Y-o-Y Growth Comparison by Distribution Channel, 2025-2035
  • Figure 89: East Asia Market Attractiveness Analysis by Distribution Channel
  • Figure 90: South Asia and Pacific Market Value Share and BPS Analysis by Country, 2025 and 2035
  • Figure 91: South Asia and Pacific Market Value Share and BPS Analysis by Product Type , 2025 and 2035
  • Figure 92: South Asia and Pacific Market Y-o-Y Growth Comparison by Product Type , 2025-2035
  • Figure 93: South Asia and Pacific Market Attractiveness Analysis by Product Type
  • Figure 94: South Asia and Pacific Market Value Share and BPS Analysis by Application, 2025 and 2035
  • Figure 95: South Asia and Pacific Market Y-o-Y Growth Comparison by Application, 2025-2035
  • Figure 96: South Asia and Pacific Market Attractiveness Analysis by Application
  • Figure 97: South Asia and Pacific Market Value Share and BPS Analysis by End Use, 2025 and 2035
  • Figure 98: South Asia and Pacific Market Y-o-Y Growth Comparison by End Use, 2025-2035
  • Figure 99: South Asia and Pacific Market Attractiveness Analysis by End Use
  • Figure 100: South Asia and Pacific Market Value Share and BPS Analysis by Distribution Channel, 2025 and 2035
  • Figure 101: South Asia and Pacific Market Y-o-Y Growth Comparison by Distribution Channel, 2025-2035
  • Figure 102: South Asia and Pacific Market Attractiveness Analysis by Distribution Channel
  • Figure 103: Middle East & Africa Market Value Share and BPS Analysis by Country, 2025 and 2035
  • Figure 104: Middle East & Africa Market Value Share and BPS Analysis by Product Type , 2025 and 2035
  • Figure 105: Middle East & Africa Market Y-o-Y Growth Comparison by Product Type , 2025-2035
  • Figure 106: Middle East & Africa Market Attractiveness Analysis by Product Type
  • Figure 107: Middle East & Africa Market Value Share and BPS Analysis by Application, 2025 and 2035
  • Figure 108: Middle East & Africa Market Y-o-Y Growth Comparison by Application, 2025-2035
  • Figure 109: Middle East & Africa Market Attractiveness Analysis by Application
  • Figure 110: Middle East & Africa Market Value Share and BPS Analysis by End Use, 2025 and 2035
  • Figure 111: Middle East & Africa Market Y-o-Y Growth Comparison by End Use, 2025-2035
  • Figure 112: Middle East & Africa Market Attractiveness Analysis by End Use
  • Figure 113: Middle East & Africa Market Value Share and BPS Analysis by Distribution Channel, 2025 and 2035
  • Figure 114: Middle East & Africa Market Y-o-Y Growth Comparison by Distribution Channel, 2025-2035
  • Figure 115: Middle East & Africa Market Attractiveness Analysis by Distribution Channel
  • Figure 116: Global Market - Tier Structure Analysis
  • Figure 117: Global Market - Company Share Analysis

Frequently Asked Questions

How big is the hair bond multiplier market in 2025?

The global hair bond multiplier market is estimated to be valued at USD 213.5 million in 2025.

What will be the size of hair bond multiplier market in 2035?

The market size for the hair bond multiplier market is projected to reach USD 358.6 million by 2035.

How much will be the hair bond multiplier market growth between 2025 and 2035?

The hair bond multiplier market is expected to grow at a 5.3% CAGR between 2025 and 2035.

What are the key product types in the hair bond multiplier market?

The key product types in hair bond multiplier market are kit and loose.

Which application segment to contribute significant share in the hair bond multiplier market in 2025?

In terms of application, hair colouring segment to command 59.3% share in the hair bond multiplier market in 2025.

Explore Similar Insights

Future Market Insights

Hair Bond Multiplier Market

Chat With MaRIA

Chat With

MaRIA

Hi There, I am MaRIA, Your Market Research Intelligence Assistant. How may I help you?