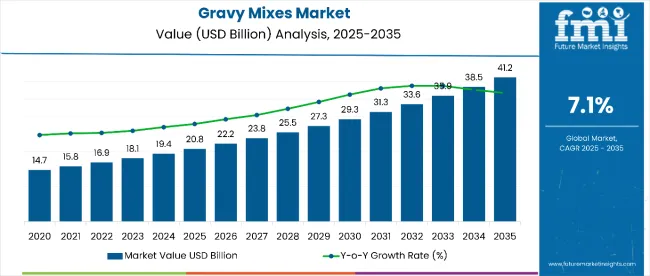
The global gravy mixes market is valued at USD 20.8 billion in 2025 and is expected to reach USD 41.2 billion by 2035, reflecting a CAGR of 7.1%. This indicates the market will nearly double in value over the forecast period, adding USD 20.4 billion in absolute opportunity.
| Metric | Value |
|---|---|
| Market Value (2025) | USD 20.8 billion |
| Market Value (2035) | USD 41.2 billion |
| CAGR (2025 to 2035) | 7.1% |
By 2030, the market is expected to reach USD 29.31 billion, with growth moderately weighted toward the second half of the period. Rising demand for convenient, flavorful cooking solutions across both developed and emerging economies is expected to remain the primary driver of this steady market expansion.
The market is segmented by product type into vegan and non-vegan gravy mixes. Non-vegan options including beef, poultry, and pork lead the segment, while vegan alternatives like brown mushroom and vegetable-based blends are growing due to dietary shifts. On the consumption side, households account for the majority of demand, with an estimated base of 755 million households globally. Distribution is dominated by modern grocery retail, with hypermarkets and supermarkets contributing 70% of modern trade sales. As consumer shopping behavior continues to shift toward organized retail, shelf visibility, promotional access, and convenience are becoming critical for sustaining brand loyalty and growth.
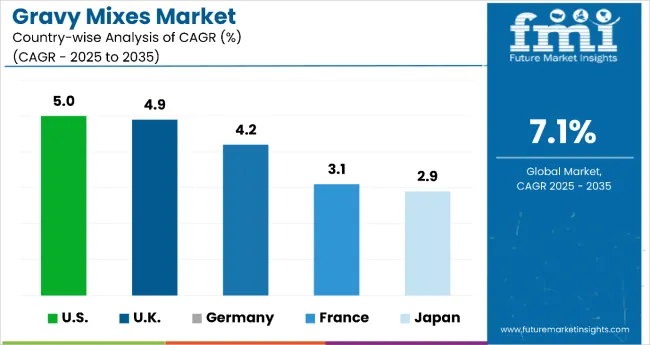
McCormick & Company, Inc. leads the global gravy mixes market with a 32% share, driven by strong brand recognition, innovation, and wide distribution. Other major players include Knorr, Southeastern Mills, and Campbell, each focusing on expanding their product portfolios and clean-label offerings. Regionally, the U.S. is the fastest-growing gravy mixes market with a CAGR of 5.0%, followed by the U.K. (4.9%), Germany (4.2%), France (3.1%), and Japan (2.9%). While growth in mature markets is stable, emerging regions present significant opportunities due to expanding middle-class populations, modern retail penetration, and rising interest in Western-style convenience foods.
The market contributes approximately 26% of the instant meal solutions segment, driven by growing demand for convenience and time-saving meal preparations. It accounts for around 18% of the savory food enhancers market, supported by its use as a core flavoring base in home and foodservice cooking. The market holds nearly 15% of the ready-to-cook sauces and mixes category, offering a cost-effective and shelf-stable alternative to fresh ingredients. Gravy mixes represent close to 12% of the packaged culinary aids market, especially in regions where Western-style meals are increasingly integrated into everyday diets. Its share in the meat accompaniments category reaches about 20%, reinforcing its role in traditional comfort food pairings and protein-rich meals.
The market is undergoing structural transformation driven by changing eating habits, globalization of cuisine, and the need for culinary convenience. Product innovation, including clean-label formulations, plant-based variants, and ethnic flavor profiles, is expanding the category’s relevance across diverse consumer groups. Advances in powder formulation, longer shelf life, and instant rehydration have increased usability across both households and foodservice channels. Manufacturers are investing in premium packaging, portion control formats, and ready-to-use pouches to match modern cooking lifestyles.
Rising demand for convenient, time-saving meal solutions has made gravy mixes a staple in modern kitchens, especially among urban consumers and working households. Gravy mixes offer a quick and consistent way to enhance the flavor of home-cooked meals, making them a preferred alternative to scratch cooking. As cooking habits shift due to fast-paced lifestyles, the appeal of ready-to-use and easy-to-prepare sauces continues to drive sustained market growth.
The market also benefits from expanding culinary applications in both retail and foodservice sectors. Gravy mixes are increasingly used in ready meals, frozen foods, meal kits, and processed meat products. Product innovations such as plant-based formulations, low-sodium options, and ethnic flavor variants have broadened their consumer appeal. Enhanced shelf life, portion-controlled packaging, and instant reconstitution features add to their utility across diverse use cases.
As global cuisine becomes more mainstream and consumers seek richer, more flavorful meals with minimal preparation, gravy mixes are well-positioned to meet evolving dietary and lifestyle needs. The category is further supported by innovations in clean-label formulations and growing demand from emerging markets where Western-style dishes are gaining traction. With a strong foothold in both household and foodservice channels, the market outlook remains favorable across regions.
The market is segmented by origin, product type, packaging type, distribution channel, end use industry, and region. By origin, the market is bifurcated into organic and conventional. Based on product type, the market is divided into vegan (brown mushroom, other vegan types such as herb-based, onion-based, and vegetable blends) and non-vegan (beef, poultry, pork, other non-vegan types such as lamb, seafood, and mixed meat gravies). In terms of packaging type, the market is categorized into rigid packaging, food cans, jars, flexible packaging, pouches, and sachets. By distribution channel, the market is divided into modern grocery retail, hypermarkets/supermarkets, departmental stores, convenience stores, traditional grocery retail, specialty stores, independent grocery stores, and e-retail. Based on end use industry, the market is bifurcated into household and commercial establishments. Regionally, the market is classified into North America, Latin America, Western Europe, Eastern Europe, South Asia and Pacific, East Asia, and the Middle East & Africa.
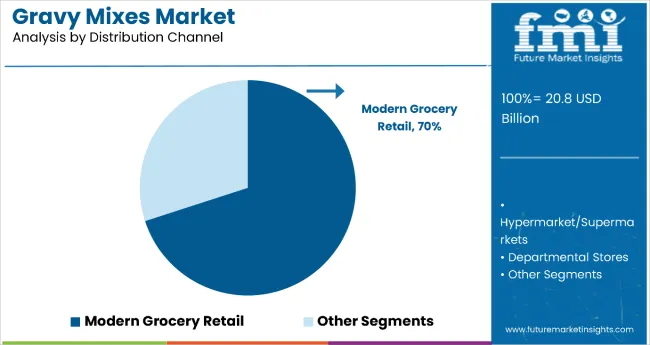
The modern grocery retail segment commands a leading 70% share within the distribution channel category, driven by its expansive reach, product variety, and promotional visibility. Supermarkets, hypermarkets, and large-format retail chains provides consumers with easy access to multiple gravy mix brands and formats under one roof. These outlets also facilitate impulse purchases through strategic product placement and seasonal promotions, enhancing category turnover.
Private-label offerings in modern retail formats have strengthened affordability while maintaining quality standards, attracting price-conscious buyers. Promotional campaigns, in-store sampling, and loyalty programs further cement consumer loyalty toward the segment. With modern retail expanding in both mature and emerging economies, its influence on gravy mix sales is expected to deepen, supported by wider shelf space allocation and cross-category merchandising initiatives.
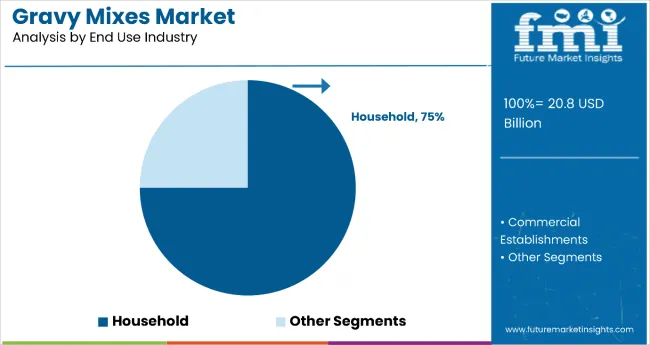
The household end-user segment holds a dominant 75% share in global consumption, reflecting its central role in everyday cooking. Gravy mixes cater to time-pressed consumers seeking quick, flavorful meal preparation that replicates traditional home-cooked taste with minimal effort. Their ability to complement diverse cuisines makes them a pantry staple in regions such as North America and Western Europe.
Demand is amplified by the growth of dual-income families and the ongoing shift toward meal simplification. The launch of clean-label, vegan, and ethnically inspired variants has broadened adoption across cultural and dietary preferences. As more households embrace convenient yet flavorful cooking solutions, gravy mixes are set to retain their stronghold in home kitchens worldwide, supported by continued innovation in flavor profiles and packaging formats.
From 2023 to 2025, consumer demand for convenient, time-saving cooking solutions has been a significant driver of the gravy mixes market. By 2025, household penetration reached new highs, supported by the availability of diverse flavor profiles and consistent product quality. Gravy mixes are increasingly regarded not just as a convenience item but as an essential pantry staple, particularly in North America and Europe.
Clean-Label and Vegan Trends Expand Consumer Base
Between 2023 and 2025, clean-label and plant-based formulations emerged as key trends in the gravy mixes market. As dietary awareness and food sensitivities increased, vegan and allergen-free variants such as brown mushroom-based gravies gained traction among health-conscious and ethical consumers. By 2025, consumer expectations shifted toward transparency in labeling and recognizable ingredients, prompting brands to reformulate products without artificial preservatives or flavor enhancers.
Supply Chain Costs and Ingredient Volatility Pose Challenges
While the market continues to expand steadily, cost volatility in key ingredients such as spices, dairy components, and plant-based thickeners poses challenges to manufacturers. Between 2025 and 2035, global supply chain disruptions and inflationary pressures increased input costs, tightening margins, particularly in lower-priced conventional segments. Rising regulatory scrutiny of sodium content and food labeling has also required reformulations and delayed certain product launches.
| Countries | CAGR |
|---|---|
| USA | 5.0% |
| UK | 4.9% |
| Germany | 4.2% |
| Fra nce | 3.1% |
| Japan | 2.9% |
Among the top five countries in the gravy mixes market, the USA leads with the highest CAGR of 5.0% from 2025 to 2035, supported by widespread household consumption, demand for clean-label products, and product innovation from brands like McCormick. The UK follows closely with a 4.9% CAGR, reinforced by cultural attachment to roast dinners and the growing popularity of vegan and allergen-free variants. Germany posts a 4.2% CAGR, where health-focused, plant-based, and additive-free options are accelerating demand. France records a slower 3.1% CAGR, driven by time-pressed consumers and gourmet-style gravies. Japan, with the lowest CAGR at 2.9%, shows niche potential through fusion gravies tailored to local tastes and solo consumer trends.
The report covers an in-depth analysis of over 40 countries; five top-performing OECD markets are highlighted below.
The USA gravy mixes market is growing at a CAGR of 5.0% from 2025 to 2035, supported by demand for comfort foods and convenient meal enhancements. Consumers seek products that deliver flavor without compromising health. McCormick & Company Inc., with a 32% market share, leads innovation in clean-label, organic, and reduced-sodium options. Modern grocery retail dominates with a 70% distribution share, and e-retail continues to expand. Vegan varieties, such as mushroom-based gravies, are also gaining ground among health-aware buyers. Household consumption, accounting for 75% of demand, will keep the USA at the forefront of production and innovation.
The UK gravy mixes market, growing at a CAGR of 4.9%, thrives on cultural traditions surrounding roast dinners, supporting consistent demand. The market is diversifying rapidly, with vegan and allergen-free variants gaining momentum. Supermarkets are expanding organic and premium offerings to meet changing dietary needs. Brown mushroom and poultry gravies dominate preferences. Household consumption remains the category leader, driven by familiarity and frequent use. While e-retail is growing, physical retail remains central. Knorr and Schwartz continue to scale output to meet evolving consumer demand.
Demand for gravy mixes in Germany is expanding at a CAGR of 4.2%, driven by interest in plant-based, additive-free, and organic alternatives. Health-conscious consumers prefer traditional flavors with cleaner labels. Brown mushroom gravies and low-sodium beef options are occupying more shelf space. Packaging is shifting from rigid jars to flexible sachets for single-use convenience. Germany’s strong processed food industry and a growing vegan population support steady growth for both organic and conventional products. Regional brands and global players like Knorr continue to localize offerings for health and taste preferences.
Revenue from gravy mixes in France is expanding at a CAGR of 3.1%, driven by consumers seeking flavorful yet easy-to-prepare alternatives. While traditional sauces remain popular, gourmet-style and organic mixes are gaining share in premium retail. Poultry and pork gravies are widely preferred, with clean-label products seeing increased interest. Packaging in jars and sachets reinforces premium positioning.
Sales in the Japan gravy mixes market are projected to grow at a CAGR of 2.9% as Western food influences expand. Gravy products are adapted to Japanese tastes, incorporating umami-rich, miso, and soy-based blends. Small pack sizes meet the needs of solo households and urban lifestyles. Distribution is led by convenience stores and supermarkets, with demand for imported and fusion gravies rising. Vegan, clean-label products are expected to drive future growth.
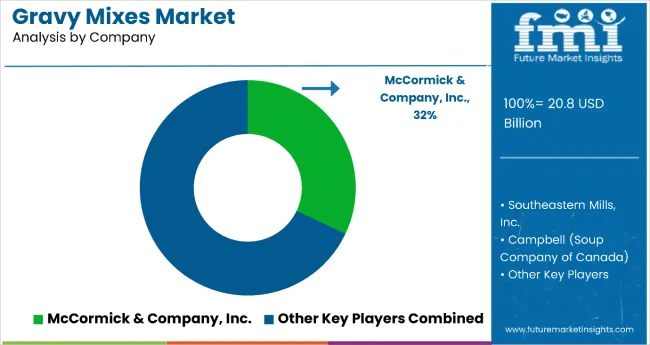
The market is moderately consolidated, with McCormick & Company Inc. leading the competitive space through a strong market share of 32%, backed by robust product innovation, extensive distribution networks, and brand loyalty across global markets. The company benefits from a wide portfolio of gravy offerings including vegan, organic, reduced-sodium, and gourmet variants tailored to regional taste preferences.
Key players include Knorr (Unilever), Campbell Soup Company, Bisto (Premier Foods), Nestlé S.A., Hain Celestial Group, Ajinomoto Co., Inc., General Mills, Hormel Foods Corporation, Southeastern Mills, Marigold Health Foods Ltd, Woeber Mustard Manufacturing Co., and Annie’s Homegrown. These companies deliver both powdered and liquid gravy formats across rigid and flexible packaging, often targeting premium and convenience-driven consumer segments.
Market growth is supported by increasing household consumption (75% share), rising demand for clean-label and allergen-free products, and premium positioning strategies in modern grocery retail channels, which currently account for 70% of total gravy mix distribution globally.
| Item | Value |
|---|---|
| Quantitative Units | USD 20.8 Billion |
| Origin | Organic and Conventional |
| Product Type | Vegan (Brown Mushroom, Other [Tomato-based, Lentil-based]), Non-Vegan (Beef, Poultry, Pork, Other [Lamb, Seafood]) |
| Packaging Type | Rigid Packaging, Food Cans, Jars, Flexible Packaging, Pouches, Sachets |
| Distribution Channel | Modern Grocery Retail, Hypermarkets/Supermarkets, Departmental Stores, Convenience Stores, Traditional Grocery Retail, Specialty Stores, Independent Grocery Stores, E-retail |
| End Use Industry | Household and Commercial Establishments |
| Regions Covered | North America, Latin America, Western Europe, Eastern Europe, South Asia and Pacific, East Asia, Middle East & Africa |
| Top Countries Covered | United States, Canada, United Kingdom, Germany, France, China, Japan, South Korea, Brazil, Australia and 40+ countries |
| Key Companies Profiled | Southeastern Mills, Inc., McCormick & Company, Inc., Campbell, Edward & Sons, Kent Precision Foods Group, Inc., Knorr, Food Club, Schwartz, Pioneer Foods, Suhana Masala, MountainKing Potatoes, Pioneer Gravy, Hellmann’s, ALCO FOODS PRIVATE LIMITED |
| Additional Attributes | Rising demand for clean-label, low-sodium, and plant-based gravy mixes is shaping product innovation. Single-serve formats, ethnic flavor variants, and organic certifications are further enhancing consumer appeal and market penetration across retail channels. |
The global gravy mixes market is estimated to be valued at USD 20.8 billion in 2025.
The market size for the gravy mixes market is projected to reach USD 40.1 billion by 2035.
The gravy mixes market is expected to grow at a 6.8% CAGR between 2025 and 2035.
The key product types in gravy mixes market are conventional gravy mixes and organic gravy mixes.
In terms of product type, non-vegan gravy mixes segment to command 68.7% share in the gravy mixes market in 2025.


Our Research Products

The "Full Research Suite" delivers actionable market intel, deep dives on markets or technologies, so clients act faster, cut risk, and unlock growth.

The Leaderboard benchmarks and ranks top vendors, classifying them as Established Leaders, Leading Challengers, or Disruptors & Challengers.

Locates where complements amplify value and substitutes erode it, forecasting net impact by horizon

We deliver granular, decision-grade intel: market sizing, 5-year forecasts, pricing, adoption, usage, revenue, and operational KPIs—plus competitor tracking, regulation, and value chains—across 60 countries broadly.

Spot the shifts before they hit your P&L. We track inflection points, adoption curves, pricing moves, and ecosystem plays to show where demand is heading, why it is changing, and what to do next across high-growth markets and disruptive tech

Real-time reads of user behavior. We track shifting priorities, perceptions of today’s and next-gen services, and provider experience, then pace how fast tech moves from trial to adoption, blending buyer, consumer, and channel inputs with social signals (#WhySwitch, #UX).

Partner with our analyst team to build a custom report designed around your business priorities. From analysing market trends to assessing competitors or crafting bespoke datasets, we tailor insights to your needs.
Supplier Intelligence
Discovery & Profiling
Capacity & Footprint
Performance & Risk
Compliance & Governance
Commercial Readiness
Who Supplies Whom
Scorecards & Shortlists
Playbooks & Docs
Category Intelligence
Definition & Scope
Demand & Use Cases
Cost Drivers
Market Structure
Supply Chain Map
Trade & Policy
Operating Norms
Deliverables
Buyer Intelligence
Account Basics
Spend & Scope
Procurement Model
Vendor Requirements
Terms & Policies
Entry Strategy
Pain Points & Triggers
Outputs
Pricing Analysis
Benchmarks
Trends
Should-Cost
Indexation
Landed Cost
Commercial Terms
Deliverables
Brand Analysis
Positioning & Value Prop
Share & Presence
Customer Evidence
Go-to-Market
Digital & Reputation
Compliance & Trust
KPIs & Gaps
Outputs
Full Research Suite comprises of:
Market outlook & trends analysis
Interviews & case studies
Strategic recommendations
Vendor profiles & capabilities analysis
5-year forecasts
8 regions and 60+ country-level data splits
Market segment data splits
12 months of continuous data updates
DELIVERED AS:
PDF EXCEL ONLINE
Dry Mixes Market Analysis - Size, Share and Forecast Outlook 2025 to 2035
Flour Mixes Market Growth – Specialty Baking & Industry Trends 2025 to 2035
Bakery Mixes Market Analysis - Size, Share, & Forecast Outlook 2025 to 2035
Competitive Breakdown of Bakery Mixes Suppliers
Biscuit Mixes Market Analysis by Functional Use, Distribution Channel and Region through 2035
United Kingdom Bakery Mixes Market Insights – Growth, Demand & Forecast 2025–2035
Complete Premixes Market Size and Share Forecast Outlook 2025 to 2035
Vegan Drink Mixes Market Analysis by Type, Source, Sale Channel, Flavor, Application and Region through 2035
ASEAN Bakery Mixes Market Outlook – Size, Share & Forecast 2025–2035
Europe Bakery Mixes Market Report – Growth, Size & Forecast 2025–2035
Nucleotide Premixes Market Analysis by form, application and region Flavors Through 2035
Dough Based Premixes Market Size and Share Forecast Outlook 2025 to 2035
Prepared Flour Mixes Market Analysis by Product and application Through 2035
Multi-Grain Premixes Market
Amino Acids Premixes Market
Cover Crop Seed Mixes Market Size and Share Forecast Outlook 2025 to 2035
Batter Based Premixes Market Size and Share Forecast Outlook 2025 to 2035
Australia Bakery Mixes Market Insights – Growth, Demand & Forecast 2025–2035
USA Nucleotide Premixes Market Report – Size, Trends & Industry Forecast 2025-2035
Latin America Bakery Mixes Market Report – Size, Demand & Forecast 2025–2035

Thank you!
You will receive an email from our Business Development Manager. Please be sure to check your SPAM/JUNK folder too.
Chat With
MaRIA