Gravity Conveyor System Market Size and Share Forecast Outlook From 2024 to 2034

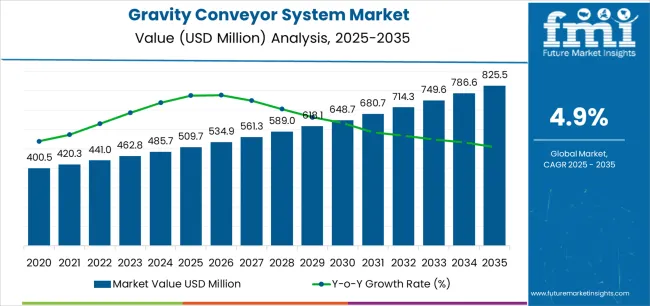
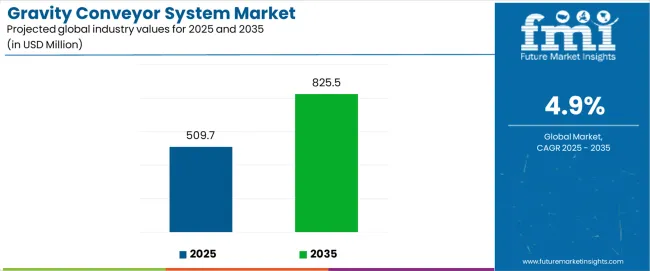
The global gravity conveyor system market size reached USD 460.6 million in 2023. Over the forecast period 2024 to 2034, global gravity conveyor system demand is anticipated to rise at 5.2% CAGR. Total market value is predicted to increase from USD 484.5 million in 2024 to USD 804.4 million in 2034.

Demand for gravity conveyor systems in the industrial machinery segment is projected to remain high. The latest market analysis predicts a 5.4% CAGR during the assessment period.

Attributes Key Insights
Gravity Conveyor System Market Size in 2023 USD 460.6 million
Estimated Gravity Conveyor System Market Value (2024E) USD 484.5 million
Projected Gravity Conveyor System Market Revenue (2034F) USD 804.4 million
Value-based Gravity Conveyor System Market CAGR (2024 to 2034) 5.2%
Collective Value Share: Top 2 Regions (2024E) 69.8%

Key Trends Shaping the Gravity Conveyor System Market

  • Manufacturers are increasingly embracing automated conveyor systems, including gravity conveyors, to revolutionize their production processes and boost efficiency.
  • The systems facilitate uninterrupted material flow, reduce downtime, and enhance manufacturing facility productivity.
  • As manufacturers prioritize operational excellence and seek to optimize costs, the adoption of automated gravity conveyors is expected to surge.
  • The allure lies in their ability to streamline operations, minimize manual intervention, and maximize output, aligning perfectly with the evolving needs of modern manufacturing.
  • By leveraging automation, manufacturers can achieve high throughput rates, improved resource utilization, and enhanced product quality, thereby driving the gravity conveyor belt market.
  • Integration of automated conveyor systems is poised to play a pivotal role in shaping the future of industrial production.

Factors Driving Growth in the Gravity Conveyor System Market

  • One of the main reasons the gravity conveyor system market is growing is rising focus on enhancing operational efficiency and productivity.
  • Companies in manufacturing, logistics, e-commerce, and retail sectors are adopting gravity conveyor tables to streamline their material handling processes, reduce manual labor, and improve workflow efficiency.
  • Ability of these systems to move products of different shapes, sizes, and weights efficiently contributes to their widespread adoption across diverse industries.
  • Focus on sustainability and environmental conservation is another factor contributing to the gravity conveyor system market growth.
  • The systems offer eco-friendly solutions by eliminating the need for electricity or fossil fuels, reducing carbon emissions and energy consumption.
  • As sustainability becomes a key priority worldwide, the appeal of gravity conveyor systems as environmentally responsible material handling solutions continues to rise.

Key Highlights of the Gravity Conveyor System Market

Market to Expand about 1.5X through 2034

The global gravity conveyor system market is predicted to expand around 1.5X through 2034, amid a 1.2% increase in expected CAGR compared to the historical one. This is due to growing demand for efficient material handling processes in several industries, including retail, manufacturing, logistics, and e-commerce.

The gravity skatewheel conveyor market is projected to continue to expand in terms of popularity. This is due to their versatility, cost-effectiveness, and ability to enhance efficiency in material handling processes across diverse industries worldwide. By 2034, the total market revenue is set to reach USD 804.4 million.

East Asia to Remain the Hotbed for Gravity Conveyor System Manufacturers

East Asia is expected to showcase considerable growth in the global gravity conveyor system market during the forecast period. It is set to hold around 41.5% of the global market share in 2024. This is attributed to the following factors:

Abundant Manufacturing Infrastructure: China and Japan offer an abundance of manufacturing infrastructure, including extensive facilities, skilled labor, and new technologies. This allows manufacturers to produce gravity conveyor systems at a competitive cost without compromising on quality standards. This strategy is likely to make China and Japan attractive locations for production.

Established Supply Chain Networks: China has a well-established supply chain network that facilitates the smooth transportation of raw materials and components. It ensures timely production and delivery of gravity conveyor systems to global markets. This enhances the country's appeal as a manufacturing hub.

Continuous Industry Growth: China's industries, such as e-commerce, logistics, and manufacturing, are experiencing robust growth. These create a consistent demand for efficient material handling solutions like gravity wheel conveyors. This further develops a fertile environment for manufacturers to flourish and innovate to meet evolving needs.

Superiority of Gravity Conveyor Rollers in Several Applications

Gravity roller conveyors are expected to be the leading type of conveyor due to their inherent simplicity, versatility, and cost-effectiveness. Compared to other conveyor types, gravity roller conveyors are more durable and can be used in a variety of applications.

Versatility of gravity roller conveyors allows them to handle a wide range of products in varying shapes and sizes. This makes them suitable for several industries, such as warehousing, distribution centers, manufacturing facilities, and retail environments.

Whether handling cartons, totes, pallets, or irregularly shaped items, gravity roller conveyors provide reliable and efficient transportation. These help in enhancing workflow efficiency and optimizing space utilization in facilities. The aforementioned factors are expected to augment the gravity conveyor roller market.

Comparison of Historical vs Future Outlook for the Gravity Conveyor System Market (2019 to 2023 vs 2024 to 2034)

Global sales of gravity conveyor systems grew at a CAGR of 4.5% between 2019 and 2023. Total market revenue reached about USD 460.6 million in 2023. In the forecast period, the worldwide gravity conveyor system industry is set to thrive at a CAGR of 5.2%.

Historical CAGR (2019 to 2023) 4.5%
Forecast CAGR (2024 to 2034) 5.2%
  • The global gravity skatewheel system market witnessed steady growth between 2019 and 2023.
  • Growth was attributed to increasing adoption of gravity conveyor for material handling.
  • High demand for enhanced supply chain visibility and proliferation of e-commerce also pushed the need for efficient warehouse operations.

Future Scope of the Gravity Conveyor System Market

  • Over the forecast period, the gravity conveyor system market is poised to exhibit healthy growth, totaling a valuation of USD 804.4 million by 2034.
  • Increasing industrialization and infrastructure development in emerging economies are anticipated to drive demand for efficient material handling solutions.
  • Focus on cost-effectiveness and sustainability, coupled with expansion of the e-commerce and retail sectors, is set to fuel growth.
  • The systems play a crucial role in handling high volumes of packages and parcels in distribution centers and warehouses.

Key Dynamics Driving the Gravity Conveyor System Market

Increasing Adoption by the E-commerce Sector

The global e-commerce and retail sectors are growing rapidly, which has led to an unprecedented demand for efficient material handling solutions. Gravity conveyors have become essential assets in this landscape. These are serving as linchpins in the complex logistics operations of distribution centers and warehouses.

Innovations in gravity conveyor roller systems facilitate seamless sorting, transportation, and fulfillment of orders. This ensures a smooth and continuous flow of products, enabling firm to meet the ever-increasing expectations of customers for timely delivery.

The e-commerce sector is projected to expand, driven by increasing internet penetration, changing consumer preferences, and technological advancements. Hence, the adoption of gravity conveyors is poised to witness substantial growth.

Novel conveyors offer scalability, flexibility, and cost-effectiveness. These are set to be an ideal choice for e-commerce companies striving to optimize their operations and remain competitive in the dynamic marketplace. Ability of gravity conveyors to handle several types of products with minimal manual intervention enhances their appeal in the e-commerce sector.

As the e-commerce industry continues its upward trajectory, significance of gravity conveyors as essential components of efficient material handling solutions is set to solidify. This is anticipated to push their continued adoption and integration into warehouses.

Small and Medium Enterprises to Propel Growth

The gravity conveyor system market is witnessing significant growth, driven by increasing number of small and medium-sized enterprises (SMEs) operating across different industries. SMEs are increasingly recognizing the importance of streamlined material handling processes.

They are striving to stay competitive and meet customer demands. To do so, they are adopting gravity conveyors as a cost-effective solution. These conveyor systems enable SMEs to automate their operations efficiently. These further help in enhancing workflow efficiency and productivity, while freeing up resources to focus on core business activities.

Gravity conveyors further offer scalability, flexibility, and ease of implementation, making them an attractive option for SMEs looking to expand their operations. They can adapt to evolving company needs.

They are also set to empower SMEs to optimize their material handling processes without incurring significant upfront costs. As a result, adoption of gravity conveyors among SMEs is on the rise, augmenting the gravity skatewheel system market.

Key Factors Restraining Growth in the Gravity Conveyor System Market

Competition from Alternative Material Handling Solutions

Although gravity conveyor systems have several advantages, they are facing stiff competition from other material handling solutions. These include powered conveyors, robotic systems, and manual handling methods.

Powered conveyors, even though they are more expensive to install and maintain, offer higher throughput rates and greater flexibility in routing & controlling the flow of products. Similarly, robotic systems provide advanced automation capabilities, allowing for intricate task handling and adaptive workflows.

Manual handling methods, even though they require more labor, are still prevalent in certain applications. These are mainly used in small-scale operations where investing in conveyor systems may not be feasible.

Gravity conveyor systems must contend with these alternatives, particularly in industries where speed, precision, or specialized handling requirements are critical. Gravity conveyor manufacturers are expected to enhance versatility, efficiency, and adaptability of their systems.

Economic Uncertainty and Volatility

Economic uncertainty and volatility pose significant restraints on the gravity conveyor system market. These are projected to influence investment decisions and capital expenditures across industries.

Fluctuations in macroeconomic factors such as GDP growth, interest rates, and consumer spending can impact demand for manufactured goods. During periods of economic downturn or instability, companies may defer or scale back investments in conveyor systems to conserve capital.

Uncertainties surrounding trade policies, geopolitical tensions, and supply chain disruptions can further exacerbate market volatility. These are likely to affect business confidence and investment sentiments.

To mitigate this restraint, manufacturers in the gravity feed roller conveyor market may need to adapt their strategies to navigate economic fluctuations. They are also focusing on diversifying their customer base and offering flexible pricing & financing options.

Analysis of Top Countries Manufacturing, Formulating, Packaging, Distributing, and Using Gravity Conveyor Systems

The table below highlights gravity conveyor system market revenues of several countries. China, the United States, and India are expected to remain the top three consumers of gravity conveyor systems, with expected valuations of USD 237.3 million, USD 94.9 million, and USD 86.9 million, respectively, in 2034.

Countries Gravity Conveyor System Market Revenue (2034)
China USD 237.3 million
United States USD 94.9 million
India USD 86.9 million
Germany USD 79.6 million
Japan USD 68.4 million
United Kingdom USD 39.4 million

The table below shows the estimated growth rates of several countries. India, China, and Germany are set to record high CAGRs of 5.7%, 5.4%, and 4.5%, respectively, through 2034.

Countries Projected Gravity Conveyor System Market CAGR (2024 to 2034)
India 5.7%
China 5.4%
Germany 4.5%
United States 4.2%
United Kingdom 4.0%
Japan 3.9%

Robust Supply Chain in China Spurs Gravity Feed Roller Conveyor Market

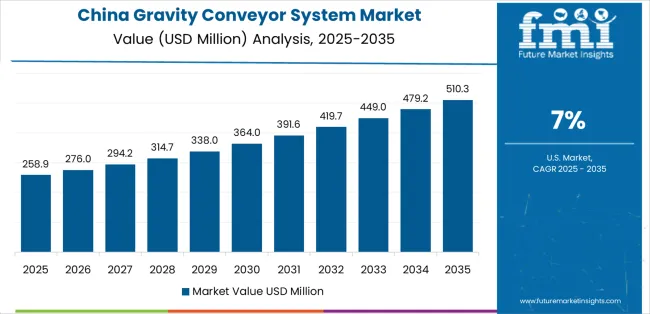
  • China’s gravity conveyor system market size is projected to reach USD 237.3 million by 2034.
  • Over the assessment period, demand for gravity conveyor systems in China is set to rise at 5.4% CAGR.
  • China boasts a vast manufacturing infrastructure and skilled labor force, allowing for efficient and cost-effective production of gravity conveyor systems.
  • Well-established supply chain networks and access to raw materials ensure smooth production and distribution processes, meeting the country’s demand effectively.
  • China's thriving industrial sector and continuous economic growth drive significant demand for material handling solutions.

E-commence Companies in the United States Seek Gravity Skatewheel Systems

  • The United States has a highly developed industrial sector with a diverse range of manufacturing industries that rely heavily on efficient material handling solutions.
  • The country's well-established logistics networks and advanced technology adoption supports the widespread implementation of gravity conveyor systems.
  • The United States places a strong emphasis on innovation and technological advancements,
  • It is driving continuous improvement in conveyor system designs and functionality.
  • Increasing e-commerce activity is propelling demand for efficient distribution and fulfillment solutions.
  • The United States gravity conveyor system market is projected to soar at a CAGR of around 4.2% during the assessment period.
  • Total valuation in the country is anticipated to reach USD 94.9 million by 2034.

Government Initiatives in India Propel Gravity Roller Table Sales

  • India's rapidly expanding manufacturing sector and increasing industrialization are set to generate significant demand for gravity conveyors.
  • Need for streamlined logistics and supply chain operations are expected to fuel adoption of gravity conveyor systems.
  • The government's initiatives, such as ‘Make in India’ and investments in infrastructure projects, are likely to create opportunities for the deployment of gravity conveyors.
  • Such initiatives aim to enhance manufacturing competitiveness and facilitate seamless movement of goods across the country.
  • Growing focus on sustainability and environmental conservation in India is anticipated to drive adoption of eco-friendly material handling solutions like gravity conveyors.
  • With their energy-efficient and low-maintenance design, gravity conveyors align with the country's efforts to reduce carbon emissions.

Gravity Conveyor System Industry Analysis by Top Investment Segments

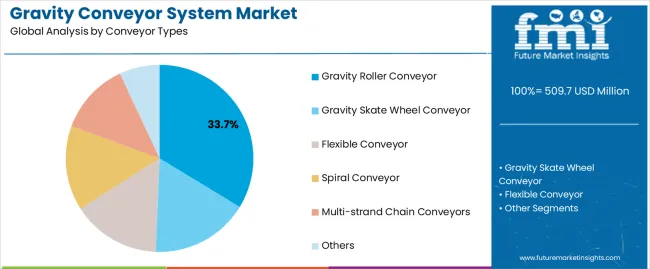
The section below shows the gravity roller conveyor segment dominating by conveyor type. It is forecast to thrive at 5.0% CAGR between 2024 and 2034.

Based on end-use, the industrial machinery segment is anticipated to hold a dominant share through 2034. It is set to exhibit a CAGR of 5.4% during the forecast period.

Gravity Roller Conveyor to Find Application in Warehouse Operations

Top Segment (Conveyor Types) Gravity Roller Conveyor
Predicted CAGR (2024 to 2034) 5.0%
  • Gravity roller conveyors offer several benefits for warehouse operations.
  • The conveyors are versatile and can accommodate a wide range of product sizes and shapes, making them suitable for multiple warehouse applications.
  • Gravity roller conveyors are cost-effective solutions, requiring minimal maintenance and operational expenses compared to powered conveyor systems.
  • The segment is anticipated to hold a significant volume share of 33.4% in 2024.

Industrial Machinery Manufacturers Demand Gravity Conveyor Belts

Top Segment (By End-use) Industrial Machinery
Projected CAGR (2024 to 2034) 5.4%
  • Gravity conveyors offer several benefits in the industrial machinery segment.
  • They provide a cost-effective solution for material handling, as they do not require external power sources for operation.
  • Gravity conveyors are versatile and adaptable, making them suitable for several industrial applications.
  • Gravity conveyors contribute to improved safety in industrial environments by minimizing the risk of accidents associated with manual handling.
  • Their simple design and ease of installation make them ideal for integration into existing production lines or facility layouts without extensive modifications.
  • The industrial machinery segment is projected to thrive at 5.4% CAGR during the forecast period. It is set to attain a valuation of USD 277.5 million by 2034.

Competitive Landscape of the Gravity Conveyor System Market

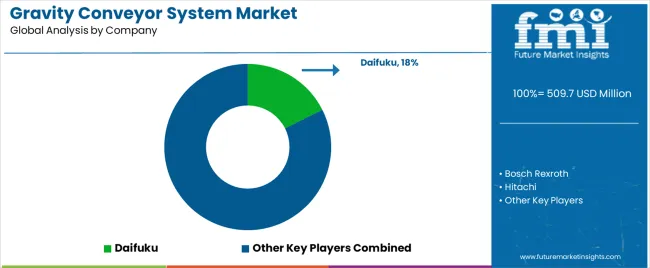
The global gravity conveyor system market is moderately consolidated, with leading players accounting for about 40% to 45% share. Bosch Rexroth, Siemens, Dematic, Rexnord, Durr AG, and Buhler Group are the leading manufacturers and suppliers of gravity conveyor systems listed in the report.

Key gravity conveyor system manufacturers are investing in research & development activities to discover novel products. They are also focusing on mergers and acquisitions to come up with innovative solutions and cater to high consumer demands.

Recent Developments in Gravity Conveyor System Market

  • In February 2024, Ultimation Industries launched two new products under its heavy-duty gravity roller conveyor portfolio. The products come with 2 lengths that would enable manufacturers, shipping companies, and warehouses to gain access to novel material handling features.
  • In 2023, Bosch Rexroth showcased its high-speed conveyance system called Flexible Transport System (FTS) at Automate 2023. The new system would help position and transport workpieces and materials.

Key Coverage in the Gravity Conveyor System Market Report

  • ASEAN Conveyor System Market Size
  • Pallet Conveyor Systems Market Growth Outlook
  • Insights into Adjacent Markets like Gravity Conveyor Table Market, Gravity Wheel Conveyor Market, and Gravity Roller Table Market
  • Conveyor System Market Size, Growth Report & Forecast
  • Gravity Roller Conveyors Market Size
  • Gravity Conveyor System Market in India
  • Information about Wholesale Cheap Gravity Roller Conveyor Manufacturers
  • Powered Roller Conveyor Manufacturers in India
  • North America Conveyors Market Size & Share Analysis
  • Top Gravity Conveyor Belt Dealers in Mumbai
  • Price Analysis of Lightweight Gravity Roller Conveyors from King Materials Handling

Scope and Coverage of the Gravity Conveyor System Market Report

Attribute Details
Estimated Gravity Conveyor System Market Size (2024) USD 484.5 million
Projected Gravity Conveyor System Market Size (2034) USD 804.4 million
Anticipated Growth Rate (2024 to 2034) 5.2%
Historical Data 2019 to 2023
Forecast Period 2024 to 2034
Quantitative Units Value (USD million) and Volume (Units)
Report Coverage Revenue Forecast, Volume Forecast, Company Ranking, Competitive Landscape, Growth Factors, Trends and Pricing Analysis
Gravity Conveyor System Market Segments Covered By Conveyor Types, By Capacity, By Material, By Sales Channel, By End-use, By Region
Regions Covered North America; Latin America; Western Europe; Eastern Europe; East Asia; South Asia & Pacific; Middle East & Africa
Key Countries Covered United States, Canada, Mexico, Brazil, Germany, Italy, France, United Kingdom, Spain, BENELUX, NORDICS, Poland, Hungary, Balkan and Baltics, Russia, India, Association of Southeast Asian Nations, Australia and New Zealand, China, Japan, Germany, Kingdom of Saudi Arabia, Other GCC Countries, Türkiye, Other African Union, South Africa
Key Companies Profiled Bosch Rexroth; Hitachi; Siemens; Dematic; Rexnord; Durr AG; Buhler Group; Daifuku; FlexLink; Jungheinrich; Liebherr Group; Dorner Conveyors; Hytrol Conveyor; Fujian Gao Chuang Machinery Co.; Kardex; LEWCO

Top Segments Studied in the Gravity Conveyor System Market

By Conveyor Types:

  • Gravity Roller Conveyor
  • Gravity Skate Wheel Conveyor
  • Flexible Conveyor
  • Spiral Conveyor
  • Multi-strand Chain Conveyors
  • Others

By Capacity:

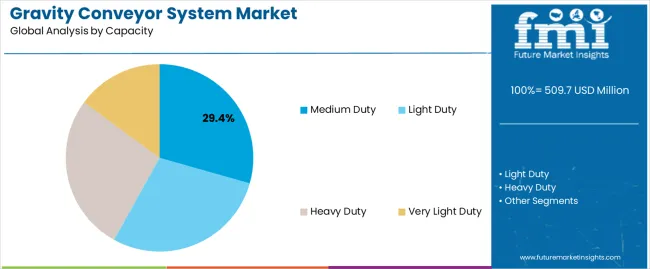
  • Light Duty
  • Medium Duty
  • Heavy Duty
  • Very Light Duty

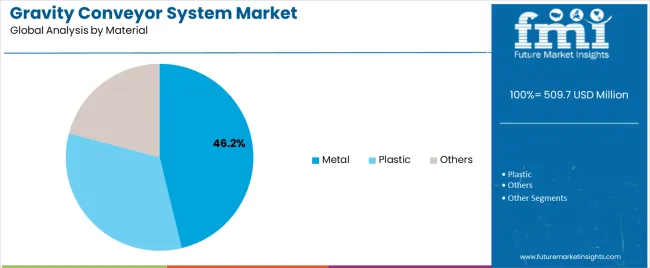
By Material:

  • Metal
  • Plastic
  • Others

By Sales Channel:

  • Direct Channel
  • Indirect Channel

By End-use:

  • Automotive
  • Food and Beverage
  • Agriculture
  • Industrial Machinery
  • Pharmaceutical
  • Retail
  • Others

By Region:

  • North America
  • Latin America
  • Western Europe
  • Eastern Europe
  • East Asia
  • South Asia & Pacific
  • Middle East & Africa

Table of Content

  • 1. Executive Summary
  • 2. Market Overview
  • 3. Key Market Trends
  • 4. Key Success Factors
  • 5. Global Market Demand Analysis 2019 to 2023 and Forecast, 2024 to 2034
  • 6. Global Market - Pricing Analysis
  • 7. Global Market Demand (in Value or Size in USD million) Analysis 2019 to 2023 and Forecast, 2024 to 2034
  • 8. Market Background
  • 9. Global Market Analysis 2019 to 2023 and Forecast 2024 to 2034, By Conveyor Types
    • 9.1. Gravity Roller Conveyor
    • 9.2. Gravity Skate Wheel Conveyor
    • 9.3. Flexible Conveyor
    • 9.4. Spiral Conveyor
    • 9.5. Multi-strand Chain Conveyors
    • 9.6. Others
  • 10. Global Market Analysis 2019 to 2023 and Forecast 2024 to 2034, By Capacity
    • 10.1. Light Duty
    • 10.2. Medium Duty
    • 10.3. Heavy Duty
    • 10.4. Very Light Duty
  • 11. Global Market Analysis 2019 to 2023 and Forecast 2024 to 2034, By Material
    • 11.1. Metal
    • 11.2. Plastic
    • 11.3. Others
  • 12. Global Market Analysis 2019 to 2023 and Forecast 2024 to 2034, By Sales Channel
    • 12.1. Direct Channel
    • 12.2. Indirect Channel
  • 13. Global Market Analysis 2019 to 2023 and Forecast 2024 to 2034, By End Use
    • 13.1. Automotive
    • 13.2. Food and Beverage
    • 13.3. Agriculture
    • 13.4. Industrial Machinery
    • 13.5. Pharmaceutical
    • 13.6. Retail
    • 13.7. Others
  • 14. Global Market Analysis 2019 to 2023 and Forecast 2024 to 2034, By Region
    • 14.1. North America
    • 14.2. Latin America
    • 14.3. East Asia
    • 14.4. South Asia Pacific
    • 14.5. Western Europe
    • 14.6. Eastern Europe
    • 14.7. Middle East and Africa
  • 15. North America Market Analysis 2019 to 2023 and Forecast 2024 to 2034
  • 16. Latin America Market Analysis 2019 to 2023 and Forecast 2024 to 2034
  • 17. East Asia Market Analysis 2019 to 2023 and Forecast 2024 to 2034
  • 18. South Asia Pacific Market Analysis 2019 to 2023 and Forecast 2024 to 2034
  • 19. Western Europe Market Analysis 2019 to 2023 and Forecast 2024 to 2034
  • 20. Eastern Europe Market Analysis 2019 to 2023 and Forecast 2024 to 2034
  • 21. Middle East and Africa Market Analysis 2019 to 2023 and Forecast 2024 to 2034
  • 22. Country-wise Market Analysis
  • 23. Market Structure Analysis
  • 24. Competition Analysis
    • 24.1. Bosch Rexroth
    • 24.2. Hitachi
    • 24.3. Siemens
    • 24.4. Dematic
    • 24.5. Rexnord
    • 24.6. Durr AG
    • 24.7. Buhler Group
    • 24.8. Daifuku
    • 24.9. FlexLink
    • 24.10. Jungheinrich
    • 24.11. Liebherr Group
    • 24.12. Dorner Conveyors
    • 24.13. Hytrol Conveyor
    • 24.14. Fujian Gao Chuang Machinery Co.
    • 24.15. Kardex
    • 24.16. LEWCO
    • 24.17. Other Key Players
  • 25. Primary Insights
  • 26. Assumptions and Acronyms Used
  • 27. Research Methodology

List of Tables

Table 1: Global Market Value (US$ million) Forecast by Region, 2019 to 2034

Table 2: Global Market Volume (Units) Forecast by Region, 2019 to 2034

Table 3: Global Market Value (US$ million) Forecast by Conveyor Types, 2019 to 2034

Table 4: Global Market Volume (Units) Forecast by Conveyor Types, 2019 to 2034

Table 5: Global Market Value (US$ million) Forecast by Capacity, 2019 to 2034

Table 6: Global Market Volume (Units) Forecast by Capacity, 2019 to 2034

Table 7: Global Market Value (US$ million) Forecast by Material, 2019 to 2034

Table 8: Global Market Volume (Units) Forecast by Material, 2019 to 2034

Table 9: Global Market Value (US$ million) Forecast by Sales Channel, 2019 to 2034

Table 10: Global Market Volume (Units) Forecast by Sales Channel, 2019 to 2034

Table 11: Global Market Value (US$ million) Forecast by End Use, 2019 to 2034

Table 12: Global Market Volume (Units) Forecast by End Use, 2019 to 2034

Table 13: North America Market Value (US$ million) Forecast by Country, 2019 to 2034

Table 14: North America Market Volume (Units) Forecast by Country, 2019 to 2034

Table 15: North America Market Value (US$ million) Forecast by Conveyor Types, 2019 to 2034

Table 16: North America Market Volume (Units) Forecast by Conveyor Types, 2019 to 2034

Table 17: North America Market Value (US$ million) Forecast by Capacity, 2019 to 2034

Table 18: North America Market Volume (Units) Forecast by Capacity, 2019 to 2034

Table 19: North America Market Value (US$ million) Forecast by Material, 2019 to 2034

Table 20: North America Market Volume (Units) Forecast by Material, 2019 to 2034

Table 21: North America Market Value (US$ million) Forecast by Sales Channel, 2019 to 2034

Table 22: North America Market Volume (Units) Forecast by Sales Channel, 2019 to 2034

Table 23: North America Market Value (US$ million) Forecast by End Use, 2019 to 2034

Table 24: North America Market Volume (Units) Forecast by End Use, 2019 to 2034

Table 25: Latin America Market Value (US$ million) Forecast by Country, 2019 to 2034

Table 26: Latin America Market Volume (Units) Forecast by Country, 2019 to 2034

Table 27: Latin America Market Value (US$ million) Forecast by Conveyor Types, 2019 to 2034

Table 28: Latin America Market Volume (Units) Forecast by Conveyor Types, 2019 to 2034

Table 29: Latin America Market Value (US$ million) Forecast by Capacity, 2019 to 2034

Table 30: Latin America Market Volume (Units) Forecast by Capacity, 2019 to 2034

Table 31: Latin America Market Value (US$ million) Forecast by Material, 2019 to 2034

Table 32: Latin America Market Volume (Units) Forecast by Material, 2019 to 2034

Table 33: Latin America Market Value (US$ million) Forecast by Sales Channel, 2019 to 2034

Table 34: Latin America Market Volume (Units) Forecast by Sales Channel, 2019 to 2034

Table 35: Latin America Market Value (US$ million) Forecast by End Use, 2019 to 2034

Table 36: Latin America Market Volume (Units) Forecast by End Use, 2019 to 2034

Table 37: Western Europe Market Value (US$ million) Forecast by Country, 2019 to 2034

Table 38: Western Europe Market Volume (Units) Forecast by Country, 2019 to 2034

Table 39: Western Europe Market Value (US$ million) Forecast by Conveyor Types, 2019 to 2034

Table 40: Western Europe Market Volume (Units) Forecast by Conveyor Types, 2019 to 2034

Table 41: Western Europe Market Value (US$ million) Forecast by Capacity, 2019 to 2034

Table 42: Western Europe Market Volume (Units) Forecast by Capacity, 2019 to 2034

Table 43: Western Europe Market Value (US$ million) Forecast by Material, 2019 to 2034

Table 44: Western Europe Market Volume (Units) Forecast by Material, 2019 to 2034

Table 45: Western Europe Market Value (US$ million) Forecast by Sales Channel, 2019 to 2034

Table 46: Western Europe Market Volume (Units) Forecast by Sales Channel, 2019 to 2034

Table 47: Western Europe Market Value (US$ million) Forecast by End Use, 2019 to 2034

Table 48: Western Europe Market Volume (Units) Forecast by End Use, 2019 to 2034

Table 49: Eastern Europe Market Value (US$ million) Forecast by Country, 2019 to 2034

Table 50: Eastern Europe Market Volume (Units) Forecast by Country, 2019 to 2034

Table 51: Eastern Europe Market Value (US$ million) Forecast by Conveyor Types, 2019 to 2034

Table 52: Eastern Europe Market Volume (Units) Forecast by Conveyor Types, 2019 to 2034

Table 53: Eastern Europe Market Value (US$ million) Forecast by Capacity, 2019 to 2034

Table 54: Eastern Europe Market Volume (Units) Forecast by Capacity, 2019 to 2034

Table 55: Eastern Europe Market Value (US$ million) Forecast by Material, 2019 to 2034

Table 56: Eastern Europe Market Volume (Units) Forecast by Material, 2019 to 2034

Table 57: Eastern Europe Market Value (US$ million) Forecast by Sales Channel, 2019 to 2034

Table 58: Eastern Europe Market Volume (Units) Forecast by Sales Channel, 2019 to 2034

Table 59: Eastern Europe Market Value (US$ million) Forecast by End Use, 2019 to 2034

Table 60: Eastern Europe Market Volume (Units) Forecast by End Use, 2019 to 2034

Table 61: East Asia Market Value (US$ million) Forecast by Country, 2019 to 2034

Table 62: East Asia Market Volume (Units) Forecast by Country, 2019 to 2034

Table 63: East Asia Market Value (US$ million) Forecast by Conveyor Types, 2019 to 2034

Table 64: East Asia Market Volume (Units) Forecast by Conveyor Types, 2019 to 2034

Table 65: East Asia Market Value (US$ million) Forecast by Capacity, 2019 to 2034

Table 66: East Asia Market Volume (Units) Forecast by Capacity, 2019 to 2034

Table 67: East Asia Market Value (US$ million) Forecast by Material, 2019 to 2034

Table 68: East Asia Market Volume (Units) Forecast by Material, 2019 to 2034

Table 69: East Asia Market Value (US$ million) Forecast by Sales Channel, 2019 to 2034

Table 70: East Asia Market Volume (Units) Forecast by Sales Channel, 2019 to 2034

Table 71: East Asia Market Value (US$ million) Forecast by End Use, 2019 to 2034

Table 72: East Asia Market Volume (Units) Forecast by End Use, 2019 to 2034

Table 73: South Asia Pacific Market Value (US$ million) Forecast by Country, 2019 to 2034

Table 74: South Asia Pacific Market Volume (Units) Forecast by Country, 2019 to 2034

Table 75: South Asia Pacific Market Value (US$ million) Forecast by Conveyor Types, 2019 to 2034

Table 76: South Asia Pacific Market Volume (Units) Forecast by Conveyor Types, 2019 to 2034

Table 77: South Asia Pacific Market Value (US$ million) Forecast by Capacity, 2019 to 2034

Table 78: South Asia Pacific Market Volume (Units) Forecast by Capacity, 2019 to 2034

Table 79: South Asia Pacific Market Value (US$ million) Forecast by Material, 2019 to 2034

Table 80: South Asia Pacific Market Volume (Units) Forecast by Material, 2019 to 2034

Table 81: South Asia Pacific Market Value (US$ million) Forecast by Sales Channel, 2019 to 2034

Table 82: South Asia Pacific Market Volume (Units) Forecast by Sales Channel, 2019 to 2034

Table 83: South Asia Pacific Market Value (US$ million) Forecast by End Use, 2019 to 2034

Table 84: South Asia Pacific Market Volume (Units) Forecast by End Use, 2019 to 2034

Table 85: Middle East and Africa Market Value (US$ million) Forecast by Country, 2019 to 2034

Table 86: Middle East and Africa Market Volume (Units) Forecast by Country, 2019 to 2034

Table 87: Middle East and Africa Market Value (US$ million) Forecast by Conveyor Types, 2019 to 2034

Table 88: Middle East and Africa Market Volume (Units) Forecast by Conveyor Types, 2019 to 2034

Table 89: Middle East and Africa Market Value (US$ million) Forecast by Capacity, 2019 to 2034

Table 90: Middle East and Africa Market Volume (Units) Forecast by Capacity, 2019 to 2034

Table 91: Middle East and Africa Market Value (US$ million) Forecast by Material, 2019 to 2034

Table 92: Middle East and Africa Market Volume (Units) Forecast by Material, 2019 to 2034

Table 93: Middle East and Africa Market Value (US$ million) Forecast by Sales Channel, 2019 to 2034

Table 94: Middle East and Africa Market Volume (Units) Forecast by Sales Channel, 2019 to 2034

Table 95: Middle East and Africa Market Value (US$ million) Forecast by End Use, 2019 to 2034

Table 96: Middle East and Africa Market Volume (Units) Forecast by End Use, 2019 to 2034

List of Figures

Figure 1: Global Market Value (US$ million) by Conveyor Types, 2024 to 2034

Figure 2: Global Market Value (US$ million) by Capacity, 2024 to 2034

Figure 3: Global Market Value (US$ million) by Material, 2024 to 2034

Figure 4: Global Market Value (US$ million) by Sales Channel, 2024 to 2034

Figure 5: Global Market Value (US$ million) by End Use, 2024 to 2034

Figure 6: Global Market Value (US$ million) by Region, 2024 to 2034

Figure 7: Global Market Value (US$ million) Analysis by Region, 2019 to 2034

Figure 8: Global Market Volume (Units) Analysis by Region, 2019 to 2034

Figure 9: Global Market Value Share (%) and BPS Analysis by Region, 2024 to 2034

Figure 10: Global Market Y-o-Y Growth (%) Projections by Region, 2024 to 2034

Figure 11: Global Market Value (US$ million) Analysis by Conveyor Types, 2019 to 2034

Figure 12: Global Market Volume (Units) Analysis by Conveyor Types, 2019 to 2034

Figure 13: Global Market Value Share (%) and BPS Analysis by Conveyor Types, 2024 to 2034

Figure 14: Global Market Y-o-Y Growth (%) Projections by Conveyor Types, 2024 to 2034

Figure 15: Global Market Value (US$ million) Analysis by Capacity, 2019 to 2034

Figure 16: Global Market Volume (Units) Analysis by Capacity, 2019 to 2034

Figure 17: Global Market Value Share (%) and BPS Analysis by Capacity, 2024 to 2034

Figure 18: Global Market Y-o-Y Growth (%) Projections by Capacity, 2024 to 2034

Figure 19: Global Market Value (US$ million) Analysis by Material, 2019 to 2034

Figure 20: Global Market Volume (Units) Analysis by Material, 2019 to 2034

Figure 21: Global Market Value Share (%) and BPS Analysis by Material, 2024 to 2034

Figure 22: Global Market Y-o-Y Growth (%) Projections by Material, 2024 to 2034

Figure 23: Global Market Value (US$ million) Analysis by Sales Channel, 2019 to 2034

Figure 24: Global Market Volume (Units) Analysis by Sales Channel, 2019 to 2034

Figure 25: Global Market Value Share (%) and BPS Analysis by Sales Channel, 2024 to 2034

Figure 26: Global Market Y-o-Y Growth (%) Projections by Sales Channel, 2024 to 2034

Figure 27: Global Market Value (US$ million) Analysis by End Use, 2019 to 2034

Figure 28: Global Market Volume (Units) Analysis by End Use, 2019 to 2034

Figure 29: Global Market Value Share (%) and BPS Analysis by End Use, 2024 to 2034

Figure 30: Global Market Y-o-Y Growth (%) Projections by End Use, 2024 to 2034

Figure 31: Global Market Attractiveness by Conveyor Types, 2024 to 2034

Figure 32: Global Market Attractiveness by Capacity, 2024 to 2034

Figure 33: Global Market Attractiveness by Material, 2024 to 2034

Figure 34: Global Market Attractiveness by Sales Channel, 2024 to 2034

Figure 35: Global Market Attractiveness by End Use, 2024 to 2034

Figure 36: Global Market Attractiveness by Region, 2024 to 2034

Figure 37: North America Market Value (US$ million) by Conveyor Types, 2024 to 2034

Figure 38: North America Market Value (US$ million) by Capacity, 2024 to 2034

Figure 39: North America Market Value (US$ million) by Material, 2024 to 2034

Figure 40: North America Market Value (US$ million) by Sales Channel, 2024 to 2034

Figure 41: North America Market Value (US$ million) by End Use, 2024 to 2034

Figure 42: North America Market Value (US$ million) by Country, 2024 to 2034

Figure 43: North America Market Value (US$ million) Analysis by Country, 2019 to 2034

Figure 44: North America Market Volume (Units) Analysis by Country, 2019 to 2034

Figure 45: North America Market Value Share (%) and BPS Analysis by Country, 2024 to 2034

Figure 46: North America Market Y-o-Y Growth (%) Projections by Country, 2024 to 2034

Figure 47: North America Market Value (US$ million) Analysis by Conveyor Types, 2019 to 2034

Figure 48: North America Market Volume (Units) Analysis by Conveyor Types, 2019 to 2034

Figure 49: North America Market Value Share (%) and BPS Analysis by Conveyor Types, 2024 to 2034

Figure 50: North America Market Y-o-Y Growth (%) Projections by Conveyor Types, 2024 to 2034

Figure 51: North America Market Value (US$ million) Analysis by Capacity, 2019 to 2034

Figure 52: North America Market Volume (Units) Analysis by Capacity, 2019 to 2034

Figure 53: North America Market Value Share (%) and BPS Analysis by Capacity, 2024 to 2034

Figure 54: North America Market Y-o-Y Growth (%) Projections by Capacity, 2024 to 2034

Figure 55: North America Market Value (US$ million) Analysis by Material, 2019 to 2034

Figure 56: North America Market Volume (Units) Analysis by Material, 2019 to 2034

Figure 57: North America Market Value Share (%) and BPS Analysis by Material, 2024 to 2034

Figure 58: North America Market Y-o-Y Growth (%) Projections by Material, 2024 to 2034

Figure 59: North America Market Value (US$ million) Analysis by Sales Channel, 2019 to 2034

Figure 60: North America Market Volume (Units) Analysis by Sales Channel, 2019 to 2034

Figure 61: North America Market Value Share (%) and BPS Analysis by Sales Channel, 2024 to 2034

Figure 62: North America Market Y-o-Y Growth (%) Projections by Sales Channel, 2024 to 2034

Figure 63: North America Market Value (US$ million) Analysis by End Use, 2019 to 2034

Figure 64: North America Market Volume (Units) Analysis by End Use, 2019 to 2034

Figure 65: North America Market Value Share (%) and BPS Analysis by End Use, 2024 to 2034

Figure 66: North America Market Y-o-Y Growth (%) Projections by End Use, 2024 to 2034

Figure 67: North America Market Attractiveness by Conveyor Types, 2024 to 2034

Figure 68: North America Market Attractiveness by Capacity, 2024 to 2034

Figure 69: North America Market Attractiveness by Material, 2024 to 2034

Figure 70: North America Market Attractiveness by Sales Channel, 2024 to 2034

Figure 71: North America Market Attractiveness by End Use, 2024 to 2034

Figure 72: North America Market Attractiveness by Country, 2024 to 2034

Figure 73: Latin America Market Value (US$ million) by Conveyor Types, 2024 to 2034

Figure 74: Latin America Market Value (US$ million) by Capacity, 2024 to 2034

Figure 75: Latin America Market Value (US$ million) by Material, 2024 to 2034

Figure 76: Latin America Market Value (US$ million) by Sales Channel, 2024 to 2034

Figure 77: Latin America Market Value (US$ million) by End Use, 2024 to 2034

Figure 78: Latin America Market Value (US$ million) by Country, 2024 to 2034

Figure 79: Latin America Market Value (US$ million) Analysis by Country, 2019 to 2034

Figure 80: Latin America Market Volume (Units) Analysis by Country, 2019 to 2034

Figure 81: Latin America Market Value Share (%) and BPS Analysis by Country, 2024 to 2034

Figure 82: Latin America Market Y-o-Y Growth (%) Projections by Country, 2024 to 2034

Figure 83: Latin America Market Value (US$ million) Analysis by Conveyor Types, 2019 to 2034

Figure 84: Latin America Market Volume (Units) Analysis by Conveyor Types, 2019 to 2034

Figure 85: Latin America Market Value Share (%) and BPS Analysis by Conveyor Types, 2024 to 2034

Figure 86: Latin America Market Y-o-Y Growth (%) Projections by Conveyor Types, 2024 to 2034

Figure 87: Latin America Market Value (US$ million) Analysis by Capacity, 2019 to 2034

Figure 88: Latin America Market Volume (Units) Analysis by Capacity, 2019 to 2034

Figure 89: Latin America Market Value Share (%) and BPS Analysis by Capacity, 2024 to 2034

Figure 90: Latin America Market Y-o-Y Growth (%) Projections by Capacity, 2024 to 2034

Figure 91: Latin America Market Value (US$ million) Analysis by Material, 2019 to 2034

Figure 92: Latin America Market Volume (Units) Analysis by Material, 2019 to 2034

Figure 93: Latin America Market Value Share (%) and BPS Analysis by Material, 2024 to 2034

Figure 94: Latin America Market Y-o-Y Growth (%) Projections by Material, 2024 to 2034

Figure 95: Latin America Market Value (US$ million) Analysis by Sales Channel, 2019 to 2034

Figure 96: Latin America Market Volume (Units) Analysis by Sales Channel, 2019 to 2034

Figure 97: Latin America Market Value Share (%) and BPS Analysis by Sales Channel, 2024 to 2034

Figure 98: Latin America Market Y-o-Y Growth (%) Projections by Sales Channel, 2024 to 2034

Figure 99: Latin America Market Value (US$ million) Analysis by End Use, 2019 to 2034

Figure 100: Latin America Market Volume (Units) Analysis by End Use, 2019 to 2034

Figure 101: Latin America Market Value Share (%) and BPS Analysis by End Use, 2024 to 2034

Figure 102: Latin America Market Y-o-Y Growth (%) Projections by End Use, 2024 to 2034

Figure 103: Latin America Market Attractiveness by Conveyor Types, 2024 to 2034

Figure 104: Latin America Market Attractiveness by Capacity, 2024 to 2034

Figure 105: Latin America Market Attractiveness by Material, 2024 to 2034

Figure 106: Latin America Market Attractiveness by Sales Channel, 2024 to 2034

Figure 107: Latin America Market Attractiveness by End Use, 2024 to 2034

Figure 108: Latin America Market Attractiveness by Country, 2024 to 2034

Figure 109: Western Europe Market Value (US$ million) by Conveyor Types, 2024 to 2034

Figure 110: Western Europe Market Value (US$ million) by Capacity, 2024 to 2034

Figure 111: Western Europe Market Value (US$ million) by Material, 2024 to 2034

Figure 112: Western Europe Market Value (US$ million) by Sales Channel, 2024 to 2034

Figure 113: Western Europe Market Value (US$ million) by End Use, 2024 to 2034

Figure 114: Western Europe Market Value (US$ million) by Country, 2024 to 2034

Figure 115: Western Europe Market Value (US$ million) Analysis by Country, 2019 to 2034

Figure 116: Western Europe Market Volume (Units) Analysis by Country, 2019 to 2034

Figure 117: Western Europe Market Value Share (%) and BPS Analysis by Country, 2024 to 2034

Figure 118: Western Europe Market Y-o-Y Growth (%) Projections by Country, 2024 to 2034

Figure 119: Western Europe Market Value (US$ million) Analysis by Conveyor Types, 2019 to 2034

Figure 120: Western Europe Market Volume (Units) Analysis by Conveyor Types, 2019 to 2034

Figure 121: Western Europe Market Value Share (%) and BPS Analysis by Conveyor Types, 2024 to 2034

Figure 122: Western Europe Market Y-o-Y Growth (%) Projections by Conveyor Types, 2024 to 2034

Figure 123: Western Europe Market Value (US$ million) Analysis by Capacity, 2019 to 2034

Figure 124: Western Europe Market Volume (Units) Analysis by Capacity, 2019 to 2034

Figure 125: Western Europe Market Value Share (%) and BPS Analysis by Capacity, 2024 to 2034

Figure 126: Western Europe Market Y-o-Y Growth (%) Projections by Capacity, 2024 to 2034

Figure 127: Western Europe Market Value (US$ million) Analysis by Material, 2019 to 2034

Figure 128: Western Europe Market Volume (Units) Analysis by Material, 2019 to 2034

Figure 129: Western Europe Market Value Share (%) and BPS Analysis by Material, 2024 to 2034

Figure 130: Western Europe Market Y-o-Y Growth (%) Projections by Material, 2024 to 2034

Figure 131: Western Europe Market Value (US$ million) Analysis by Sales Channel, 2019 to 2034

Figure 132: Western Europe Market Volume (Units) Analysis by Sales Channel, 2019 to 2034

Figure 133: Western Europe Market Value Share (%) and BPS Analysis by Sales Channel, 2024 to 2034

Figure 134: Western Europe Market Y-o-Y Growth (%) Projections by Sales Channel, 2024 to 2034

Figure 135: Western Europe Market Value (US$ million) Analysis by End Use, 2019 to 2034

Figure 136: Western Europe Market Volume (Units) Analysis by End Use, 2019 to 2034

Figure 137: Western Europe Market Value Share (%) and BPS Analysis by End Use, 2024 to 2034

Figure 138: Western Europe Market Y-o-Y Growth (%) Projections by End Use, 2024 to 2034

Figure 139: Western Europe Market Attractiveness by Conveyor Types, 2024 to 2034

Figure 140: Western Europe Market Attractiveness by Capacity, 2024 to 2034

Figure 141: Western Europe Market Attractiveness by Material, 2024 to 2034

Figure 142: Western Europe Market Attractiveness by Sales Channel, 2024 to 2034

Figure 143: Western Europe Market Attractiveness by End Use, 2024 to 2034

Figure 144: Western Europe Market Attractiveness by Country, 2024 to 2034

Figure 145: Eastern Europe Market Value (US$ million) by Conveyor Types, 2024 to 2034

Figure 146: Eastern Europe Market Value (US$ million) by Capacity, 2024 to 2034

Figure 147: Eastern Europe Market Value (US$ million) by Material, 2024 to 2034

Figure 148: Eastern Europe Market Value (US$ million) by Sales Channel, 2024 to 2034

Figure 149: Eastern Europe Market Value (US$ million) by End Use, 2024 to 2034

Figure 150: Eastern Europe Market Value (US$ million) by Country, 2024 to 2034

Figure 151: Eastern Europe Market Value (US$ million) Analysis by Country, 2019 to 2034

Figure 152: Eastern Europe Market Volume (Units) Analysis by Country, 2019 to 2034

Figure 153: Eastern Europe Market Value Share (%) and BPS Analysis by Country, 2024 to 2034

Figure 154: Eastern Europe Market Y-o-Y Growth (%) Projections by Country, 2024 to 2034

Figure 155: Eastern Europe Market Value (US$ million) Analysis by Conveyor Types, 2019 to 2034

Figure 156: Eastern Europe Market Volume (Units) Analysis by Conveyor Types, 2019 to 2034

Figure 157: Eastern Europe Market Value Share (%) and BPS Analysis by Conveyor Types, 2024 to 2034

Figure 158: Eastern Europe Market Y-o-Y Growth (%) Projections by Conveyor Types, 2024 to 2034

Figure 159: Eastern Europe Market Value (US$ million) Analysis by Capacity, 2019 to 2034

Figure 160: Eastern Europe Market Volume (Units) Analysis by Capacity, 2019 to 2034

Figure 161: Eastern Europe Market Value Share (%) and BPS Analysis by Capacity, 2024 to 2034

Figure 162: Eastern Europe Market Y-o-Y Growth (%) Projections by Capacity, 2024 to 2034

Figure 163: Eastern Europe Market Value (US$ million) Analysis by Material, 2019 to 2034

Figure 164: Eastern Europe Market Volume (Units) Analysis by Material, 2019 to 2034

Figure 165: Eastern Europe Market Value Share (%) and BPS Analysis by Material, 2024 to 2034

Figure 166: Eastern Europe Market Y-o-Y Growth (%) Projections by Material, 2024 to 2034

Figure 167: Eastern Europe Market Value (US$ million) Analysis by Sales Channel, 2019 to 2034

Figure 168: Eastern Europe Market Volume (Units) Analysis by Sales Channel, 2019 to 2034

Figure 169: Eastern Europe Market Value Share (%) and BPS Analysis by Sales Channel, 2024 to 2034

Figure 170: Eastern Europe Market Y-o-Y Growth (%) Projections by Sales Channel, 2024 to 2034

Figure 171: Eastern Europe Market Value (US$ million) Analysis by End Use, 2019 to 2034

Figure 172: Eastern Europe Market Volume (Units) Analysis by End Use, 2019 to 2034

Figure 173: Eastern Europe Market Value Share (%) and BPS Analysis by End Use, 2024 to 2034

Figure 174: Eastern Europe Market Y-o-Y Growth (%) Projections by End Use, 2024 to 2034

Figure 175: Eastern Europe Market Attractiveness by Conveyor Types, 2024 to 2034

Figure 176: Eastern Europe Market Attractiveness by Capacity, 2024 to 2034

Figure 177: Eastern Europe Market Attractiveness by Material, 2024 to 2034

Figure 178: Eastern Europe Market Attractiveness by Sales Channel, 2024 to 2034

Figure 179: Eastern Europe Market Attractiveness by End Use, 2024 to 2034

Figure 180: Eastern Europe Market Attractiveness by Country, 2024 to 2034

Figure 181: East Asia Market Value (US$ million) by Conveyor Types, 2024 to 2034

Figure 182: East Asia Market Value (US$ million) by Capacity, 2024 to 2034

Figure 183: East Asia Market Value (US$ million) by Material, 2024 to 2034

Figure 184: East Asia Market Value (US$ million) by Sales Channel, 2024 to 2034

Figure 185: East Asia Market Value (US$ million) by End Use, 2024 to 2034

Figure 186: East Asia Market Value (US$ million) by Country, 2024 to 2034

Figure 187: East Asia Market Value (US$ million) Analysis by Country, 2019 to 2034

Figure 188: East Asia Market Volume (Units) Analysis by Country, 2019 to 2034

Figure 189: East Asia Market Value Share (%) and BPS Analysis by Country, 2024 to 2034

Figure 190: East Asia Market Y-o-Y Growth (%) Projections by Country, 2024 to 2034

Figure 191: East Asia Market Value (US$ million) Analysis by Conveyor Types, 2019 to 2034

Figure 192: East Asia Market Volume (Units) Analysis by Conveyor Types, 2019 to 2034

Figure 193: East Asia Market Value Share (%) and BPS Analysis by Conveyor Types, 2024 to 2034

Figure 194: East Asia Market Y-o-Y Growth (%) Projections by Conveyor Types, 2024 to 2034

Figure 195: East Asia Market Value (US$ million) Analysis by Capacity, 2019 to 2034

Figure 196: East Asia Market Volume (Units) Analysis by Capacity, 2019 to 2034

Figure 197: East Asia Market Value Share (%) and BPS Analysis by Capacity, 2024 to 2034

Figure 198: East Asia Market Y-o-Y Growth (%) Projections by Capacity, 2024 to 2034

Figure 199: East Asia Market Value (US$ million) Analysis by Material, 2019 to 2034

Figure 200: East Asia Market Volume (Units) Analysis by Material, 2019 to 2034

Figure 201: East Asia Market Value Share (%) and BPS Analysis by Material, 2024 to 2034

Figure 202: East Asia Market Y-o-Y Growth (%) Projections by Material, 2024 to 2034

Figure 203: East Asia Market Value (US$ million) Analysis by Sales Channel, 2019 to 2034

Figure 204: East Asia Market Volume (Units) Analysis by Sales Channel, 2019 to 2034

Figure 205: East Asia Market Value Share (%) and BPS Analysis by Sales Channel, 2024 to 2034

Figure 206: East Asia Market Y-o-Y Growth (%) Projections by Sales Channel, 2024 to 2034

Figure 207: East Asia Market Value (US$ million) Analysis by End Use, 2019 to 2034

Figure 208: East Asia Market Volume (Units) Analysis by End Use, 2019 to 2034

Figure 209: East Asia Market Value Share (%) and BPS Analysis by End Use, 2024 to 2034

Figure 210: East Asia Market Y-o-Y Growth (%) Projections by End Use, 2024 to 2034

Figure 211: East Asia Market Attractiveness by Conveyor Types, 2024 to 2034

Figure 212: East Asia Market Attractiveness by Capacity, 2024 to 2034

Figure 213: East Asia Market Attractiveness by Material, 2024 to 2034

Figure 214: East Asia Market Attractiveness by Sales Channel, 2024 to 2034

Figure 215: East Asia Market Attractiveness by End Use, 2024 to 2034

Figure 216: East Asia Market Attractiveness by Country, 2024 to 2034

Figure 217: South Asia Pacific Market Value (US$ million) by Conveyor Types, 2024 to 2034

Figure 218: South Asia Pacific Market Value (US$ million) by Capacity, 2024 to 2034

Figure 219: South Asia Pacific Market Value (US$ million) by Material, 2024 to 2034

Figure 220: South Asia Pacific Market Value (US$ million) by Sales Channel, 2024 to 2034

Figure 221: South Asia Pacific Market Value (US$ million) by End Use, 2024 to 2034

Figure 222: South Asia Pacific Market Value (US$ million) by Country, 2024 to 2034

Figure 223: South Asia Pacific Market Value (US$ million) Analysis by Country, 2019 to 2034

Figure 224: South Asia Pacific Market Volume (Units) Analysis by Country, 2019 to 2034

Figure 225: South Asia Pacific Market Value Share (%) and BPS Analysis by Country, 2024 to 2034

Figure 226: South Asia Pacific Market Y-o-Y Growth (%) Projections by Country, 2024 to 2034

Figure 227: South Asia Pacific Market Value (US$ million) Analysis by Conveyor Types, 2019 to 2034

Figure 228: South Asia Pacific Market Volume (Units) Analysis by Conveyor Types, 2019 to 2034

Figure 229: South Asia Pacific Market Value Share (%) and BPS Analysis by Conveyor Types, 2024 to 2034

Figure 230: South Asia Pacific Market Y-o-Y Growth (%) Projections by Conveyor Types, 2024 to 2034

Figure 231: South Asia Pacific Market Value (US$ million) Analysis by Capacity, 2019 to 2034

Figure 232: South Asia Pacific Market Volume (Units) Analysis by Capacity, 2019 to 2034

Figure 233: South Asia Pacific Market Value Share (%) and BPS Analysis by Capacity, 2024 to 2034

Figure 234: South Asia Pacific Market Y-o-Y Growth (%) Projections by Capacity, 2024 to 2034

Figure 235: South Asia Pacific Market Value (US$ million) Analysis by Material, 2019 to 2034

Figure 236: South Asia Pacific Market Volume (Units) Analysis by Material, 2019 to 2034

Figure 237: South Asia Pacific Market Value Share (%) and BPS Analysis by Material, 2024 to 2034

Figure 238: South Asia Pacific Market Y-o-Y Growth (%) Projections by Material, 2024 to 2034

Figure 239: South Asia Pacific Market Value (US$ million) Analysis by Sales Channel, 2019 to 2034

Figure 240: South Asia Pacific Market Volume (Units) Analysis by Sales Channel, 2019 to 2034

Figure 241: South Asia Pacific Market Value Share (%) and BPS Analysis by Sales Channel, 2024 to 2034

Figure 242: South Asia Pacific Market Y-o-Y Growth (%) Projections by Sales Channel, 2024 to 2034

Figure 243: South Asia Pacific Market Value (US$ million) Analysis by End Use, 2019 to 2034

Figure 244: South Asia Pacific Market Volume (Units) Analysis by End Use, 2019 to 2034

Figure 245: South Asia Pacific Market Value Share (%) and BPS Analysis by End Use, 2024 to 2034

Figure 246: South Asia Pacific Market Y-o-Y Growth (%) Projections by End Use, 2024 to 2034

Figure 247: South Asia Pacific Market Attractiveness by Conveyor Types, 2024 to 2034

Figure 248: South Asia Pacific Market Attractiveness by Capacity, 2024 to 2034

Figure 249: South Asia Pacific Market Attractiveness by Material, 2024 to 2034

Figure 250: South Asia Pacific Market Attractiveness by Sales Channel, 2024 to 2034

Figure 251: South Asia Pacific Market Attractiveness by End Use, 2024 to 2034

Figure 252: South Asia Pacific Market Attractiveness by Country, 2024 to 2034

Figure 253: Middle East and Africa Market Value (US$ million) by Conveyor Types, 2024 to 2034

Figure 254: Middle East and Africa Market Value (US$ million) by Capacity, 2024 to 2034

Figure 255: Middle East and Africa Market Value (US$ million) by Material, 2024 to 2034

Figure 256: Middle East and Africa Market Value (US$ million) by Sales Channel, 2024 to 2034

Figure 257: Middle East and Africa Market Value (US$ million) by End Use, 2024 to 2034

Figure 258: Middle East and Africa Market Value (US$ million) by Country, 2024 to 2034

Figure 259: Middle East and Africa Market Value (US$ million) Analysis by Country, 2019 to 2034

Figure 260: Middle East and Africa Market Volume (Units) Analysis by Country, 2019 to 2034

Figure 261: Middle East and Africa Market Value Share (%) and BPS Analysis by Country, 2024 to 2034

Figure 262: Middle East and Africa Market Y-o-Y Growth (%) Projections by Country, 2024 to 2034

Figure 263: Middle East and Africa Market Value (US$ million) Analysis by Conveyor Types, 2019 to 2034

Figure 264: Middle East and Africa Market Volume (Units) Analysis by Conveyor Types, 2019 to 2034

Figure 265: Middle East and Africa Market Value Share (%) and BPS Analysis by Conveyor Types, 2024 to 2034

Figure 266: Middle East and Africa Market Y-o-Y Growth (%) Projections by Conveyor Types, 2024 to 2034

Figure 267: Middle East and Africa Market Value (US$ million) Analysis by Capacity, 2019 to 2034

Figure 268: Middle East and Africa Market Volume (Units) Analysis by Capacity, 2019 to 2034

Figure 269: Middle East and Africa Market Value Share (%) and BPS Analysis by Capacity, 2024 to 2034

Figure 270: Middle East and Africa Market Y-o-Y Growth (%) Projections by Capacity, 2024 to 2034

Figure 271: Middle East and Africa Market Value (US$ million) Analysis by Material, 2019 to 2034

Figure 272: Middle East and Africa Market Volume (Units) Analysis by Material, 2019 to 2034

Figure 273: Middle East and Africa Market Value Share (%) and BPS Analysis by Material, 2024 to 2034

Figure 274: Middle East and Africa Market Y-o-Y Growth (%) Projections by Material, 2024 to 2034

Figure 275: Middle East and Africa Market Value (US$ million) Analysis by Sales Channel, 2019 to 2034

Figure 276: Middle East and Africa Market Volume (Units) Analysis by Sales Channel, 2019 to 2034

Figure 277: Middle East and Africa Market Value Share (%) and BPS Analysis by Sales Channel, 2024 to 2034

Figure 278: Middle East and Africa Market Y-o-Y Growth (%) Projections by Sales Channel, 2024 to 2034

Figure 279: Middle East and Africa Market Value (US$ million) Analysis by End Use, 2019 to 2034

Figure 280: Middle East and Africa Market Volume (Units) Analysis by End Use, 2019 to 2034

Figure 281: Middle East and Africa Market Value Share (%) and BPS Analysis by End Use, 2024 to 2034

Figure 282: Middle East and Africa Market Y-o-Y Growth (%) Projections by End Use, 2024 to 2034

Figure 283: Middle East and Africa Market Attractiveness by Conveyor Types, 2024 to 2034

Figure 284: Middle East and Africa Market Attractiveness by Capacity, 2024 to 2034

Figure 285: Middle East and Africa Market Attractiveness by Material, 2024 to 2034

Figure 286: Middle East and Africa Market Attractiveness by Sales Channel, 2024 to 2034

Figure 287: Middle East and Africa Market Attractiveness by End Use, 2024 to 2034

Figure 288: Middle East and Africa Market Attractiveness by Country, 2024 to 2034

Frequently Asked Questions

What was the value of the gravity conveyor system market in 2023?

The global market was valued at USD 460.6 million in 2023.

How big is the gravity conveyor system market?

The global market is set to reach USD 484.5 million in 2024.

At what rate will the global demand rise through 2034?

Global gravity conveyor system demand is anticipated to rise at 5.2% CAGR.

What is the expected gravity conveyor system market size in 2034?

The global gravity conveyor system market is set to reach USD 804.4 million by 2034.

Which end-use segment is expected to lead the market?

Industrial machinery is expected to lead the market during the forecast period.

Who are the top 5 conveyor manufacturers?

Bando Chemical Industries, Ltd., Fenner, Intralox, Fives, and Volta Belting Technology Ltd.

What is the trend in the conveyor industry?

Robotic system integration is a key trend.

What is a gravity conveyor used for?

It is used to move loose materials, boxes, and packages from one place to another.

What is the future scope of conveyor system?

The market is anticipated to witness demand in the e-commerce industry.

Explore Similar Insights

Future Market Insights

Gravity Conveyor System Market