The global gluten-free bakery premix market is valued at USD 611.1 million in 2025 and is slated to reach USD 1,585.7 million by 2035, reflecting a CAGR of 10%. Factors driving this growth include the increasing prevalence of celiac disease, the rising demand for allergen-free food options, and evolving consumer preferences for convenient baking solutions.
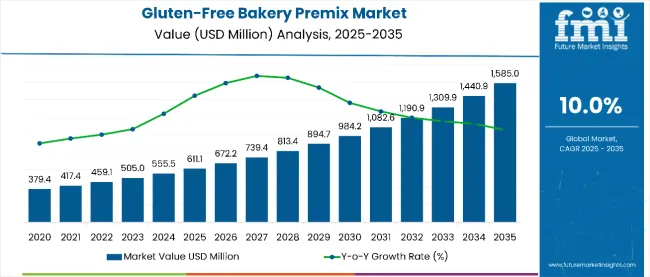
| Metric | Value |
|---|---|
| Market Size (2025) | USD 611.1 million |
| Market Size (2035) | USD 1,585.7 million |
| CAGR (2025 to 2035) | 10% |
The demand is supported by innovation in texture and formulation, enabling gluten-free products to replicate the taste of conventional bakery goods better.
In 2025, the USA is expected to hold the largest share in the market, with a CAGR of 9.5%, supported by a well-established bakery industry and rising gluten intolerance cases. Germany is projected to grow at a CAGR of 8.2%, driven by increasing demand for clean-label and allergen-free baked goods among millennials.
France is also expected to experience steady growth, with a CAGR of 7.9%, driven by increasing consumer interest in gluten-free patisserie and artisanal products. The bakery segment is poised to lead the application market with a 42.8% market share, while direct sales are expected to dominate the distribution channel segment with a 58% share in 2025.
The market has witnessed notable innovations aimed at improving product quality and consumer appeal. Rudi’s introduced 15 new organic and gluten-free products featuring a novel fermenting technique and enhanced packaging. Feel Good Foods launched gluten-free square pan pizzas with convenient baking trays.
Hy-Vee debuted its "Good Graces" private label offering over 30 gluten-free items. Additionally, Veripan developed a breakthrough all-purpose gluten-free flour mix that enhances texture and consistency. These innovations reflect a growing focus on clean labels, improved taste, and convenience. These are key factors driving consumer preference in the evolving gluten-free bakery premix segment.
The market holds a niche yet growing share across its parent markets. It accounts for approximately 12% of the overall gluten-free food market, reflecting rising demand for allergen-free bakery options. Within the bakery premix market, it commands a 9% share, driven by the surge in ready-to-bake gluten-free products.
Its share in the broader health & wellness food market and the functional food segment remains modest, at around 4-5%. In contrast, its penetration in the clean label and ready-to-cook food categories is estimated at 6-7%. These figures indicate an increase.
The market segments include application, product type, distribution channel, and region. The application segment encompasses bakery, confectionery, restaurant, and household sectors. The product type segment includes bread, muffins, cakes, hamburgers, pizza bases, and other product types.
The distribution channel segment comprises direct sales and indirect sales. The regional segment includes North America, Latin America, Western Europe, Eastern Europe, South Asia & Pacific, East Asia, and the Middle East & Africa.
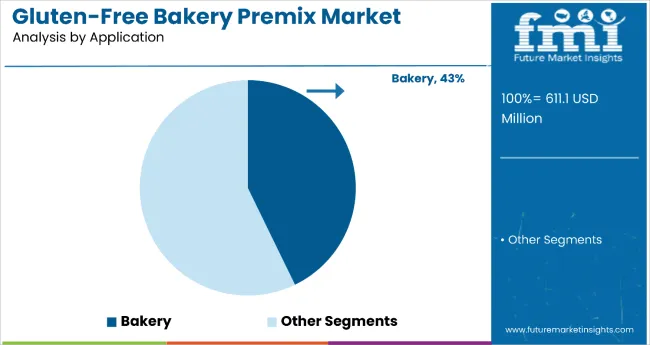
The bakery segment is the most lucrative application in the market, accounting for approximately 42.8% of the market share in 2025. This dominance is driven by the high global consumption of gluten-free baked goods, particularly bread, muffins, and cakes.
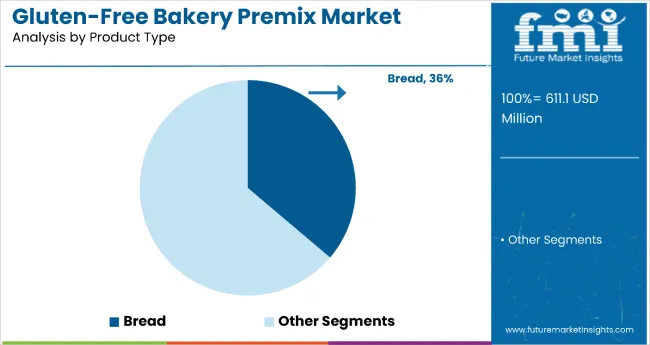
The bread segment is projected to remain the most lucrative product type in the market in 2025, accounting for 36.2% of total market share.
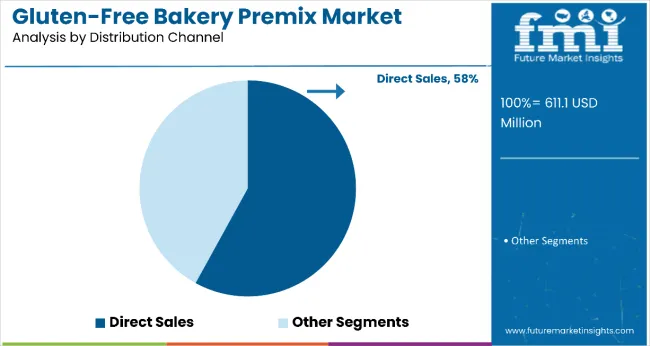
The direct sales segment is projected to be the most lucrative distribution channel in the market, accounting for 58% of the market share in 2025.
The gluten-free bakery premix market is growing steadily, driven by rising consumer awareness of gluten intolerance and celiac disease, increasing demand for allergen-free and health-focused foods, and the growing popularity of convenient, high-quality baking solutions.
Recent Trends in the Gluten-free Bakery Premix Market
Key Challenges in the Gluten-free Bakery Premix Market
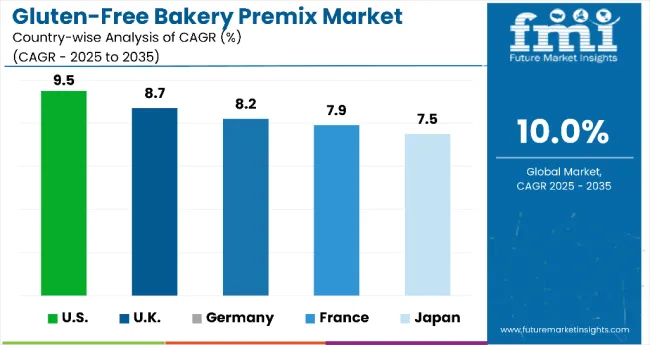
Among the top five countries, the USA is projected to experience the fastest growth in the gluten-free bakery premix market, with a CAGR of 9.5% from 2025 to 2035, driven by high rates of gluten sensitivity and a mature bakery industry. The UK follows with an 8.7% CAGR, supported by strong vegan and allergen-free trends.
Germany (8.2%) and France (7.9%) are experiencing growth due to increasing demand for clean labels and the expansion of artisanal bakeries. Japan, while growing at a slower 7.5% CAGR, remains a key market due to rising health consciousness and the expansion of gluten-free Western-style bakery formats.
The report provides an in-depth analysis of over 40 countries, with the five top-performing OECD countries highlighted below.
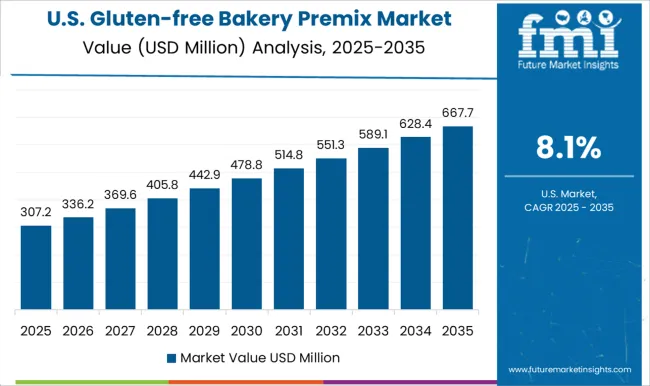
The USA gluten-free bakery premix market is expected to expand at a CAGR of 9.5% from 2025 to 2035. The country remains the largest consumer of gluten-free bakery premixes due to rising cases of gluten intolerance and a highly developed bakery sector.
Sales of gluten-free bakery premix products in the UK are anticipated to grow at a CAGR of 8.7% between 2025 and 2035.
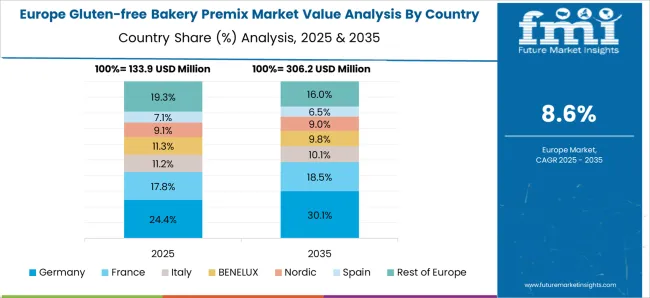
Germany’s gluten-free bakery premix products revenue is set to grow at a CAGR of 8.2% through 2035. Rising health awareness and a large base of health-focused consumers have increased demand for gluten-free bakery products.
France’s gluten-free bakery premix products revenue is projected to register a CAGR of 7.9% between 2025 and 2035.
Japan’s gluten-free bakery premix products demand is forecast to grow at a CAGR of 7.5% during the forecast period.
The market is moderately fragmented, with a mix of established players and regional specialists competing through innovation, clean-label offerings, and distribution partnerships. Companies focus on offering improved formulations, expanding product portfolios, and strengthening distribution networks to stay competitive in the evolving allergen-free baking segment.
Top players, such as Lesaffre, Bakels Group, and Watson Inc., are leading the way through research and development, clean-label innovation, and strategic acquisitions. These companies prioritize catering to evolving consumer demands, particularly for natural, organic, and gluten-free bakery solutions. Strategies include enhancing ingredient functionality, improving shelf life and taste profiles, and collaborating with artisan and commercial bakeries.
Recent Gluten-Free Bakery Premix Industry News
| Report Attributes | Details |
|---|---|
| Current Total Market Size (2025) | USD 611.1 million |
| Projected Market Size (2035) | USD 1,585.7 million |
| CAGR (2025 to 2035) | 10% |
| Base Year for Estimation | 2024 |
| Historical Period | 2020 to 2024 |
| Projections Period | 2025 to 2035 |
| Market Analysis Parameters | Revenue in USD million/Volume (Metric Tons) |
| By Application | Bakery, Confectionery, Restaurant, Household |
| By Product Type | Bread, Muffins, Cakes, Hamburgers, Pizza Bases, Other Product Types |
| By Distribution Channel | Direct Sales and Indirect Sales |
| Regions Covered | North America, Latin America, Western Europe, Eastern Europe, East Asia, South Asia & Pacific, Middle East & Africa |
| Countries Covered | United States, Canada, United Kingdom, Germany, France, China, Japan, South Korea, Brazil, Australia, and 40+ countries |
| Key Players | Myosyn Industries Pty Ltd, Melinda’s Gluten-Free Goodies, Choices Gluten-free, Lesaffre, Naturally Organic, Theodor Rietmann GmbH, Caremoli SPA, Bakels Group, Watson Inc., DeutscheBack GmbH & Co. KG, and Baking Technical Advice Pty Ltd. |
| Additional Attributes | Dollar sales by value, market share analysis by region, and country-wise analysis. |
The global gluten-free bakery premix market is estimated to be valued at USD 611.1 million in 2025.
The market size for the gluten-free bakery premix market is projected to reach USD 1,514.4 million by 2035.
The gluten-free bakery premix market is expected to grow at a 9.5% CAGR between 2025 and 2035.
The key product types in gluten-free bakery premix market are bakery, confectionery, restaurant and household.
In terms of product type, bread segment to command 28.4% share in the gluten-free bakery premix market in 2025.


Our Research Products

The "Full Research Suite" delivers actionable market intel, deep dives on markets or technologies, so clients act faster, cut risk, and unlock growth.

The Leaderboard benchmarks and ranks top vendors, classifying them as Established Leaders, Leading Challengers, or Disruptors & Challengers.

Locates where complements amplify value and substitutes erode it, forecasting net impact by horizon

We deliver granular, decision-grade intel: market sizing, 5-year forecasts, pricing, adoption, usage, revenue, and operational KPIs—plus competitor tracking, regulation, and value chains—across 60 countries broadly.

Spot the shifts before they hit your P&L. We track inflection points, adoption curves, pricing moves, and ecosystem plays to show where demand is heading, why it is changing, and what to do next across high-growth markets and disruptive tech

Real-time reads of user behavior. We track shifting priorities, perceptions of today’s and next-gen services, and provider experience, then pace how fast tech moves from trial to adoption, blending buyer, consumer, and channel inputs with social signals (#WhySwitch, #UX).

Partner with our analyst team to build a custom report designed around your business priorities. From analysing market trends to assessing competitors or crafting bespoke datasets, we tailor insights to your needs.
Supplier Intelligence
Discovery & Profiling
Capacity & Footprint
Performance & Risk
Compliance & Governance
Commercial Readiness
Who Supplies Whom
Scorecards & Shortlists
Playbooks & Docs
Category Intelligence
Definition & Scope
Demand & Use Cases
Cost Drivers
Market Structure
Supply Chain Map
Trade & Policy
Operating Norms
Deliverables
Buyer Intelligence
Account Basics
Spend & Scope
Procurement Model
Vendor Requirements
Terms & Policies
Entry Strategy
Pain Points & Triggers
Outputs
Pricing Analysis
Benchmarks
Trends
Should-Cost
Indexation
Landed Cost
Commercial Terms
Deliverables
Brand Analysis
Positioning & Value Prop
Share & Presence
Customer Evidence
Go-to-Market
Digital & Reputation
Compliance & Trust
KPIs & Gaps
Outputs
Full Research Suite comprises of:
Market outlook & trends analysis
Interviews & case studies
Strategic recommendations
Vendor profiles & capabilities analysis
5-year forecasts
8 regions and 60+ country-level data splits
Market segment data splits
12 months of continuous data updates
DELIVERED AS:
PDF EXCEL ONLINE
Bakery Stabilizers Market Size and Share Forecast Outlook 2025 to 2035
Bakery Ingredients Market Analysis - Size, Share, & Forecast Outlook 2025 to 2035
Bakery Packaging Machine Market Size and Share Forecast Outlook 2025 to 2035
Bakery Mixes Market Analysis - Size, Share, & Forecast Outlook 2025 to 2035
Bakery Product Market Analysis - Size, Share, and Forecast Outlook 2025 to 2035
Bakery Enzymes Market Analysis - Size, Share, and Forecast Outlook 2025 to 2035
Bakery Emulsions Market Analysis - Size, Share, and Forecast Outlook 2025 to 2035
Bakery Cases Market Analysis – Trends, Growth & Forecast 2025 to 2035
Bakery Processing Equipment Market Analysis by Product Type, End User, Application & Region: A Forecast for 2025 and 2035
Competitive Breakdown of Bakery Mixes Suppliers
Bakery Meal Market – Growth, Demand & Nutritional Applications
Bakery Fat Market – Demand, Innovations & Market Expansion
Bakery Flexible Packaging Market
Bakery Improvers Market
Bakery Conditioner Market
United Kingdom Bakery Ingredients Market Outlook – Size, Demand & Forecast 2025–2035
United Kingdom Bakery Mixes Market Insights – Growth, Demand & Forecast 2025–2035
United States Bakery Ingredients Market Outlook – Demand, Size & Forecast 2025–2035
ASEAN Bakery Mixes Market Outlook – Size, Share & Forecast 2025–2035
ASEAN Bakery Ingredient Market Trends – Growth, Demand & Forecast 2025–2035

Thank you!
You will receive an email from our Business Development Manager. Please be sure to check your SPAM/JUNK folder too.
Chat With
MaRIA