The global gluconolactone market is projected to grow steadily over the next decade, driven by rising demand across a variety of industries including food and beverages, pharmaceuticals, personal care, and cosmetics. Gluconolactone, also known as glucono delta-lactone (GDL), is valued for its multifunctional properties such as its ability to act as a food additive, pH regulator, stabilizer, and sequestrate. It is widely used as a coagulant in tofu production, a preservative in bakery products, and a key ingredient in skincare formulations due to its mild exfoliating and moisturizing effects.
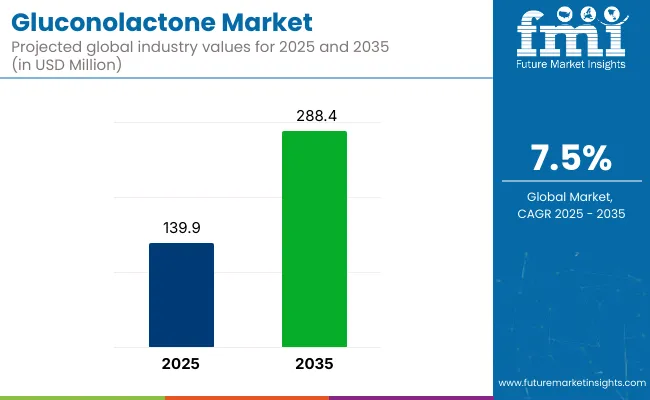
As consumers increasingly seek clean-label, naturally derived, and multifunctional ingredients, the market for gluconolactone continues to expand. Moreover, ongoing innovations in product formulations and growing applications in emerging markets are expected to drive consistent growth through 2035. In 2025, the global gluconolactone market is estimated to be valued at approximately USD 139.9 Million. By 2035, it is projected to grow to around USD 288.4 Million, reflecting a compound annual growth rate (CAGR) of 7.5%.
Gluconolactone is also used in various food and beverage applications in North America, and increasing participation for clean-label and natural elements in this region is further propelling the demand for gluconolactone in North America. Increasing consumption shape in baked goods, dairy products & cosmetics formulations are leading the growth in North America, especially in USA.
Europe is another key market well-known for a mature food processing industry, strict food additives regulations, and high consumer demand for premium natural ingredients. Germany, France, and the United Kingdom are leading the charge of gluconolactone usage primarily in bakery, confectionery, and cosmetic items.
Asia-Pacific is the fastest growing market for gluconolactone, driven by rapid industrialization, increasing disposable income of the population and increasing demand for natural and functional ingredients. Regions such as China, Japan, and India have seen an increased production of gluconolactone in tofu, personal care products, and health supplements. It is expected to see significant growth due to the growing middle-class population and awareness of natural alternatives.
Challenges
High Production Costs, Limited Consumer Awareness, and Regulatory Restrictions
High production costs are expected to hamper the demand for Gluconolactone Market since gluconolactone production is done by two methods, fermentation-based and synthetic. Gluconolactone is relatively expensive to manufacture in contrast to other preservatives and exfoliates, as it depends on high-purity raw materials like glucose and requires enzymatic catalysts.
Another challenge is limited consumer awareness, meaning fewer end-users are aware that they can take advantage of gluconolactone’s benefits in skincare, food preservation and pharmaceuticals, making it longer to drive market entry. Moreover, strict regulatory restrictions, especially in cosmetics and food formulations, require obtaining FDA, EFSA, and REACH safety regulations, such as non-GMO source, allergen-free label, and testing pH stability, etc.
Opportunities
Growth in Clean Beauty, Functional Food Applications, and AI-Powered Formulation Innovations
Despite these challenges, the gluconolactone market is projected to grow at a healthy rate due to rising demand for clean label beauty products, functional food preservation, and enhancements in AI for formulation. Moving towards eliminating paraben and sulfate in personal care formulation is driving the demand of gluconolactone as a gentle exfoliator which is categorized as polyhydroxy acid (PHA) with anti-age benefits.
Moreover, gluconolactone is gaining popularity as a natural preservative, as well as pH regulator and coagulant in dairy and meat products, which is further propelling market growth. AI-powered ingredient optimization and predictive formulation analytics are further improving product stability, efficacy, and regulatory compliance, unlocking newer applications in pharmaceuticals and nutraceuticals.
Market Shift | 2020 to 2024 Trends |
---|---|
Regulatory Landscape | Compliance with FDA, EFSA, REACH, and COSMOS organic certification for skincare and food applications. |
Consumer Trends | Demand for clean-label preservatives, mild exfoliants, and non-toxic skincare formulations. |
Industry Adoption | High use in cosmetics (PHA exfoliants), food additives (pH regulators), and pharmaceuticals (oral care products). |
Supply Chain and Sourcing | Dependence on glucose fermentation, natural sources, and bio-based production techniques. |
Market Competition | Dominated by cosmetic ingredient suppliers, food additive manufacturers, and pharmaceutical firms. |
Market Growth Drivers | Growth fueled by clean beauty demand, functional food expansion, and sustainable preservatives. |
Sustainability and Environmental Impact | Moderate adoption of biodegradable packaging and low-carbon footprint manufacturing. |
Integration of Smart Technologies | Early adoption of AI-assisted ingredient stability analysis, predictive skin compatibility testing, and automated quality control. |
Advancements in Bio-Based Chemistry | Development of high-purity gluconolactone for multi-functional applications in cosmetics and food. |
Market Shift | 2025 to 2035 Projections |
---|---|
Regulatory Landscape | Stricter AI-powered ingredient safety tracking, carbon-neutral production mandates, and sustainable formulation guidelines. |
Consumer Trends | Growth in AI-driven personalized skincare, biotech-based functional foods, and dermatology-backed cosmeceuticals. |
Industry Adoption | Expansion into AI-assisted skincare formulation, smart food preservation technology, and sustainable nutraceutical blends. |
Supply Chain and Sourcing | Shift toward synthetic biology-based gluconolactone production, AI-powered supply chain monitoring, and circular economy ingredient sourcing. |
Market Competition | Entry of AI-powered skincare tech firms, biotech-based ingredient developers, and green chemistry formulation startups. |
Market Growth Drivers | Accelerated by AI-driven ingredient personalization, probiotic-based skincare, and zero-waste food preservation innovations. |
Sustainability and Environmental Impact | Large-scale shift toward carbon-neutral ingredient processing, AI-optimized waste reduction, and regenerative agriculture-based sourcing. |
Integration of Smart Technologies | Expansion into AI-powered dermatological research, real-time food spoilage detection, and blockchain-based ingredient traceability. |
Advancements in Bio-Based Chemistry | Evolution toward AI-optimized skincare formulations, next-gen bioactive ingredient delivery systems, and microbiome-friendly preservatives. |
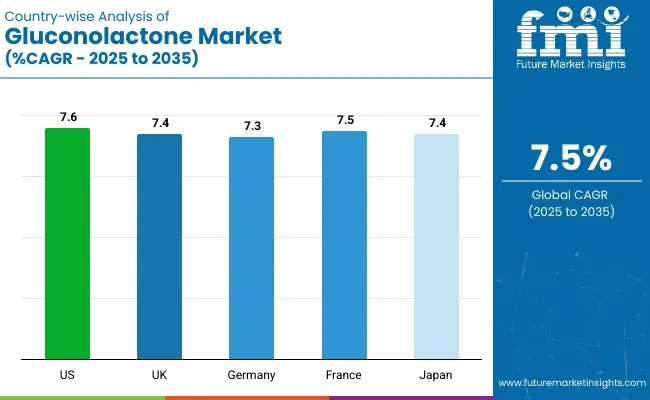
The Gluconolactone market in the USA is witnessing steady growth, driven by increasing demand in skincare, food preservatives, and pharmaceutical applications. The rising popularity of gluconolactone as an anti-aging and exfoliating ingredient in cosmetics is fueling market expansion. Additionally, the growth of clean-label and natural preservatives in the food and beverage industry is further supporting industry demand.
Country | CAGR (2025 to 2035) |
---|---|
USA | 7.6% |
The United Kingdom gluconolactone market is also growing as a result of increasing demand among consumers for natural formulations in skin care, as well as for food preservatives in organic foods. Growing demand for gluconolactone in personal care products, functional food, and dietary supplements is fueling growth. Stringent regulations supporting the use of non-toxic and biodegradable food additives are also influencing market trends.
Country | CAGR (2025 to 2035) |
---|---|
UK | 7.4% |
The gluconolactone market in the European Union is experiencing a steady rise as industries make a shift towards clean-label and naturally derived constituents. Increasing adoption of gluconolactone in cosmetics formulations, pharmaceutical, and processed food is propelling the demand. Moreover, growing EU regulations supporting the introduction of bio-based preservatives and non-GMO preservatives are also contributing to the growth of the market.
Region | CAGR (2025 to 2035) |
---|---|
European Union (EU) | 7.5% |
The Japan gluconolactone market is growing moderately and is supported by the strong demand from the beauty and personal care industry, wider acceptance in anti-aging skincare products and potential use in traditional fermented foods. Increasing utilization of polyhydroxyacs (PHAs) in cosmetic formulations is propelling the demand from market. Moreover, supporting government regulations for functional and nutraceutical food additives together with emerging market trends are further aiding in the growth of this market.
Country | CAGR (2025 to 2035) |
---|---|
Japan | 7.4% |
South Korea gluconolactone market is driven due to increasing demand in K-beauty cosmetics, food preservation, and pharmaceutical applications. Increasing consumption of organic and clean beauty products is driving demand for gluconolactone-based skincare solutions. Furthermore, government initiatives for promoting innovation in functional food ingredients is also propelling market growth.
Country | CAGR (2025 to 2035) |
---|---|
South Korea | 7.6% |
Growing interest in natural, multifunctional ingredients in food, pharmaceuticals, cosmetics, and personal care applications has significantly propelled the gluconolactone market. Gluconolactone is a naturally occurring lactone formed from gluconic acid which works as a preservative, acidity regulator, chelating agent and exfoliate, thus it is well used in food processing, skincare formulations and medical applications.
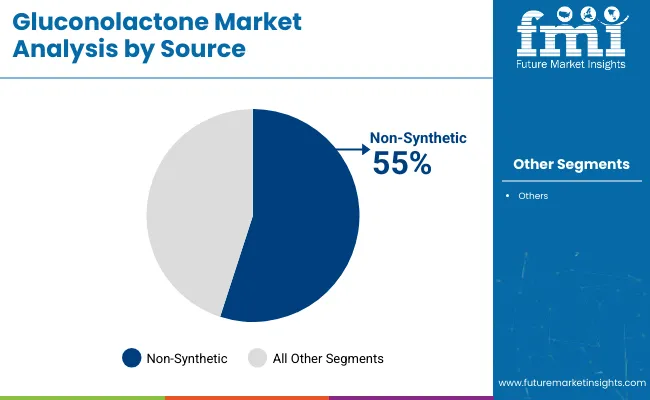
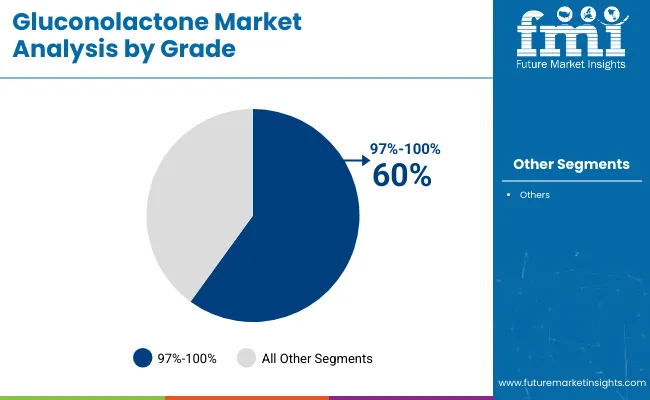
As consumers increasingly gravitate towards clean-label products and as plant-based and non-synthetic food additives rise in popularity and usage, it is likely that manufacturers will focus on sustainable sourcing and high-purity formulations for gluconolactone to cater to end-users. The market is divided by Source (Synthetic, Non-Synthetic) and Grade (97%-100%, 100%-102%).
In addition to that, non-synthetic segment account for the major market share due to rise in demand for naturally derived food ingredients and preservatives, as well as chemically active cosmetic ingredients among the consumers and industries. Non-synthetic is made from the natural fermentation of microbial or agricultural sources, offering superior bioavailability and clean-pretty label ingredients.
Succumbing to the surging demand for organic and plant-derived food additives as well as rising consciousness about clean beauty trends and strict regulatory restrictions on synthetic preservatives, manufacturers are focusing on fermentation-based and non-GMO gluconolactone solutions. The growing uptake of natural gluconolactone for use in functional beverages, dairy items, and high-end beauty products is additionally anticipated to drive the market in this place.
Demand in the synthetic segment is also emerging, especially in industrial applications, and pharmaceutical formulations, as well as the food processing sector for cost-sensitive applications. Synthetic gluconolactone processes guarantee uniformity, tighter control of production specifications, and is also a more economical option for high-volume applications that need a standardized chemical characteristics.
Steady demand for synthetic-grade gluconolactone in targeted industrial applications stems from various key factors including advancements in analytical procedures to synthesize lab-synthesized, food-grade acids, increasing R&D of synthetic food preservatives, and introduction of chemically stable gluconolactone derivatives that display substantial promise as pharmaceutical excipients.
The 97% to 100% segment accounts for the largest share in the gluconolactone market, as this purity range is predominantly used in food additives, dairy products, meat curing agents, and cosmetic formulations. It facilitates optimum performance in pH stabilization, chelation of metals, and antimicrobial activity, thus is the most preferred material among food manufacturers, cosmetic formulators and pharmaceutical companies.
As manufacturers are making the most out of the natural food acids and rising demand for shelf-life-extending preservatives and application to a significant extent in plant-based dairy alternatives, they are developing high-quality, 97%-100% purity gluconolactone with better and improved stability and performance characteristics.
Pharmaceutical-grade applications, specialty dermatological goods, and high-precision industrial formulations are all driving demand in the 100%-102% sector. Grade B provides higher purity, enhanced solubility, and increased efficacy in medical, biomedical, and pharmaceutical excipient applications.
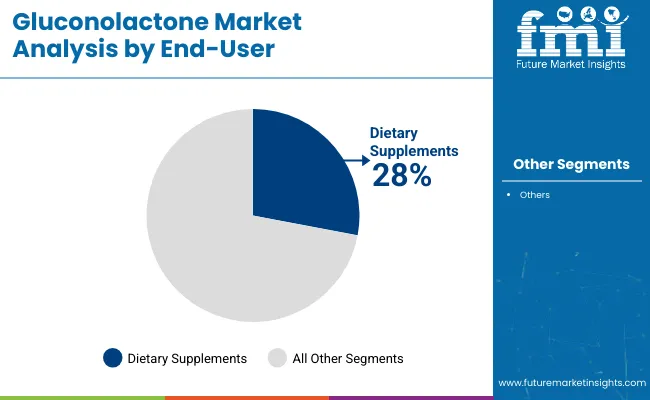
Increasing investments in high-purity pharmaceutical-grade ingredients and use of gluconolactone in dermatological treatments, expansion of ultra-pure food processing additives demand will spur specialty markets for 100% - 102% grade gluconolactone.
The gluconolactone market is anticipated to make steady progress due to rising demand in cosmetics, pharmaceuticals, food & beverages, and dietary supplements. Its uses as a preservative, pH regulator and antioxidant are promoting its use throughout industries.
Also driving market growth are the increasing demand for natural and clean label ingredients, developments in AI-led production optimization and the push to source more sustainable ingredients. To improve product stability, efficiency, and safety compliance, companies are concentrating on the creation of high-purity gluconolactone, the formulation of products with the help of artificial intelligence, and the use of environmentally friendly production technique.
Market Share Analysis by Key Players & Gluconolactone Manufacturers
Company Name | Estimated Market Share (%) |
---|---|
Jungbunzlauer Suisse AG | 18-22% |
Fuso Chemical Co., Ltd. | 12-16% |
Roquette Frères | 10-14% |
Merck KGaA | 8-12% |
Sigma-Aldrich (Part of Merck Group) | 5-9% |
Other Gluconolactone Suppliers (combined) | 30-40% |
Company Name | Key Offerings/Activities |
---|---|
Jungbunzlauer Suisse AG | Develops AI-optimized high-purity gluconolactone for cosmetics, food preservation, and pharmaceutical formulations. |
Fuso Chemical Co., Ltd. | Specializes in biodegradable gluconolactone, AI-assisted ingredient synthesis, and sustainable fermentation-based production. |
Roquette Frères | Provides plant-based gluconolactone, AI-driven quality control, and non-GMO food-grade gluconolactone solutions. |
Merck KGaA | Focuses on high-purity pharmaceutical-grade gluconolactone, AI-enhanced formulation stability, and research-driven ingredient innovation. |
Sigma-Aldrich (Merck Group) | Offers lab-grade gluconolactone for research and industrial applications, AI-assisted compound analysis, and eco-friendly synthesis. |
Key Market Insights
Jungbunzlauer Suisse AG (18-22%)
Jungbunzlauer leads the gluconolactone market, offering AI-powered fermentation processes, high-purity food and cosmetic-grade formulations, and clean-label ingredient solutions.
Fuso Chemical Co., Ltd. (12-16%)
Fuso specializes in biodegradable and fermentation-derived gluconolactone, ensuring AI-assisted production optimization and eco-friendly ingredient sourcing.
Roquette Frères (10-14%)
Roquette provides non-GMO, plant-based gluconolactone, optimizing AI-enhanced quality control and food safety compliance.
Merck KGaA (8-12%)
Merck focuses on pharmaceutical-grade gluconolactone, integrating AI-powered stability testing and research-driven innovation.
Sigma-Aldrich (Merck Group) (5-9%)
Sigma-Aldrich develops high-purity lab-grade gluconolactone, ensuring AI-enhanced analytical testing and eco-friendly synthesis solutions.
Other Key Players (30-40% Combined)
Several specialty chemical manufacturers, food-grade ingredient suppliers, and cosmetic formulation companies contribute to next-generation gluconolactone innovations, AI-powered production advancements, and sustainable ingredient sourcing. These include:
Table 1: Global Value (US$ Million) Forecast by Region, 2018 to 2033
Table 2: Global Volume (MT) Forecast by Region, 2018 to 2033
Table 3: Global Value (US$ Million) Forecast by Source, 2018 to 2033
Table 4: Global Volume (MT) Forecast by Source, 2018 to 2033
Table 5: Global Value (US$ Million) Forecast by Grade, 2018 to 2033
Table 6: Global Volume (MT) Forecast by Grade, 2018 to 2033
Table 7: Global Value (US$ Million) Forecast by End-Use, 2018 to 2033
Table 8: Global Volume (MT) Forecast by End-Use, 2018 to 2033
Table 9: North America Value (US$ Million) Forecast by Country, 2018 to 2033
Table 10: North America Volume (MT) Forecast by Country, 2018 to 2033
Table 11: North America Value (US$ Million) Forecast by Source, 2018 to 2033
Table 12: North America Volume (MT) Forecast by Source, 2018 to 2033
Table 13: North America Value (US$ Million) Forecast by Grade, 2018 to 2033
Table 14: North America Volume (MT) Forecast by Grade, 2018 to 2033
Table 15: North America Value (US$ Million) Forecast by End-Use, 2018 to 2033
Table 16: North America Volume (MT) Forecast by End-Use, 2018 to 2033
Table 17: Latin America Value (US$ Million) Forecast by Country, 2018 to 2033
Table 18: Latin America Volume (MT) Forecast by Country, 2018 to 2033
Table 19: Latin America Value (US$ Million) Forecast by Source, 2018 to 2033
Table 20: Latin America Volume (MT) Forecast by Source, 2018 to 2033
Table 21: Latin America Value (US$ Million) Forecast by Grade, 2018 to 2033
Table 22: Latin America Volume (MT) Forecast by Grade, 2018 to 2033
Table 23: Latin America Value (US$ Million) Forecast by End-Use, 2018 to 2033
Table 24: Latin America Volume (MT) Forecast by End-Use, 2018 to 2033
Table 25: Western Europe Value (US$ Million) Forecast by Country, 2018 to 2033
Table 26: Western Europe Volume (MT) Forecast by Country, 2018 to 2033
Table 27: Western Europe Value (US$ Million) Forecast by Source, 2018 to 2033
Table 28: Western Europe Volume (MT) Forecast by Source, 2018 to 2033
Table 29: Western Europe Value (US$ Million) Forecast by Grade, 2018 to 2033
Table 30: Western Europe Volume (MT) Forecast by Grade, 2018 to 2033
Table 31: Western Europe Value (US$ Million) Forecast by End-Use, 2018 to 2033
Table 32: Western Europe Volume (MT) Forecast by End-Use, 2018 to 2033
Table 33: Eastern Europe Value (US$ Million) Forecast by Country, 2018 to 2033
Table 34: Eastern Europe Volume (MT) Forecast by Country, 2018 to 2033
Table 35: Eastern Europe Value (US$ Million) Forecast by Source, 2018 to 2033
Table 36: Eastern Europe Volume (MT) Forecast by Source, 2018 to 2033
Table 37: Eastern Europe Value (US$ Million) Forecast by Grade, 2018 to 2033
Table 38: Eastern Europe Volume (MT) Forecast by Grade, 2018 to 2033
Table 39: Eastern Europe Value (US$ Million) Forecast by End-Use, 2018 to 2033
Table 40: Eastern Europe Volume (MT) Forecast by End-Use, 2018 to 2033
Table 41: South Asia and Pacific Value (US$ Million) Forecast by Country, 2018 to 2033
Table 42: South Asia and Pacific Volume (MT) Forecast by Country, 2018 to 2033
Table 43: South Asia and Pacific Value (US$ Million) Forecast by Source, 2018 to 2033
Table 44: South Asia and Pacific Volume (MT) Forecast by Source, 2018 to 2033
Table 45: South Asia and Pacific Value (US$ Million) Forecast by Grade, 2018 to 2033
Table 46: South Asia and Pacific Volume (MT) Forecast by Grade, 2018 to 2033
Table 47: South Asia and Pacific Value (US$ Million) Forecast by End-Use, 2018 to 2033
Table 48: South Asia and Pacific Volume (MT) Forecast by End-Use, 2018 to 2033
Table 49: East Asia Value (US$ Million) Forecast by Country, 2018 to 2033
Table 50: East Asia Volume (MT) Forecast by Country, 2018 to 2033
Table 51: East Asia Value (US$ Million) Forecast by Source, 2018 to 2033
Table 52: East Asia Volume (MT) Forecast by Source, 2018 to 2033
Table 53: East Asia Value (US$ Million) Forecast by Grade, 2018 to 2033
Table 54: East Asia Volume (MT) Forecast by Grade, 2018 to 2033
Table 55: East Asia Value (US$ Million) Forecast by End-Use, 2018 to 2033
Table 56: East Asia Volume (MT) Forecast by End-Use, 2018 to 2033
Table 57: Middle East and Africa Value (US$ Million) Forecast by Country, 2018 to 2033
Table 58: Middle East and Africa Volume (MT) Forecast by Country, 2018 to 2033
Table 59: Middle East and Africa Value (US$ Million) Forecast by Source, 2018 to 2033
Table 60: Middle East and Africa Volume (MT) Forecast by Source, 2018 to 2033
Table 61: Middle East and Africa Value (US$ Million) Forecast by Grade, 2018 to 2033
Table 62: Middle East and Africa Volume (MT) Forecast by Grade, 2018 to 2033
Table 63: Middle East and Africa Value (US$ Million) Forecast by End-Use, 2018 to 2033
Table 64: Middle East and Africa Volume (MT) Forecast by End-Use, 2018 to 2033
Figure 1: Global Value (US$ Million) by Source, 2023 to 2033
Figure 2: Global Value (US$ Million) by Grade, 2023 to 2033
Figure 3: Global Value (US$ Million) by End-Use, 2023 to 2033
Figure 4: Global Value (US$ Million) by Region, 2023 to 2033
Figure 5: Global Value (US$ Million) Analysis by Region, 2018 to 2033
Figure 6: Global Volume (MT) Analysis by Region, 2018 to 2033
Figure 7: Global Value Share (%) and BPS Analysis by Region, 2023 to 2033
Figure 8: Global Y-o-Y Growth (%) Projections by Region, 2023 to 2033
Figure 9: Global Value (US$ Million) Analysis by Source, 2018 to 2033
Figure 10: Global Volume (MT) Analysis by Source, 2018 to 2033
Figure 11: Global Value Share (%) and BPS Analysis by Source, 2023 to 2033
Figure 12: Global Y-o-Y Growth (%) Projections by Source, 2023 to 2033
Figure 13: Global Value (US$ Million) Analysis by Grade, 2018 to 2033
Figure 14: Global Volume (MT) Analysis by Grade, 2018 to 2033
Figure 15: Global Value Share (%) and BPS Analysis by Grade, 2023 to 2033
Figure 16: Global Y-o-Y Growth (%) Projections by Grade, 2023 to 2033
Figure 17: Global Value (US$ Million) Analysis by End-Use, 2018 to 2033
Figure 18: Global Volume (MT) Analysis by End-Use, 2018 to 2033
Figure 19: Global Value Share (%) and BPS Analysis by End-Use, 2023 to 2033
Figure 20: Global Y-o-Y Growth (%) Projections by End-Use, 2023 to 2033
Figure 21: Global Attractiveness by Source, 2023 to 2033
Figure 22: Global Attractiveness by Grade, 2023 to 2033
Figure 23: Global Attractiveness by End-Use, 2023 to 2033
Figure 24: Global Attractiveness by Region, 2023 to 2033
Figure 25: North America Value (US$ Million) by Source, 2023 to 2033
Figure 26: North America Value (US$ Million) by Grade, 2023 to 2033
Figure 27: North America Value (US$ Million) by End-Use, 2023 to 2033
Figure 28: North America Value (US$ Million) by Country, 2023 to 2033
Figure 29: North America Value (US$ Million) Analysis by Country, 2018 to 2033
Figure 30: North America Volume (MT) Analysis by Country, 2018 to 2033
Figure 31: North America Value Share (%) and BPS Analysis by Country, 2023 to 2033
Figure 32: North America Y-o-Y Growth (%) Projections by Country, 2023 to 2033
Figure 33: North America Value (US$ Million) Analysis by Source, 2018 to 2033
Figure 34: North America Volume (MT) Analysis by Source, 2018 to 2033
Figure 35: North America Value Share (%) and BPS Analysis by Source, 2023 to 2033
Figure 36: North America Y-o-Y Growth (%) Projections by Source, 2023 to 2033
Figure 37: North America Value (US$ Million) Analysis by Grade, 2018 to 2033
Figure 38: North America Volume (MT) Analysis by Grade, 2018 to 2033
Figure 39: North America Value Share (%) and BPS Analysis by Grade, 2023 to 2033
Figure 40: North America Y-o-Y Growth (%) Projections by Grade, 2023 to 2033
Figure 41: North America Value (US$ Million) Analysis by End-Use, 2018 to 2033
Figure 42: North America Volume (MT) Analysis by End-Use, 2018 to 2033
Figure 43: North America Value Share (%) and BPS Analysis by End-Use, 2023 to 2033
Figure 44: North America Y-o-Y Growth (%) Projections by End-Use, 2023 to 2033
Figure 45: North America Attractiveness by Source, 2023 to 2033
Figure 46: North America Attractiveness by Grade, 2023 to 2033
Figure 47: North America Attractiveness by End-Use, 2023 to 2033
Figure 48: North America Attractiveness by Country, 2023 to 2033
Figure 49: Latin America Value (US$ Million) by Source, 2023 to 2033
Figure 50: Latin America Value (US$ Million) by Grade, 2023 to 2033
Figure 51: Latin America Value (US$ Million) by End-Use, 2023 to 2033
Figure 52: Latin America Value (US$ Million) by Country, 2023 to 2033
Figure 53: Latin America Value (US$ Million) Analysis by Country, 2018 to 2033
Figure 54: Latin America Volume (MT) Analysis by Country, 2018 to 2033
Figure 55: Latin America Value Share (%) and BPS Analysis by Country, 2023 to 2033
Figure 56: Latin America Y-o-Y Growth (%) Projections by Country, 2023 to 2033
Figure 57: Latin America Value (US$ Million) Analysis by Source, 2018 to 2033
Figure 58: Latin America Volume (MT) Analysis by Source, 2018 to 2033
Figure 59: Latin America Value Share (%) and BPS Analysis by Source, 2023 to 2033
Figure 60: Latin America Y-o-Y Growth (%) Projections by Source, 2023 to 2033
Figure 61: Latin America Value (US$ Million) Analysis by Grade, 2018 to 2033
Figure 62: Latin America Volume (MT) Analysis by Grade, 2018 to 2033
Figure 63: Latin America Value Share (%) and BPS Analysis by Grade, 2023 to 2033
Figure 64: Latin America Y-o-Y Growth (%) Projections by Grade, 2023 to 2033
Figure 65: Latin America Value (US$ Million) Analysis by End-Use, 2018 to 2033
Figure 66: Latin America Volume (MT) Analysis by End-Use, 2018 to 2033
Figure 67: Latin America Value Share (%) and BPS Analysis by End-Use, 2023 to 2033
Figure 68: Latin America Y-o-Y Growth (%) Projections by End-Use, 2023 to 2033
Figure 69: Latin America Attractiveness by Source, 2023 to 2033
Figure 70: Latin America Attractiveness by Grade, 2023 to 2033
Figure 71: Latin America Attractiveness by End-Use, 2023 to 2033
Figure 72: Latin America Attractiveness by Country, 2023 to 2033
Figure 73: Western Europe Value (US$ Million) by Source, 2023 to 2033
Figure 74: Western Europe Value (US$ Million) by Grade, 2023 to 2033
Figure 75: Western Europe Value (US$ Million) by End-Use, 2023 to 2033
Figure 76: Western Europe Value (US$ Million) by Country, 2023 to 2033
Figure 77: Western Europe Value (US$ Million) Analysis by Country, 2018 to 2033
Figure 78: Western Europe Volume (MT) Analysis by Country, 2018 to 2033
Figure 79: Western Europe Value Share (%) and BPS Analysis by Country, 2023 to 2033
Figure 80: Western Europe Y-o-Y Growth (%) Projections by Country, 2023 to 2033
Figure 81: Western Europe Value (US$ Million) Analysis by Source, 2018 to 2033
Figure 82: Western Europe Volume (MT) Analysis by Source, 2018 to 2033
Figure 83: Western Europe Value Share (%) and BPS Analysis by Source, 2023 to 2033
Figure 84: Western Europe Y-o-Y Growth (%) Projections by Source, 2023 to 2033
Figure 85: Western Europe Value (US$ Million) Analysis by Grade, 2018 to 2033
Figure 86: Western Europe Volume (MT) Analysis by Grade, 2018 to 2033
Figure 87: Western Europe Value Share (%) and BPS Analysis by Grade, 2023 to 2033
Figure 88: Western Europe Y-o-Y Growth (%) Projections by Grade, 2023 to 2033
Figure 89: Western Europe Value (US$ Million) Analysis by End-Use, 2018 to 2033
Figure 90: Western Europe Volume (MT) Analysis by End-Use, 2018 to 2033
Figure 91: Western Europe Value Share (%) and BPS Analysis by End-Use, 2023 to 2033
Figure 92: Western Europe Y-o-Y Growth (%) Projections by End-Use, 2023 to 2033
Figure 93: Western Europe Attractiveness by Source, 2023 to 2033
Figure 94: Western Europe Attractiveness by Grade, 2023 to 2033
Figure 95: Western Europe Attractiveness by End-Use, 2023 to 2033
Figure 96: Western Europe Attractiveness by Country, 2023 to 2033
Figure 97: Eastern Europe Value (US$ Million) by Source, 2023 to 2033
Figure 98: Eastern Europe Value (US$ Million) by Grade, 2023 to 2033
Figure 99: Eastern Europe Value (US$ Million) by End-Use, 2023 to 2033
Figure 100: Eastern Europe Value (US$ Million) by Country, 2023 to 2033
Figure 101: Eastern Europe Value (US$ Million) Analysis by Country, 2018 to 2033
Figure 102: Eastern Europe Volume (MT) Analysis by Country, 2018 to 2033
Figure 103: Eastern Europe Value Share (%) and BPS Analysis by Country, 2023 to 2033
Figure 104: Eastern Europe Y-o-Y Growth (%) Projections by Country, 2023 to 2033
Figure 105: Eastern Europe Value (US$ Million) Analysis by Source, 2018 to 2033
Figure 106: Eastern Europe Volume (MT) Analysis by Source, 2018 to 2033
Figure 107: Eastern Europe Value Share (%) and BPS Analysis by Source, 2023 to 2033
Figure 108: Eastern Europe Y-o-Y Growth (%) Projections by Source, 2023 to 2033
Figure 109: Eastern Europe Value (US$ Million) Analysis by Grade, 2018 to 2033
Figure 110: Eastern Europe Volume (MT) Analysis by Grade, 2018 to 2033
Figure 111: Eastern Europe Value Share (%) and BPS Analysis by Grade, 2023 to 2033
Figure 112: Eastern Europe Y-o-Y Growth (%) Projections by Grade, 2023 to 2033
Figure 113: Eastern Europe Value (US$ Million) Analysis by End-Use, 2018 to 2033
Figure 114: Eastern Europe Volume (MT) Analysis by End-Use, 2018 to 2033
Figure 115: Eastern Europe Value Share (%) and BPS Analysis by End-Use, 2023 to 2033
Figure 116: Eastern Europe Y-o-Y Growth (%) Projections by End-Use, 2023 to 2033
Figure 117: Eastern Europe Attractiveness by Source, 2023 to 2033
Figure 118: Eastern Europe Attractiveness by Grade, 2023 to 2033
Figure 119: Eastern Europe Attractiveness by End-Use, 2023 to 2033
Figure 120: Eastern Europe Attractiveness by Country, 2023 to 2033
Figure 121: South Asia and Pacific Value (US$ Million) by Source, 2023 to 2033
Figure 122: South Asia and Pacific Value (US$ Million) by Grade, 2023 to 2033
Figure 123: South Asia and Pacific Value (US$ Million) by End-Use, 2023 to 2033
Figure 124: South Asia and Pacific Value (US$ Million) by Country, 2023 to 2033
Figure 125: South Asia and Pacific Value (US$ Million) Analysis by Country, 2018 to 2033
Figure 126: South Asia and Pacific Volume (MT) Analysis by Country, 2018 to 2033
Figure 127: South Asia and Pacific Value Share (%) and BPS Analysis by Country, 2023 to 2033
Figure 128: South Asia and Pacific Y-o-Y Growth (%) Projections by Country, 2023 to 2033
Figure 129: South Asia and Pacific Value (US$ Million) Analysis by Source, 2018 to 2033
Figure 130: South Asia and Pacific Volume (MT) Analysis by Source, 2018 to 2033
Figure 131: South Asia and Pacific Value Share (%) and BPS Analysis by Source, 2023 to 2033
Figure 132: South Asia and Pacific Y-o-Y Growth (%) Projections by Source, 2023 to 2033
Figure 133: South Asia and Pacific Value (US$ Million) Analysis by Grade, 2018 to 2033
Figure 134: South Asia and Pacific Volume (MT) Analysis by Grade, 2018 to 2033
Figure 135: South Asia and Pacific Value Share (%) and BPS Analysis by Grade, 2023 to 2033
Figure 136: South Asia and Pacific Y-o-Y Growth (%) Projections by Grade, 2023 to 2033
Figure 137: South Asia and Pacific Value (US$ Million) Analysis by End-Use, 2018 to 2033
Figure 138: South Asia and Pacific Volume (MT) Analysis by End-Use, 2018 to 2033
Figure 139: South Asia and Pacific Value Share (%) and BPS Analysis by End-Use, 2023 to 2033
Figure 140: South Asia and Pacific Y-o-Y Growth (%) Projections by End-Use, 2023 to 2033
Figure 141: South Asia and Pacific Attractiveness by Source, 2023 to 2033
Figure 142: South Asia and Pacific Attractiveness by Grade, 2023 to 2033
Figure 143: South Asia and Pacific Attractiveness by End-Use, 2023 to 2033
Figure 144: South Asia and Pacific Attractiveness by Country, 2023 to 2033
Figure 145: East Asia Value (US$ Million) by Source, 2023 to 2033
Figure 146: East Asia Value (US$ Million) by Grade, 2023 to 2033
Figure 147: East Asia Value (US$ Million) by End-Use, 2023 to 2033
Figure 148: East Asia Value (US$ Million) by Country, 2023 to 2033
Figure 149: East Asia Value (US$ Million) Analysis by Country, 2018 to 2033
Figure 150: East Asia Volume (MT) Analysis by Country, 2018 to 2033
Figure 151: East Asia Value Share (%) and BPS Analysis by Country, 2023 to 2033
Figure 152: East Asia Y-o-Y Growth (%) Projections by Country, 2023 to 2033
Figure 153: East Asia Value (US$ Million) Analysis by Source, 2018 to 2033
Figure 154: East Asia Volume (MT) Analysis by Source, 2018 to 2033
Figure 155: East Asia Value Share (%) and BPS Analysis by Source, 2023 to 2033
Figure 156: East Asia Y-o-Y Growth (%) Projections by Source, 2023 to 2033
Figure 157: East Asia Value (US$ Million) Analysis by Grade, 2018 to 2033
Figure 158: East Asia Volume (MT) Analysis by Grade, 2018 to 2033
Figure 159: East Asia Value Share (%) and BPS Analysis by Grade, 2023 to 2033
Figure 160: East Asia Y-o-Y Growth (%) Projections by Grade, 2023 to 2033
Figure 161: East Asia Value (US$ Million) Analysis by End-Use, 2018 to 2033
Figure 162: East Asia Volume (MT) Analysis by End-Use, 2018 to 2033
Figure 163: East Asia Value Share (%) and BPS Analysis by End-Use, 2023 to 2033
Figure 164: East Asia Y-o-Y Growth (%) Projections by End-Use, 2023 to 2033
Figure 165: East Asia Attractiveness by Source, 2023 to 2033
Figure 166: East Asia Attractiveness by Grade, 2023 to 2033
Figure 167: East Asia Attractiveness by End-Use, 2023 to 2033
Figure 168: East Asia Attractiveness by Country, 2023 to 2033
Figure 169: Middle East and Africa Value (US$ Million) by Source, 2023 to 2033
Figure 170: Middle East and Africa Value (US$ Million) by Grade, 2023 to 2033
Figure 171: Middle East and Africa Value (US$ Million) by End-Use, 2023 to 2033
Figure 172: Middle East and Africa Value (US$ Million) by Country, 2023 to 2033
Figure 173: Middle East and Africa Value (US$ Million) Analysis by Country, 2018 to 2033
Figure 174: Middle East and Africa Volume (MT) Analysis by Country, 2018 to 2033
Figure 175: Middle East and Africa Value Share (%) and BPS Analysis by Country, 2023 to 2033
Figure 176: Middle East and Africa Y-o-Y Growth (%) Projections by Country, 2023 to 2033
Figure 177: Middle East and Africa Value (US$ Million) Analysis by Source, 2018 to 2033
Figure 178: Middle East and Africa Volume (MT) Analysis by Source, 2018 to 2033
Figure 179: Middle East and Africa Value Share (%) and BPS Analysis by Source, 2023 to 2033
Figure 180: Middle East and Africa Y-o-Y Growth (%) Projections by Source, 2023 to 2033
Figure 181: Middle East and Africa Value (US$ Million) Analysis by Grade, 2018 to 2033
Figure 182: Middle East and Africa Volume (MT) Analysis by Grade, 2018 to 2033
Figure 183: Middle East and Africa Value Share (%) and BPS Analysis by Grade, 2023 to 2033
Figure 184: Middle East and Africa Y-o-Y Growth (%) Projections by Grade, 2023 to 2033
Figure 185: Middle East and Africa Value (US$ Million) Analysis by End-Use, 2018 to 2033
Figure 186: Middle East and Africa Volume (MT) Analysis by End-Use, 2018 to 2033
Figure 187: Middle East and Africa Value Share (%) and BPS Analysis by End-Use, 2023 to 2033
Figure 188: Middle East and Africa Y-o-Y Growth (%) Projections by End-Use, 2023 to 2033
Figure 189: Middle East and Africa Attractiveness by Source, 2023 to 2033
Figure 190: Middle East and Africa Attractiveness by Grade, 2023 to 2033
Figure 191: Middle East and Africa Attractiveness by End-Use, 2023 to 2033
Figure 192: Middle East and Africa Attractiveness by Country, 2023 to 2033
The overall market size for the gluconolactone market was USD 139.9 Million in 2025.
The gluconolactone market is expected to reach USD 288.4 Million in 2035.
Growth is driven by the increasing use in the food and beverage industry as a preservative, rising demand for gluconolactone in cosmetics and personal care products, and expanding applications in pharmaceuticals due to its antioxidant and chelating properties.
The top 5 countries driving the development of the gluconolactone market are the USA, China, Germany, Japan, and France.
Non-Synthetic Sources and 97%-100% Grade are expected to command a significant share over the assessment period.
Thank you!
You will receive an email from our Business Development Manager. Please be sure to check your SPAM/JUNK folder too.