The Glassine Paper Industry Analysis in Japan is estimated to be valued at USD 121.5 million in 2025 and is projected to reach USD 176.4 million by 2035, registering a compound annual growth rate (CAGR) of 3.8% over the forecast period.
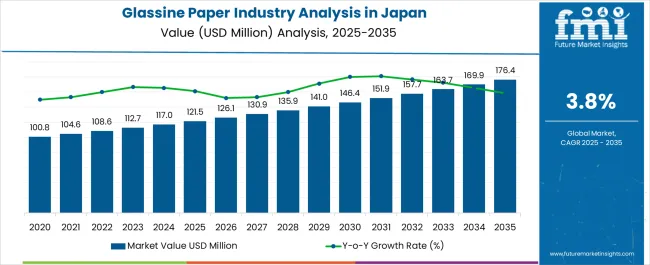
| Metric | Value |
|---|---|
| Glassine Paper Industry Analysis in Japan Estimated Value in (2025 E) | USD 121.5 million |
| Glassine Paper Industry Analysis in Japan Forecast Value in (2035 F) | USD 176.4 million |
| Forecast CAGR (2025 to 2035) | 3.8% |
The glassine paper industry in Japan is experiencing steady growth. Increasing demand for high-quality, grease-resistant, and smooth paper products is being driven by expanding packaging requirements and strict food safety regulations.
Current market dynamics are shaped by strong domestic consumption, advanced manufacturing capabilities, and emphasis on sustainable and recyclable materials. The industry is supported by technological advancements in pulp processing, coating, and finishing techniques that enhance product performance and consistency.
The future outlook is characterized by growing applications in food packaging, confectionery, and specialty industrial uses, along with rising awareness of eco-friendly alternatives Growth rationale is underpinned by increasing adoption of bleached and high-clarity paper variants, the ability of manufacturers to meet stringent quality standards, and the integration of innovative solutions for packaging and food preservation, collectively supporting sustained market expansion and stable revenue generation in the Japanese market.
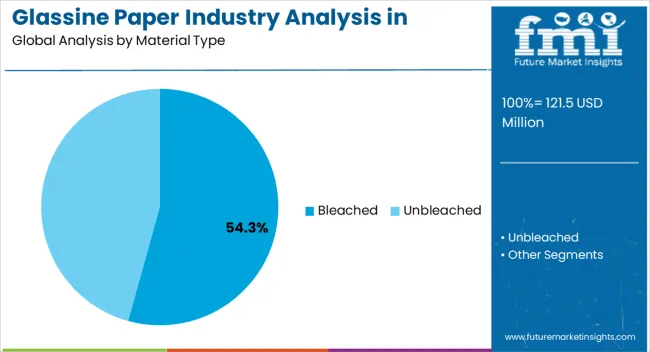
The bleached material type segment, holding 54.30% of the material category, has maintained its leading position due to its superior brightness, smoothness, and functional attributes required for high-quality packaging applications. Market adoption has been driven by consistent performance in grease and moisture resistance, which is critical for food and confectionery packaging.
Processing refinements and adherence to regulatory standards have enhanced product reliability, supporting long-term usage in industrial and commercial applications. The segment’s growth has been reinforced by increasing preference for aesthetically appealing and hygienic packaging solutions.
Investment in advanced bleaching techniques, sustainable sourcing of pulp, and enhanced paper uniformity have contributed to maintaining market share Continued focus on product innovation and quality optimization is expected to sustain segment dominance and support incremental market growth.
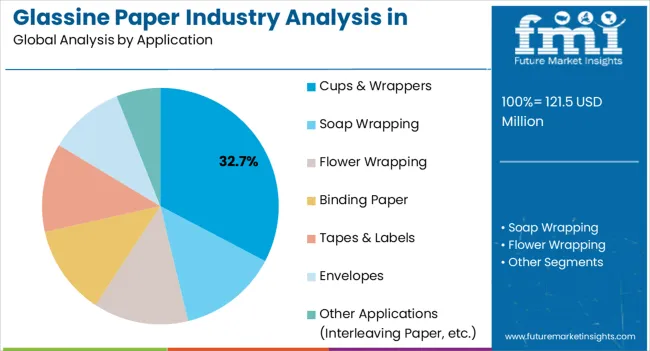
The cups and wrappers application segment, representing 32.70% of the application category, has remained prominent due to rising demand in foodservice, bakery, and confectionery sectors. Adoption has been supported by the need for functional, grease-resistant, and visually appealing packaging solutions.
Integration with automated production lines and compatibility with high-speed forming and wrapping processes have further enhanced market acceptance. Product performance in terms of strength, smoothness, and printability has strengthened preference among manufacturers and consumers.
Regulatory compliance for food contact applications has reinforced reliability and market trust The segment is expected to continue contributing significantly to overall market growth, driven by increased food packaging demand and expanding consumer-oriented product applications.
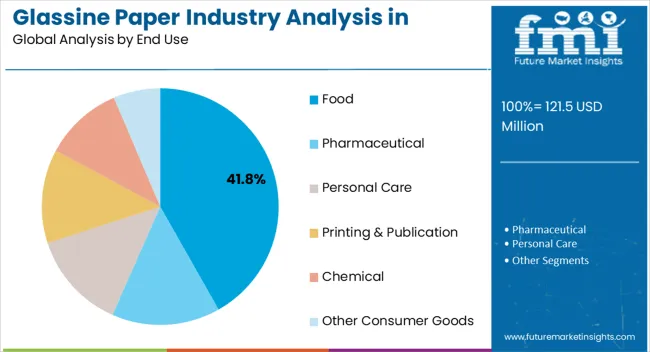
The food end-use segment, holding 41.80% of the end-use category, has emerged as the leading segment due to growing consumption of packaged and convenience foods in Japan. Adoption has been driven by the ability of glassine paper to provide hygienic, grease-resistant, and protective packaging solutions.
Market penetration has been supported by stringent food safety regulations, strong retail and foodservice infrastructure, and rising consumer preference for well-packaged products. Enhanced product quality, sustainable sourcing, and environmentally friendly processing have further reinforced segment leadership.
The segment’s growth trajectory is expected to remain robust, supported by continuous demand for safe and attractive food packaging solutions and increased integration into various packaged food categories.
The bleached segment is set to dominate Japan glassine paper industry with a substantial 65.20% industry share. This preference stems from its versatility, offering a pristine canvas for printing and labeling across various sectors.
| Material | Bleached |
|---|---|
| Industry Share | 65.20% |
Its adaptability, coupled with superior quality and aesthetics, positions bleached segment as the prime choice, meeting diverse applications and driving its widespread utilization in Japan glassine paper landscape.
The food segment is poised to thrive in Japan glassine paper landscape, commanding a substantial 29.20% industry share. Its allure lies in preserving freshness, maintaining hygiene, and enhancing presentation in food packaging.
| End Use | Food |
|---|---|
| Industry Share | 29.20% |
Its versatility in safeguarding food items aligns with stringent quality standards, making it a lucrative choice. Its pivotal role in ensuring food safety and visual appeal solidifies its prominence across diverse applications in Japan glassine paper industry.
The Kanto glassine paper industry reflects a trend toward technology integration, emphasizing digitization in production processes and quality control. Innovations center on eco friendly materials and sustainable practices, aligning with consumer demands for environmentally conscious products.
Customization gains traction, catering to varied industry needs, while advancements in printing methods drive enhanced designs on glassine paper. Collaborations with diverse sectors like cosmetics and pharmaceuticals highlight a shift toward specialized applications, propelling the Kanto region as a hub for pioneering technological advancements and tailored solutions within its glassine paper landscape.
The glassine paper industry in Kyushu and Okinawa presents burgeoning opportunities driven by evolving Industry demands and regional growth. With increasing focus on eco friendly solutions, there is a rising need for sustainable packaging and labeling materials.
This trend creates space for innovation, fostering opportunities for local manufacturers to provide specialized, environmentally conscious Glassine Paper products.
Collaborations with industries like food packaging, pharmaceuticals, and crafts, seeking versatile paper solutions, open doors for regional growth, positioning Kyushu and Okinawa as thriving hubs for expanding glassine paper within its diverse paper industry.
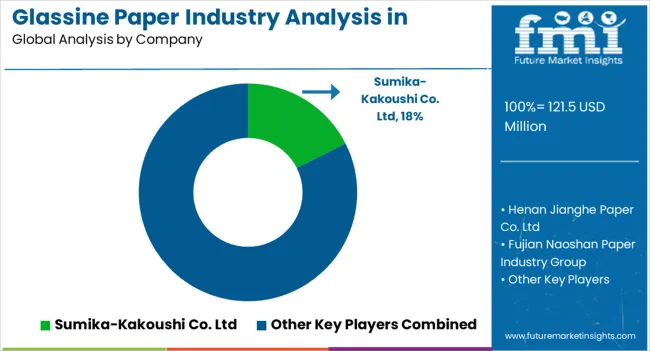
The competitive landscape of the Japan glassine paper industry showcases key players like Nippon Paper Industries, Oji Holdings, and Mitsubishi Paper Mills, renowned for their extensive product portfolios and emphasis on innovation. These industry leaders compete by offering superior quality, eco friendly products and leveraging advanced manufacturing processes.
Smaller players like Chuetsu Pulp & Paper and Daio Paper contribute to the Industry diversity. Its competition centers on technological advancements, sustainable practices, and meeting diverse customer demands, fostering a landscape characterized by innovation, quality assurance, and a relentless pursuit of eco conscious solutions within Japan glassine paper sector.
Product Portfolio
| Attribute | Details |
|---|---|
| Estimated Industry Size in 2025 | USD 121.5 million |
| Projected Industry Size in 2035 | USD 176.4 million |
| Attributed CAGR between 2025 and 2035 | 3.8%CAGR |
| Historical Analysis of Demand for Glassine Paper in Japan Regions | 2020 to 2025 |
| Forecast Period | 2025 to 2035 |
| Report Coverage | Industry size, industry trends, analysis of key factors influencing Glassine Paper in Japan, insights on global players and their industry strategy in Japan, ecosystem analysis of local and regional Japan providers. |
| Key Regions within Japan Analyzed while Studying Opportunities for Glassine Paper in Japan | Kanto; Chubu; Kinki; Kyushu & Okinawa; Tohoku; Rest of Japan |
| Key Companies Profiled | Sumika-KakoushiCo. Ltd; Henan Jianghe Paper Co. Ltd; Fujian Naoshan Paper Industry Group; Nordic Paper; KRPA Paper; Metsa Tissue; Riverside Paper; Savvy Packaging; Patidar Corporation; Singhvi Foils |
The global glassine paper industry analysis in Japan is estimated to be valued at USD 121.5 million in 2025.
The market size for the glassine paper industry analysis in Japan is projected to reach USD 176.8 million by 2035.
The glassine paper industry analysis in Japan is expected to grow at a 3.8% CAGR between 2025 and 2035.
The key product types in glassine paper industry analysis in Japan are bleached and unbleached.
In terms of application, cups & wrappers segment to command 32.7% share in the glassine paper industry analysis in Japan in 2025.


Full Research Suite comprises of:
Market outlook & trends analysis
Interviews & case studies
Strategic recommendations
Vendor profiles & capabilities analysis
5-year forecasts
8 regions and 60+ country-level data splits
Market segment data splits
12 months of continuous data updates
DELIVERED AS:
PDF EXCEL ONLINE
Glassine Paper Market Size and Share Forecast Outlook 2025 to 2035
Examining Market Share Trends in the Glassine Paper Industry
Glassine Paper Industry Analysis in Western Europe Size and Share Forecast Outlook 2025 to 2035
Glassine Paper Industry Analysis in Korea Size and Share Forecast Outlook 2025 to 2035
Super Calendered Glassine Paper Market Size and Share Forecast Outlook 2025 to 2035
Paper Wrap Market Size and Share Forecast Outlook 2025 to 2035
Paper Cups Market Size and Share Forecast Outlook 2025 to 2035
Paper Core Market Size and Share Forecast Outlook 2025 to 2035
Paper Bags Market Size and Share Forecast Outlook 2025 to 2035
Paper Tester Market Size and Share Forecast Outlook 2025 to 2035
Paper Pigments Market Size and Share Forecast Outlook 2025 to 2035
Paper Honeycomb Market Size and Share Forecast Outlook 2025 to 2035
Paper Edge Protector Market Analysis - Size, Share, and Forecast Outlook for 2025 to 2035
Paper Cup Lids Market Analysis - Size, Share, and Forecast Outlook for 2025 to 2035
Paper Goods Market Size and Share Forecast Outlook 2025 to 2035
Paper-based Blister Packs Market Analysis Size and Share Forecast Outlook 2025 to 2035
Paper Cushion Systems Market Size and Share Forecast Outlook 2025 to 2035
Paper Waste Strippers Market Size and Share Forecast Outlook 2025 to 2035
Paper Pouch Market Size, Share & Forecast 2025 to 2035
Paper Pallet Market Analysis - Size, Share, and Forecast Outlook 2025 to 2035

Thank you!
You will receive an email from our Business Development Manager. Please be sure to check your SPAM/JUNK folder too.
Chat With
MaRIA