The GigE Camera Market is estimated to be valued at USD 4.5 billion in 2025 and is projected to reach USD 10.9 billion by 2035, registering a compound annual growth rate (CAGR) of 9.1% over the forecast period.
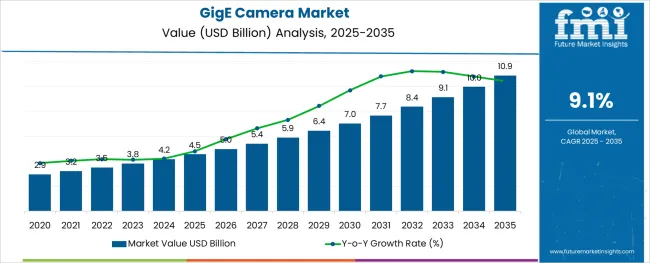
The GigE camera market is expanding steadily, driven by rising automation across industrial, surveillance, and medical imaging sectors. These cameras, known for high-speed data transmission and long cable lengths, are increasingly being integrated into smart manufacturing lines, robotic vision systems, and laboratory setups.
The adoption is being influenced by the ability to achieve real-time high-resolution imaging with minimal latency. Continuous innovation in Gigabit Ethernet interface protocols, better sensor integration, and standardized software frameworks have improved interoperability and scalability, further broadening their applicability.
Moreover, advancements in bandwidth optimization, network management, and image processing are enabling greater deployment in remote and AI-assisted monitoring environments. Strategic collaborations between sensor manufacturers, camera OEMs, and machine vision integrators are also contributing to faster market penetration across both developed and emerging economies.
The market is segmented by Technology, Type, Color Sensor Type, and End User and region. By Technology, the market is divided into Complementary Metal-Oxide-Semiconductor (CMOS) and Charge Coupled Device (CCD). In terms of Type, the market is classified into Area Scan and Line Scan. Based on Color Sensor Type, the market is segmented into Monochrome and Color. By End User, the market is divided into Industrial, Military and Defense, Pharmaceutical, Traffic, Security & Surveillance, Medical/Life Sciences, and Others. Regionally, the market is classified into North America, Latin America, Western Europe, Eastern Europe, Balkan & Baltic Countries, Russia & Belarus, Central Asia, East Asia, South Asia & Pacific, and the Middle East & Africa.
The market is segmented by Technology, Type, Color Sensor Type, and End User and region. By Technology, the market is divided into Complementary Metal-Oxide-Semiconductor (CMOS) and Charge Coupled Device (CCD). In terms of Type, the market is classified into Area Scan and Line Scan. Based on Color Sensor Type, the market is segmented into Monochrome and Color. By End User, the market is divided into Industrial, Military and Defense, Pharmaceutical, Traffic, Security & Surveillance, Medical/Life Sciences, and Others. Regionally, the market is classified into North America, Latin America, Western Europe, Eastern Europe, Balkan & Baltic Countries, Russia & Belarus, Central Asia, East Asia, South Asia & Pacific, and the Middle East & Africa.
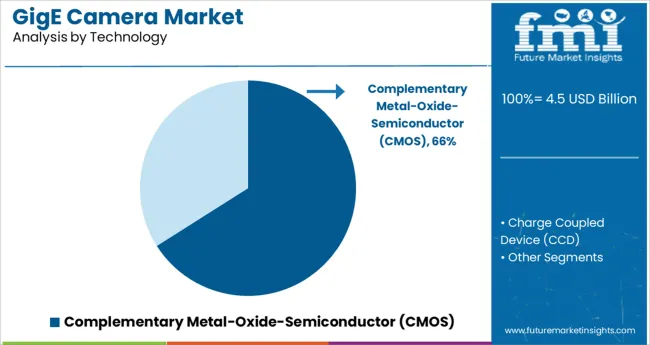
Complementary Metal-Oxide-Semiconductor (CMOS) technology is projected to account for 66.0% of the total GigE camera market revenue in 2025, making it the dominant segment by technology. Its widespread adoption is being driven by the combination of lower power consumption, cost efficiency, and higher integration capability compared to traditional imaging technologies.
CMOS sensors support faster frame rates and reduced readout noise, which are essential for high-speed industrial inspections and real-time machine vision. In addition, ongoing improvements in pixel architecture have enhanced light sensitivity and dynamic range, expanding usage in both low-light and high-contrast environments.
The compatibility of CMOS with miniaturized designs has further facilitated adoption in compact robotic vision systems and embedded imaging modules. As automation in quality control and logistics intensifies, CMOS technology remains the preferred imaging foundation for GigE-based applications.
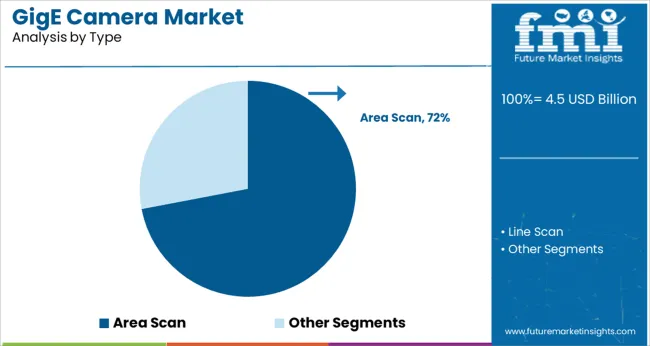
Area scan cameras are anticipated to hold 72.0% of the total revenue share in the GigE camera market in 2025, positioning this as the leading camera type segment. Their dominance is underpinned by the versatility in capturing two-dimensional images with high spatial resolution, which makes them suitable for diverse applications including electronics inspection, traffic monitoring, and medical diagnostics.
Area scan models offer greater flexibility in object orientation, movement, and lighting compared to line scan systems, which contributes to their widespread use. The integration of advanced trigger controls, image buffering, and synchronization features has further optimized their performance in dynamic industrial settings.
With continued demand for accurate surface inspection, label verification, and barcode reading, area scan cameras continue to be favored by systems integrators and end-users alike.
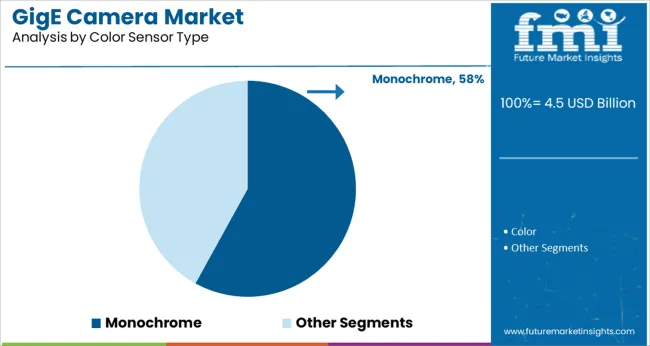
Monochrome sensors are forecast to contribute 58.0% of the GigE camera market revenue by 2025, establishing this segment as the most utilized color sensor type. Their leading position is being reinforced by the superior sensitivity, contrast, and sharpness they offer for feature detection in precision-driven applications.
Monochrome cameras eliminate the need for color filters, allowing more light to reach the sensor, which results in clearer images and faster processing critical in high-speed inspections and low-light conditions. These sensors are widely preferred in machine vision tasks such as defect detection, pattern recognition, and measurement, where color differentiation is not required.
Additionally, the reduced data payload from monochrome imaging facilitates quicker data transmission over GigE interfaces, optimizing performance in bandwidth-sensitive environments. As cost and speed remain key selection criteria, monochrome sensors are expected to retain their dominance in performance-centric GigE deployments.
The increasing population, along with the improving lifestyles of the people across the world, is bringing challenges to the respective governments to deal with the development of transportation infrastructure and security across the globe. It is impossible to resolve this issue effectively with additional staffing as this would exceed the budget of the company.
The trend toward the adoption of Intelligent Transport Systems (ITS) in the transportation sector offers one of the most promising prospects for the future, offering safer, greener, and more connected roads. Consequently, industrial cameras such as GigE are in high demand so that speed, toll, and red-light enforcement can be carried out effectively as a result of this. In addition, Power Over Ethernet (PoE) facilitates easy installation because it enables multiple cameras to be installed within a system that is easily accessible to the transportation system as a whole.
There are very challenging requirements for traffic monitoring and red-light enforcement, whereas traffic monitoring only requires capturing usable images in situations ranging from full daylight to night-time, with a corner lamppost providing the only illumination needed. As well as color operation, the camera must have a wide enough field of view to capture the entire vehicle's image and must have a high enough resolution to be able to recognize license plates automatically. The development of connected transport infrastructure is a major priority for many countries, including China.
Europe GigE Camera Market:
As a result of Europe's successful track record in terms of adopting new technology in addition to its focus on developing public transport infrastructure, the GigE camera market is also expected to occupy a significant share in the future. Due to well-established transport infrastructure throughout the world, there is invariably an increase in the maintenance of the infrastructure to meet the needs of the increasing population, and as a result, the GigE camera market is expected to witness significant growth in the forecasted period.
The demand for GigE cameras in the Asia Pacific region is expected to continue to grow owing to the growing end-user industries in the region. As the GigE camera market is expected to grow in the automotive sector, the increasing investment in the region coupled with the increase in investment in e-vehicles may further increase the market's growth rate.
For instance, General Motors invested USD 2.9 billion in South Korea in 2020 as a significant investment.
Further, the region is investing in connected infrastructure projects, which represent 10% of the total global projects currently under construction for energy, transportation, water, and rail that will be completed over the next ten years as part of the restructuring of its embattled unit in the country. As a result of these developments in the region, the demand for GigE cameras is increasing in the region.
GigE cameras are specially designed imaging cameras that can interface with computer systems with the utilization of GigE ports. The increasing demand for Gigabit Ethernet cameras for various imaging applications owing to their ability to transfer data at rates of up to 1000Mb/s is estimated to boost the growth in this market.
These cameras also enable a seamless integration between machine vision software and hardware products. These help in reducing the time-consuming and tedious multi-vendor integration issues that often slow down the machine vision sector.
The requirement of frame grabbers, which are otherwise considered to be a crucial component when used with conventional cameras or analogue technology, is eliminated in GigE cameras. Thus, the installation cost of these camera setups is relatively low, which is a major factor that is projected to fuel the demand for GigE cameras in the near future.
The ongoing integration of GigE Vision technology in multiple applications, such as medical care, Printed Circuit Board (PCB) inspection, and traffic control is a significant factor that is expected to propel the GigE camera market share in the forthcoming years. This technology provides high reliability, enhanced transmission mechanism, long cable length, and improved bandwidth.
GigE Vision is mainly based on the topology of Gigabit Ethernet technology, which is set to gain immense popularity in future. Gigabit Ethernet delivers several advantages with the increasing usage in both the consumer and industrial markets. As it is a low-cost and an easy-to-use interface, it is expected to be extensively used in a wide range of applications.
Even though GigE Vision has various advantages, such as lower cost, faster transfer rate, simple cabling, and elimination of camera files, as compared to Camera Link and parallel standards, it has certain disadvantages as well.
At times, it is very difficult to synchronize with other devices and provides less triggering support. The transfer of high data volumes over long distances requires the usage of many electrons that are pushed through the cable. It needs robust line drivers, which surges the heat generation and power consumption of industrial GigE cameras. Spurred by the above-mentioned factors, the sales of GigE cameras may get hampered in the assessment period.
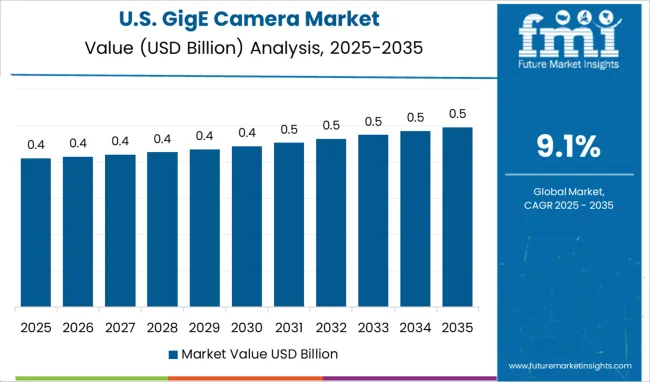
The increasing usage of GigE cameras in the military and defense industry and the high demand for machine vision cameras in the USA. and Canada are likely to bode well for the North America market. The urgent need for high-quality cameras for security and surveillance applications is another significant factor that is expected to drive the demand for GigE cameras in North America.
The growing usage of GigE interface in machine vision cameras in the USA. owing to its superior networking infrastructure is likely to augment the market. It is set to be extensively used in industrial image processing in a wide range of sectors, including pharmaceuticals, automotive, electronics and semiconductor, packaging and printing, food and beverage, and healthcare in North America, which is likely to augur well for the market.
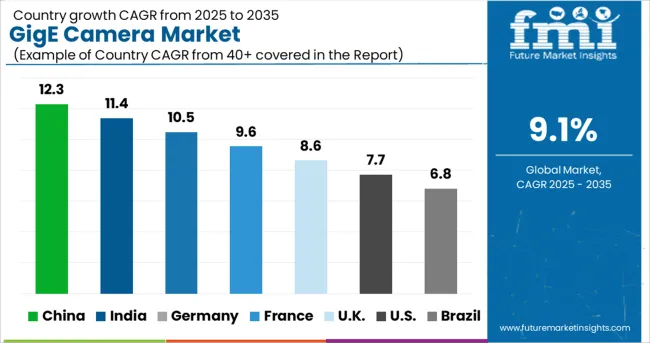
Asia Pacific is anticipated to exhibit lucrative GigE camera market share in the near future backed by the ongoing development of various end-use industries. Rising investments by governments of India and China in the automotive sector to create new e-vehicles is a vital factor that is likely to accelerate the market.
As per the International Trade Administration, China is considered to be the world’s largest vehicle market by both manufacturing and sales output. By 2025, the domestic production in this country is expected to reach 4.2 million vehicles. In 2024, more than 25 million vehicles were sold in China and this trend is likely to continue throughout the forthcoming years and boost the market.
On the other hand, the increasing preference for GigE camera interface, especially in machine vision cameras owing to the presence of a well-established networking infrastructure is estimated to drive the market in Asia Pacific. These are set to be extensively used in pharmaceutical application for flow control processes and barcode reading.
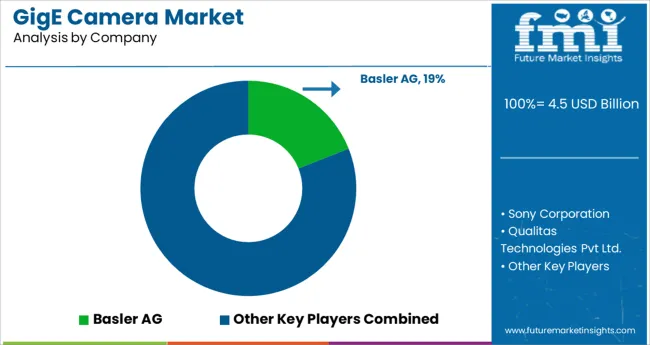
Some of the key players operating in the global GigE camera are Toshiba Corporation, Allied Vision Technologies GmbH, Sony Corporation, Basler AG, Teledyne DALSA Inc., Baumer, Qualitas Technologies, IMPERX, Inc., Omron Corporation, and Matrox Imaging.
The global market is highly fragmented with the presence of several renowned companies providing their in-house products. Many vendors are focusing on the rapid adoption of the new product launch strategy with less product differentiation in terms of offerings. A few other key players are aiming to engage in mergers and acquisitions with start-up companies and local firms to strengthen their footprint in the global market.
| Report Attributes | Details |
|---|---|
| Growth Rate | CAGR of 9.1% from 2025 to 2035 |
| Base Year for Estimation | 2024 |
| Historical Data | 2020 to 2024 |
| Forecast Period | 2025 to 2035 |
| Quantitative Units | Revenue in USD Million and CAGR from 2025 to 2035 |
| Report Coverage | Revenue Forecast, Volume Forecast, Company Ranking, Competitive Landscape, Growth Factors, Trends and Pricing Analysis |
| Segments Covered | End User, Technology, Color Sensor Type, Type, Region |
| Regions Covered | North America; Latin America; Western Europe; Eastern Europe; APEJ; Japan; Middle East and Africa |
| Key Countries Profiled | USA, Canada, Brazil, Argentina, Germany, UK, France, Spain, Italy, Nordics, BENELUX, Australia & New Zealand, China, India, ASEAN, GCC, South Africa |
| Key Companies Profiled | Toshiba Corporation; Allied Vision Technologies GmbH; Sony Corporation; Basler AG; Teledyne DALSA Inc.; Baumer; Qualitas Technologies; IMPERX, Inc.; Omron Corporation; Matrox Imaging |
| Customization | Available Upon Request |
The global gige camera market is estimated to be valued at USD 4.5 billion in 2025.
It is projected to reach USD 10.9 billion by 2035.
The market is expected to grow at a 9.1% CAGR between 2025 and 2035.
The key product types are complementary metal-oxide-semiconductor (cmos) and charge coupled device (ccd).
area scan segment is expected to dominate with a 72.0% industry share in 2025.


Full Research Suite comprises of:
Market outlook & trends analysis
Interviews & case studies
Strategic recommendations
Vendor profiles & capabilities analysis
5-year forecasts
8 regions and 60+ country-level data splits
Market segment data splits
12 months of continuous data updates
DELIVERED AS:
PDF EXCEL ONLINE
Camera Accessories Market Size and Share Forecast Outlook 2025 to 2035
Camera Lens Market Size and Share Forecast Outlook 2025 to 2035
Camera Module Market Size and Share Forecast Outlook 2025 to 2035
Camera Technology Market Analysis – Trends & Forecast 2025 to 2035
Camera Case Market Trends & Industry Growth Forecast 2024-2034
IP Camera Market Trends – Growth, Demand & Forecast 2025 to 2035
3D Camera Market Growth – Trends & Forecast 2025 to 2035
TDI Camera Market Growth - Trends & Forecast 2025 to 2035
Intracameral Antibiotics Market Analysis - Size, Share, and Forecast Outlook 2025 to 2035
CMOS Camera Market Size and Share Forecast Outlook 2025 to 2035
CCTV Camera Market Demand & Sustainability Trends 2025-2035
Smart Camera Market Analysis – Size, Share & Forecast 2025 to 2035
Drain Camera Market
InGaAs Cameras Market by Technology, Scanning Type, Industry & Region Forecast till 2035
Action Camera Market
Mobile Camera Module Market
Network Cameras and Video Analytics Market Analysis – Trends & Forecast 2025 to 2035
Security Cameras (IR Illuminator) Market Size and Share Forecast Outlook 2025 to 2035
Aircraft Cameras Market Size and Share Forecast Outlook 2025 to 2035
Acoustic Camera Market Growth - Size, Trends & Forecast 2025 to 2035

Thank you!
You will receive an email from our Business Development Manager. Please be sure to check your SPAM/JUNK folder too.
Chat With
MaRIA