Genitourinary Prosthetics Market Size and Share Forecast Outlook 2025 to 2035

The Genitourinary Prosthetics Market is anticipated to be valued at USD 634.70 million in 2025 and is expected to reach USD 1,014.3 million by 2035, registering a CAGR of 4.8%.

Quick Stats for Genitourinary Prosthetics Market

  • Industry Value (2025): USD 634.70 million
  • Forecast Value (2035): USD 1,014.3 million
  • Forecast CAGR: 4.8%
  • Leading Segment in 2025: Implants
  • Key Growth Region: Asia-Pacific (China, India, Japan)
  • Top Key Players: Boston Scientific Corporation, Zephyr Surgical Implants SÀRL, Coloplast Care, Promedon, UroMed, Advin Healthcare, Rigicon Inc., KARL STORZ GmbH & Co. KG
Metric Value
Industry Size (2025E) USD 634.70 Million
Industry Value (2035F) USD 1,014.3 Million
CAGR (2025 to 2035) 4.8%

The Genitourinary Prosthetics Market is experiencing significant growth, driven by the increasing prevalence of urological disorders such as erectile dysfunction and urinary incontinence. Advancements in prosthetic technologies, including the development of biocompatible materials and minimally invasive surgical techniques, are enhancing patient outcomes and satisfaction.

The aging global population further contributes to market expansion, as age-related genitourinary conditions become more common. Healthcare providers are increasingly adopting these prosthetics to improve patients' quality of life, supported by favorable reimbursement policies in developed regions.

Emerging markets are also witnessing growth due to improved healthcare infrastructure and rising awareness of treatment options. The market's future outlook is positive, with continuous innovation and increased investment in research and development expected to introduce more effective and patient-friendly solutions. Collaborations between medical device companies and healthcare institutions are anticipated to further drive advancements, making genitourinary prosthetics more accessible and efficient in addressing patient needs.

Prominent manufacturers in the Genitourinary Prosthetics Market include Boston Scientific Corporation, Coloplast Group, Zephyr Surgical Implants, Promedon, and UroMed. These companies are actively engaged in research and development to introduce innovative products that address unmet clinical needs.

In Feb 2024, UroMems, announced that it has successfully met the six-month primary endpoint for the first-ever female patient implanted with the UroActive™ System, the first smart automated artificial urinary sphincter (AUS) to treat SUI.

"We are elated to reach this critical achievement contributing to the demonstration of the feasibility of the UroActive System to successfully treat women suffering from debilitating SUI, the compelling results of this first-in-female implant show the high potential of our technology, bringing us one step closer to delivering on the massive unmet need for women and physicians desperately seeking a better SUI treatment option." said Hamid Lamraoui, UroMems chief executive officer and co-founder.
Analyzing Genitourinary Prosthetics Market by Top Investment Segments

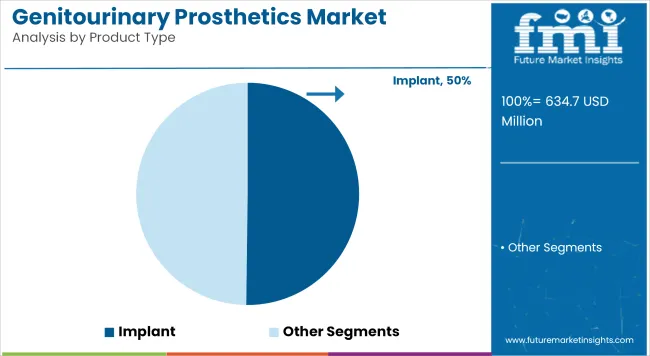
Implant Segment Leads the Market Due to Rising Incidence of Urinary and Reproductive Disorders

Genitourinary Prosthetics Market Analysis By Product Type

The implant segment has been observed to command the largest share 50.20% of total market revenue in 2025 within the genitourinary prosthetics market. This leadership position has been attributed to the rising incidence of urinary incontinence, erectile dysfunction, and testicular disorders among the aging male population.

Increased awareness about the availability of advanced prosthetic solutions, especially Artificial Urinary Sphincter (AUS) and Inflatable Penile Implants (IPP), has encouraged adoption among patients seeking long-term, quality-of-life improvements. Growth has also been supported by clinical endorsements and improved success rates in urological implant procedures.

Moreover, reimbursement support in developed economies has made such procedures more accessible. Technological advancements such as remote-controlled implants and antibiotic-coated devices have further enhanced clinical outcomes and reduced infection risks. These factors have collectively contributed to the dominance of this segment, with demand projected to grow steadily in both hospital and outpatient settings across North America and Europe.
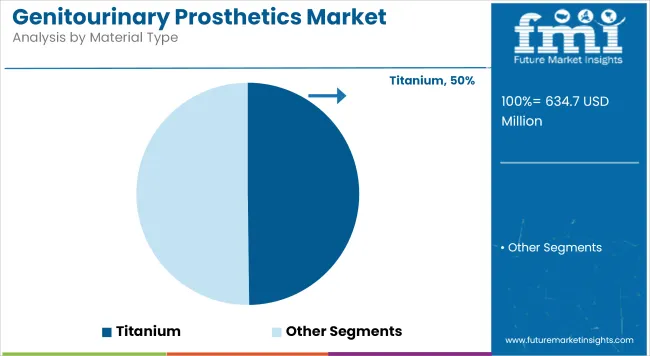
Titanium Segment Dominates the Market Due to Enhanced Biocompatibility and Structural Durability

Genitourinary Prosthetics Market Analysis By Material Type

The titanium material segment is projected to account for 49.80% of the market revenue in 2025, establishing it as the leading material type used in genitourinary prosthetic devices. Its preference has been driven by its high tensile strength, resistance to corrosion, and superior biocompatibility, which minimizes the risk of rejection or inflammation when implanted in the human body.

Titanium has been widely adopted in penile and urinary sphincter implants, where durability and long-term structural integrity are critical. Its light weight and ability to integrate well with human tissues have made it a material of choice for manufacturers focused on improving patient safety and procedural efficiency.

Additionally, regulatory bodies such as the FDA have favored titanium-based prosthetics due to their strong safety profiles, further enhancing clinician confidence. As the trend toward minimally invasive urological interventions gains momentum, titanium’s mechanical and biological advantages are expected to drive sustained demand in both high- and middle-income countries.

Challenges and Opportunities

Challenges

Limited Awareness and Social Stigma hinders their Market Growth

One of the major challenges found in the genitourinary prosthetics market is the prevalent lack of awareness and social stigma concerning urological disorders, such as erectile dysfunction and urinary incontinence.This has led to an attitude of delayed diagnosis and treatment, which narrows prospects for the marketing of such life-enhancing devices.

Furthermore, ignorance among the patient population and the first-contact clinicians could also result in advanced prosthetic options being poorly referred. Without adequate awareness and specialty outreach, a large number remain afflicted in silence, constricting the global adoption of genitourinary prosthetics, even though the devices prove to be clinically effective and affordable.

Opportunities

Technological Advancements and Product Innovationposese new business opportunities in the market

The market for genitourinary prosthetics represents an area of excellent opportunity because of constant technological advancement and product development. Newer appliances are better accepted biologically, carry a lower infection risk, or confer more user comfort, so inherently they are more agreeable to both the patient and the surgeon. More recently, newer inflatable penile prosthesis and artificial urinary sphincters facilitate surgery better and have greater durability, thus lowering the rate of complications.

Moreover, through the synergy of antimicrobial coating and by minimally invasive implantation techniques, they allow for better postoperative recovery and outcomes. This potential change is eminent with more and more manufacturers developing these technologies and pursuing R&D and clinical trials for efficacy and safety. Surgeon education and patient awareness programs are also on the rise in the marketplace and both of these will contribute towards building confidence in the advanced prosthetic solutions in the emerging and developed markets.

Industry Specific Highlights

Rising Demand for Penile Prostheses in Erectile Dysfunction Treatmentanticipates the Growth of the Market

An increasing number of patients with erectile dysfunction (ED) particularly in increasing the demand for penile prosthesis among the aged and in those suffering from co-morbidity (such as diabetes) or post-prostatectomy will soon be cured by such devices. Penile prosthesis provides patients with long-term functional efficacy when pharmacotherapy has been inadequate.

Urologists are more likely to prescribe inflatable penile implants because they offer more functionality with increased patient satisfaction. Further, insurance reimbursement gains in several countries are improving access. Firms are also investing in the advanced hydraulic systems and infection-resistant materials to lengthen their implants' duration.

The international market also has huge activities in the USA and certain areas of Europe, where access and awareness of specialized urologic care are more commonly realized; indeed, stronghold this segment as an important contributor to the entire genitourinary prosthetics market.

Growth in Urinary Sphincter Implants for Incontinence Managementdemonstrating Growth of the Market

Artificial urinary sphincters (AUS) are increasingly used in urinary incontinence, particularly post-prostatectomy stress incontinence in men. Prosthetics restore continence successfully and gain more advantages in both developed and developing markets as awareness and training among the prescribers increase.

Manufacturers design devices with enhancements in cuff durability, modes of pressure regulation, and reductions in surgical complexity to limit complications and revisions. Moreover, health systems recognize how AUS has become cost-effective to improve quality of life or to avoid dependence for long periods with absorbent products or catheters. The USA leads in adoption with strong clinical protocols; slow market penetration by Europe and Asia-Pacific follows due to changing new reimbursement environments and increasing volumes of urological surgeries.

Emerging Trends

Focus on Infection-Resistant and Biocompatible Materials

One of the key trends which is affecting the market of genitourinary prosthetics is the growing emphasis on the development of infection-resistant and highly biocompatible materials for implants. Post-operative infections have remained a major risk factor associated with the use of prostheses-penile prostheses and artificial urinary sphincters.

To combat this problem, manufacturers are launching antibiotic-coated and hydrophilic coated implants, which minimize the risk of bacterial colonization. Materials such as medical grade silicone and polyurethane with enhanced tissue compatibility are being used to minimize immune reactions and extend the life of the implant.

Regulatory bodies are becoming increasingly interested in such innovation due to their effect to improve surgical outcome. This movement, which is part of the larger industry trend, is about safer and durable prosthetic solutions in recovery and minimizing complication or revision rates.

Expansion of Minimally Invasive Surgical Techniques

Surgeons and medical professionals have, over time, been doing lesser trauma operations with procedures such as that of implanting artificial urinary sphincters and penile prostheses. This includes advanced laparoscopic techniques and even reduced incisions using improved surgical instruments, especially those developed specifically for urologic procedures.

Such methods not only lessen the scarring and postoperative pain but also provide minimal risk of infection and reduced operating times. Over the years, workshops and fellowships in such procedures are increasing worldwide to fuel the skill of surgeons. The trend has wider objectives in urology: better results, faster recovery back to normal activity, and patient satisfaction with prosthetic implantation.
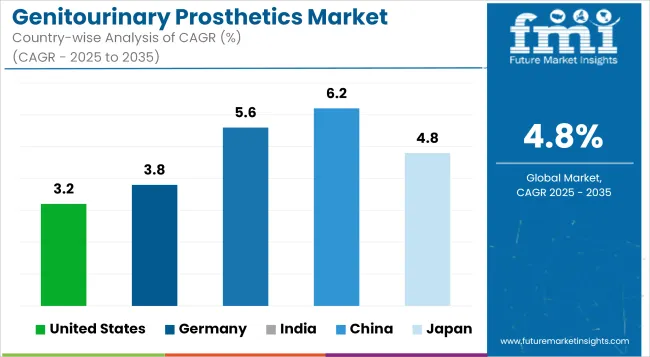
Country-Wise Analysis

Genitourinary Prosthetics Market Cagr Analysis By Country

United States

Growing diseased incidence emergency within the United States from erectile dysfunction, facilitates insurance coverage, and vast networks of urologists are major impetus. The strong demand sustainability established by the presence of the top-notch manufacturers with continued innovation on device design, examined combined with the aforementioned, will further be influential. Increase outpatient procedures and the spread of physician-owned clinics are assets that have added on to their growth with regard prosthetic coverage toward suburbs.

Market Growth Factors

  • High ED and Incontinence Prevalence - Large pool of patients, all with prostate-related disease.
  • Outpatient Surgery Trend - ASC growth enlarges procedure's availability in the market.
  • Heavy Presence of Manufacturers - Big international manufacturers of prosthetic devices manufacture and innovate locally.
  • Favorable Reimbursement Models - Medicare and private insurances subsidizing procedures affordably and increase access.
  • Campaigns on Awareness of Patients: Enhanced education regarding availability of prosthetics improves patients' receptiveness to intervention.
Country CAGR (2025 to 2035)
United States 3.2%

Germany

Market Outlook

High rates of age-related incontinence and prostate procedures fuel the market in Germany. Strong reimbursement schemes support the continuation of procedural development, while urologist-led outpatient treatment models sustain this development. The technological advancement concerning preference among patients for among the best minimal invasive prosthesis places Germany right at the forefront of high quality prosthetic treatment in the European market.

Market Growth Factors

  • Aging Population: High percentage of aged-in people enhances the need for urinary and erectile prosthetic solutions.
  • Sophisticated Health Care Infrastructure: The availability of advanced hospitals and outpatient surgical facilities promotes the performance of procedures.
  • Insurance Coverage: The broad reimbursement for urologic procedures increased the use of high-quality prosthetics.
  • Surgical Skills: Established networks in urology training subspecialties maximize procedural volume.
  • Innovation Pipeline: Strong support for domestic R&D to enhance implant materials and reduce infection risk drives market growth.

Market Forecast

Country CAGR (2025 to 2035)
Germany 3.8%

India

Market Outlook

The market is growing in India due to better health infrastructure, growing awareness of genitourinary diseases, and an emerging middle class willing to seek elective treatments. Historically underpenetrated by urbanization and better training of surgeons, access is now much wider. Prosthetics will become more widely accessible in years to come due to local manufacturing initiatives and innovations driven by affordability.

Market Growth Factors

  • Increasing Urological Disorders: Increased prevalence of prostate cancer and lifestyle-related urogenital diseases.
  • Modernizing Healthcare: From these, there is an increased growth of tertiary hospitals and urology clinics within metropolitan cities.
  • Training Initiatives: Urologic societies that encourage hands-on training for prosthetics implants.
  • Development of Cheap Products: Indian manufacturers producing cheaper substitutes for wider penetration.
  • Health Initiatives of Governments: Programs such as Ayushman Bharat increase surgical access among low-income populations.

Market Forecast

Country CAGR (2025 to 2035)
India 5.6%

China

Fast rising chronic diseases in the country, a large ageing male population, and even having increased prostate cancer surgeries have contributed to the increase in the genitourinary prosthetics market in China. The efforts of the government towards increasing the accessibility of surgeries and the continuous urological trainings held by the clinicians have in fact opened the doors for rural markets. Local manufacture and product clearances are also part of the driving forces in increasing adoption by an unmapped area of patient pool.

Market Growth Drivers

  • Enlarged Older Population: More incidences of erectile dysfunction and urinary disorders due to age.
  • Policy Reform on Healthcare: Government support for management of chronic diseases and surgery innovation.
  • Increase in Domestic Manufacturing: More domestically produced products thus reduce cost and shortens approval times of devices.
  • Urologists Training Programs: Fast-tracking skills development in genitourinary procedure at the region.
  • Bridging Rural-Urban Access: The markets depth stimulated by efforts for better surgical care in tier 2 and tier 3 cities.
Country CAGR (2025 to 2035)
China 6.2%

Japan

Japan has a super aged population and strong national health coverage, and there is increasing demand for urinary sphincter and penile implants. Long-run outlook is stable as societal attitudes and advocacy by physicians are changing perception about conservative uptake which was historically influenced by traditional attitudes. Rigorous surgical arrangements based on precision and calling into consideration quality of improvement in life are key determinants in the building of a stable long term market outlook.

Market Growth Drivers

  • Super-aged Society: Demographic of the aged driving demand for incontinence and erectile dysfunction treatment.
  • Cultural Change: Evolving patient mentality toward value quality life surgery and prosthetic intervention over time.
  • Integrated Health System: Simplified specialist referral and universal coverage enhance patient pathways.
  • High-Tech Surgical Ecosystem: Precision-aspect healthcare fuels adoption of minimally invasive implants.
  • Clinical Data Emphasis: Long-term safety and efficacy data favor high-end product use.
Country CAGR (2025 to 2035)
Japan 4.8%

Competitive Outlook

The players in the market are continuously innovating material usage, patient-controlled devices, and implantation procedures to stay abreast with technology. The two pillars that have to ensure regulation in terms of safety and efficacy are FDA (Food and Drug Administration) and EMA (European Medicines Agency), which ultimately drive the future of product development.

The MNEs are ahead of the local manufacturers with robust clinical pipelines and more involvement with surgeons. However, local manufacturers have fastened their seatbelts on this front because they will provide affordable implants custom-made for the locality. Price consciousness in developing markets makes it worse-off competition, and both multinationals and local players feel compelled to strengthen value-based offerings and extend geographic reach.

Other Key Players

  • UroMed
  • Advin Healthcare
  • Qualigen Therapeutics, Inc.
  • Abbott
  • Rigicon Inc.
  • KARL STORZ GmbH and Co. KG

Key Segmentation

By Product Type:

The market is segmented into Devices (Catheter, Electronic Stimulator Device, and Stent), Implants (Artificial Urinary Sphincter Implants (AUS), Inflatable Penile Implant (IPP), Testicular Prosthetic Implants), and Grafts (Synthetic Mesh, Biological Mesh, Allograft, Xenograft, and Suture Anchors).

By Material Type:

The market is segmented into Silicon, Titanium, and Apatite.

By End User:

The market is segmented into Hospitals, Clinics, Rehabilitation Centers, and Outpatient Surgical Centers.

By Region:

Regionally Market is analyzed across North America, Latin America, Western Europe, Eastern Europe, East Asia, South Asia & Pacific, and the Middle East & Africa.

Table of Content

  1. Executive Summary
  2. Industry Introduction, including Taxonomy and Market Definition
  3. Market Trends and Success Factors, including Macro-Economic Factors, Market Dynamics, and Recent Industry Developments
  4. Global Market Demand (Value in USD) and Volume (Units) Analysis 2020 to 2024 and Forecast 2025 to 2035, including Historical Analysis and Future Projections
  5. Global Market - Pricing Analysis
  6. Global Market Analysis 2020 to 2024 and Forecast 2025 to 2035
    • By Product
    • By Material Type
    • By End User
    • By Region
  7. Global Market Analysis 2020 to 2024 and Forecast 2025 to 2035, By Product
    • Devices
      • Catheter
      • Electronic Stimulator Device
      • Stent
    • Implants
      • Artificial Urinary Sphincter Implants (AUS)
      • Inflatable Penile Implant (IPP)
      • Testicular Prosthetic Implants
    • Grafts
      • Synthetic Mesh
      • Biological Mesh
      • Allograft
      • Xenograft
      • Suture Anchors
  8. Global Market Analysis 2020 to 2024 and Forecast 2025 to 2035, By Material Type
    • Silicon
    • Titanium
    • Apatite
  9. Global Market Analysis 2020 to 2024 and Forecast 2025 to 2035, By End User
    • Hospital
    • Clinics
    • Rehabilitation Centers
    • Outpatient Surgical Centers
  10. Global Market Analysis 2020 to 2024 and Forecast 2025 to 2035, By Region
    • North America
    • Latin America
    • Western Europe
    • Eastern Europe
    • South Asia & Pacific
    • East Asia
    • Middle East & Africa
  11. North America Sales Analysis 2020 to 2024 and Forecast 2025 to 2035, by Key Segments and Countries
  12. Latin America Sales Analysis 2020 to 2024 and Forecast 2025 to 2035, by Key Segments and Countries
  13. Western Europe Sales Analysis 2020 to 2024 and Forecast 2025 to 2035, by Key Segments and Countries
  14. Eastern Europe Sales Analysis 2020 to 2024 and Forecast 2025 to 2035, by Key Segments and Countries
  15. South Asia & Pacific Sales Analysis 2020 to 2024 and Forecast 2025 to 2035, by Key Segments and Countries
  16. East Asia Sales Analysis 2020 to 2024 and Forecast 2025 to 2035, by Key Segments and Countries
  17. Middle East and Africa Sales Analysis 2020 to 2024 and Forecast 2025 to 2035, by Key Segments and Countries
  18. Sales Forecast 2025 to 2035 By Product, By Material Type and by End User for 30 Countries
  19. Competition Outlook, including Market Structure Analysis, Company Share Analysis by Key Players, and Competition Dashboard
  20. Company Profile
    • Boston Scientific Corporation
    • Zephyr Surgical Implants SÀRL
    • Coloplast Care
    • Promedon
    • UroMed
    • Advin Healthcare
    • Qualigen Therapeutics, Inc.
    • Abbott
    • Rigicon Inc.
    • KARL STORZ GmbH and Co. KG

List of Tables

  • Table 1: Global Market Value (USD Million) Forecast by Region, 2020 to 2035
  • Table 2: Global Market Volume (Units) Forecast by Region, 2020 to 2035
  • Table 3: Global Market Value (USD Million) Forecast by Product Type, 2020 to 2035
  • Table 4: Global Market Volume (Units) Forecast by Product Type, 2020 to 2035
  • Table 5: Global Market Value (USD Million) Forecast by Material Type, 2020 to 2035
  • Table 6: Global Market Volume (Units) Forecast by Material Type, 2020 to 2035
  • Table 7: Global Market Value (USD Million) Forecast by End User, 2020 to 2035
  • Table 8: Global Market Volume (Units) Forecast by End User, 2020 to 2035
  • Table 9: North America Market Value (USD Million) Forecast by Country, 2020 to 2035
  • Table 10: North America Market Volume (Units) Forecast by Country, 2020 to 2035
  • Table 11: North America Market Value (USD Million) Forecast by Product Type, 2020 to 2035
  • Table 12: North America Market Volume (Units) Forecast by Product Type, 2020 to 2035
  • Table 13: North America Market Value (USD Million) Forecast by Material Type, 2020 to 2035
  • Table 14: North America Market Volume (Units) Forecast by Material Type, 2020 to 2035
  • Table 15: North America Market Value (USD Million) Forecast by End User, 2020 to 2035
  • Table 16: North America Market Volume (Units) Forecast by End User, 2020 to 2035
  • Table 17: Latin America Market Value (USD Million) Forecast by Country, 2020 to 2035
  • Table 18: Latin America Market Volume (Units) Forecast by Country, 2020 to 2035
  • Table 19: Latin America Market Value (USD Million) Forecast by Product Type, 2020 to 2035
  • Table 20: Latin America Market Volume (Units) Forecast by Product Type, 2020 to 2035
  • Table 21: Latin America Market Value (USD Million) Forecast by Material Type, 2020 to 2035
  • Table 22: Latin America Market Volume (Units) Forecast by Material Type, 2020 to 2035
  • Table 23: Latin America Market Value (USD Million) Forecast by End User, 2020 to 2035
  • Table 24: Latin America Market Volume (Units) Forecast by End User, 2020 to 2035
  • Table 25: Western Europe Market Value (USD Million) Forecast by Country, 2020 to 2035
  • Table 26: Western Europe Market Volume (Units) Forecast by Country, 2020 to 2035
  • Table 27: Western Europe Market Value (USD Million) Forecast by Product Type, 2020 to 2035
  • Table 28: Western Europe Market Volume (Units) Forecast by Product Type, 2020 to 2035
  • Table 29: Western Europe Market Value (USD Million) Forecast by Material Type, 2020 to 2035
  • Table 30: Western Europe Market Volume (Units) Forecast by Material Type, 2020 to 2035
  • Table 31: Western Europe Market Value (USD Million) Forecast by End User, 2020 to 2035
  • Table 32: Western Europe Market Volume (Units) Forecast by End User, 2020 to 2035
  • Table 33: Eastern Europe Market Value (USD Million) Forecast by Country, 2020 to 2035
  • Table 34: Eastern Europe Market Volume (Units) Forecast by Country, 2020 to 2035
  • Table 35: Eastern Europe Market Value (USD Million) Forecast by Product Type, 2020 to 2035
  • Table 36: Eastern Europe Market Volume (Units) Forecast by Product Type, 2020 to 2035
  • Table 37: Eastern Europe Market Value (USD Million) Forecast by Material Type, 2020 to 2035
  • Table 38: Eastern Europe Market Volume (Units) Forecast by Material Type, 2020 to 2035
  • Table 39: Eastern Europe Market Value (USD Million) Forecast by End User, 2020 to 2035
  • Table 40: Eastern Europe Market Volume (Units) Forecast by End User, 2020 to 2035
  • Table 41: South Asia and Pacific Market Value (USD Million) Forecast by Country, 2020 to 2035
  • Table 42: South Asia and Pacific Market Volume (Units) Forecast by Country, 2020 to 2035
  • Table 43: South Asia and Pacific Market Value (USD Million) Forecast by Product Type, 2020 to 2035
  • Table 44: South Asia and Pacific Market Volume (Units) Forecast by Product Type, 2020 to 2035
  • Table 45: South Asia and Pacific Market Value (USD Million) Forecast by Material Type, 2020 to 2035
  • Table 46: South Asia and Pacific Market Volume (Units) Forecast by Material Type, 2020 to 2035
  • Table 47: South Asia and Pacific Market Value (USD Million) Forecast by End User, 2020 to 2035
  • Table 48: South Asia and Pacific Market Volume (Units) Forecast by End User, 2020 to 2035
  • Table 49: East Asia Market Value (USD Million) Forecast by Country, 2020 to 2035
  • Table 50: East Asia Market Volume (Units) Forecast by Country, 2020 to 2035
  • Table 51: East Asia Market Value (USD Million) Forecast by Product Type, 2020 to 2035
  • Table 52: East Asia Market Volume (Units) Forecast by Product Type, 2020 to 2035
  • Table 53: East Asia Market Value (USD Million) Forecast by Material Type, 2020 to 2035
  • Table 54: East Asia Market Volume (Units) Forecast by Material Type, 2020 to 2035
  • Table 55: East Asia Market Value (USD Million) Forecast by End User, 2020 to 2035
  • Table 56: East Asia Market Volume (Units) Forecast by End User, 2020 to 2035
  • Table 57: Middle East and Africa Market Value (USD Million) Forecast by Country, 2020 to 2035
  • Table 58: Middle East and Africa Market Volume (Units) Forecast by Country, 2020 to 2035
  • Table 59: Middle East and Africa Market Value (USD Million) Forecast by Product Type, 2020 to 2035
  • Table 60: Middle East and Africa Market Volume (Units) Forecast by Product Type, 2020 to 2035
  • Table 61: Middle East and Africa Market Value (USD Million) Forecast by Material Type, 2020 to 2035
  • Table 62: Middle East and Africa Market Volume (Units) Forecast by Material Type, 2020 to 2035
  • Table 63: Middle East and Africa Market Value (USD Million) Forecast by End User, 2020 to 2035
  • Table 64: Middle East and Africa Market Volume (Units) Forecast by End User, 2020 to 2035

List of Figures

  • Figure 1: Global Market Value (USD Million) by Product Type, 2025 to 2035
  • Figure 2: Global Market Value (USD Million) by Material Type, 2025 to 2035
  • Figure 3: Global Market Value (USD Million) by End User, 2025 to 2035
  • Figure 4: Global Market Value (USD Million) by Region, 2025 to 2035
  • Figure 5: Global Market Value (USD Million) Analysis by Region, 2020 to 2035
  • Figure 6: Global Market Volume (Units) Analysis by Region, 2020 to 2035
  • Figure 7: Global Market Value Share (%) and BPS Analysis by Region, 2025 to 2035
  • Figure 8: Global Market Y-o-Y Growth (%) Projections by Region, 2025 to 2035
  • Figure 9: Global Market Value (USD Million) Analysis by Product Type, 2020 to 2035
  • Figure 10: Global Market Volume (Units) Analysis by Product Type, 2020 to 2035
  • Figure 11: Global Market Value Share (%) and BPS Analysis by Product Type, 2025 to 2035
  • Figure 12: Global Market Y-o-Y Growth (%) Projections by Product Type, 2025 to 2035
  • Figure 13: Global Market Value (USD Million) Analysis by Material Type, 2020 to 2035
  • Figure 14: Global Market Volume (Units) Analysis by Material Type, 2020 to 2035
  • Figure 15: Global Market Value Share (%) and BPS Analysis by Material Type, 2025 to 2035
  • Figure 16: Global Market Y-o-Y Growth (%) Projections by Material Type, 2025 to 2035
  • Figure 17: Global Market Value (USD Million) Analysis by End User, 2020 to 2035
  • Figure 18: Global Market Volume (Units) Analysis by End User, 2020 to 2035
  • Figure 19: Global Market Value Share (%) and BPS Analysis by End User, 2025 to 2035
  • Figure 20: Global Market Y-o-Y Growth (%) Projections by End User, 2025 to 2035
  • Figure 21: Global Market Attractiveness by Product Type, 2025 to 2035
  • Figure 22: Global Market Attractiveness by Material Type, 2025 to 2035
  • Figure 23: Global Market Attractiveness by End User, 2025 to 2035
  • Figure 24: Global Market Attractiveness by Region, 2025 to 2035
  • Figure 25: North America Market Value (USD Million) by Product Type, 2025 to 2035
  • Figure 26: North America Market Value (USD Million) by Material Type, 2025 to 2035
  • Figure 27: North America Market Value (USD Million) by End User, 2025 to 2035
  • Figure 28: North America Market Value (USD Million) by Country, 2025 to 2035
  • Figure 29: North America Market Value (USD Million) Analysis by Country, 2020 to 2035
  • Figure 30: North America Market Volume (Units) Analysis by Country, 2020 to 2035
  • Figure 31: North America Market Value Share (%) and BPS Analysis by Country, 2025 to 2035
  • Figure 32: North America Market Y-o-Y Growth (%) Projections by Country, 2025 to 2035
  • Figure 33: North America Market Value (USD Million) Analysis by Product Type, 2020 to 2035
  • Figure 34: North America Market Volume (Units) Analysis by Product Type, 2020 to 2035
  • Figure 35: North America Market Value Share (%) and BPS Analysis by Product Type, 2025 to 2035
  • Figure 36: North America Market Y-o-Y Growth (%) Projections by Product Type, 2025 to 2035
  • Figure 37: North America Market Value (USD Million) Analysis by Material Type, 2020 to 2035
  • Figure 38: North America Market Volume (Units) Analysis by Material Type, 2020 to 2035
  • Figure 39: North America Market Value Share (%) and BPS Analysis by Material Type, 2025 to 2035
  • Figure 40: North America Market Y-o-Y Growth (%) Projections by Material Type, 2025 to 2035
  • Figure 41: North America Market Value (USD Million) Analysis by End User, 2020 to 2035
  • Figure 42: North America Market Volume (Units) Analysis by End User, 2020 to 2035
  • Figure 43: North America Market Value Share (%) and BPS Analysis by End User, 2025 to 2035
  • Figure 44: North America Market Y-o-Y Growth (%) Projections by End User, 2025 to 2035
  • Figure 45: North America Market Attractiveness by Product Type, 2025 to 2035
  • Figure 46: North America Market Attractiveness by Material Type, 2025 to 2035
  • Figure 47: North America Market Attractiveness by End User, 2025 to 2035
  • Figure 48: North America Market Attractiveness by Country, 2025 to 2035
  • Figure 49: Latin America Market Value (USD Million) by Product Type, 2025 to 2035
  • Figure 50: Latin America Market Value (USD Million) by Material Type, 2025 to 2035
  • Figure 51: Latin America Market Value (USD Million) by End User, 2025 to 2035
  • Figure 52: Latin America Market Value (USD Million) by Country, 2025 to 2035
  • Figure 53: Latin America Market Value (USD Million) Analysis by Country, 2020 to 2035
  • Figure 54: Latin America Market Volume (Units) Analysis by Country, 2020 to 2035
  • Figure 55: Latin America Market Value Share (%) and BPS Analysis by Country, 2025 to 2035
  • Figure 56: Latin America Market Y-o-Y Growth (%) Projections by Country, 2025 to 2035
  • Figure 57: Latin America Market Value (USD Million) Analysis by Product Type, 2020 to 2035
  • Figure 58: Latin America Market Volume (Units) Analysis by Product Type, 2020 to 2035
  • Figure 59: Latin America Market Value Share (%) and BPS Analysis by Product Type, 2025 to 2035
  • Figure 60: Latin America Market Y-o-Y Growth (%) Projections by Product Type, 2025 to 2035
  • Figure 61: Latin America Market Value (USD Million) Analysis by Material Type, 2020 to 2035
  • Figure 62: Latin America Market Volume (Units) Analysis by Material Type, 2020 to 2035
  • Figure 63: Latin America Market Value Share (%) and BPS Analysis by Material Type, 2025 to 2035
  • Figure 64: Latin America Market Y-o-Y Growth (%) Projections by Material Type, 2025 to 2035
  • Figure 65: Latin America Market Value (USD Million) Analysis by End User, 2020 to 2035
  • Figure 66: Latin America Market Volume (Units) Analysis by End User, 2020 to 2035
  • Figure 67: Latin America Market Value Share (%) and BPS Analysis by End User, 2025 to 2035
  • Figure 68: Latin America Market Y-o-Y Growth (%) Projections by End User, 2025 to 2035
  • Figure 69: Latin America Market Attractiveness by Product Type, 2025 to 2035
  • Figure 70: Latin America Market Attractiveness by Material Type, 2025 to 2035
  • Figure 71: Latin America Market Attractiveness by End User, 2025 to 2035
  • Figure 72: Latin America Market Attractiveness by Country, 2025 to 2035
  • Figure 73: Western Europe Market Value (USD Million) by Product Type, 2025 to 2035
  • Figure 74: Western Europe Market Value (USD Million) by Material Type, 2025 to 2035
  • Figure 75: Western Europe Market Value (USD Million) by End User, 2025 to 2035
  • Figure 76: Western Europe Market Value (USD Million) by Country, 2025 to 2035
  • Figure 77: Western Europe Market Value (USD Million) Analysis by Country, 2020 to 2035
  • Figure 78: Western Europe Market Volume (Units) Analysis by Country, 2020 to 2035
  • Figure 79: Western Europe Market Value Share (%) and BPS Analysis by Country, 2025 to 2035
  • Figure 80: Western Europe Market Y-o-Y Growth (%) Projections by Country, 2025 to 2035
  • Figure 81: Western Europe Market Value (USD Million) Analysis by Product Type, 2020 to 2035
  • Figure 82: Western Europe Market Volume (Units) Analysis by Product Type, 2020 to 2035
  • Figure 83: Western Europe Market Value Share (%) and BPS Analysis by Product Type, 2025 to 2035
  • Figure 84: Western Europe Market Y-o-Y Growth (%) Projections by Product Type, 2025 to 2035
  • Figure 85: Western Europe Market Value (USD Million) Analysis by Material Type, 2020 to 2035
  • Figure 86: Western Europe Market Volume (Units) Analysis by Material Type, 2020 to 2035
  • Figure 87: Western Europe Market Value Share (%) and BPS Analysis by Material Type, 2025 to 2035
  • Figure 88: Western Europe Market Y-o-Y Growth (%) Projections by Material Type, 2025 to 2035
  • Figure 89: Western Europe Market Value (USD Million) Analysis by End User, 2020 to 2035
  • Figure 90: Western Europe Market Volume (Units) Analysis by End User, 2020 to 2035
  • Figure 91: Western Europe Market Value Share (%) and BPS Analysis by End User, 2025 to 2035
  • Figure 92: Western Europe Market Y-o-Y Growth (%) Projections by End User, 2025 to 2035
  • Figure 93: Western Europe Market Attractiveness by Product Type, 2025 to 2035
  • Figure 94: Western Europe Market Attractiveness by Material Type, 2025 to 2035
  • Figure 95: Western Europe Market Attractiveness by End User, 2025 to 2035
  • Figure 96: Western Europe Market Attractiveness by Country, 2025 to 2035
  • Figure 97: Eastern Europe Market Value (USD Million) by Product Type, 2025 to 2035
  • Figure 98: Eastern Europe Market Value (USD Million) by Material Type, 2025 to 2035
  • Figure 99: Eastern Europe Market Value (USD Million) by End User, 2025 to 2035
  • Figure 100: Eastern Europe Market Value (USD Million) by Country, 2025 to 2035
  • Figure 101: Eastern Europe Market Value (USD Million) Analysis by Country, 2020 to 2035
  • Figure 102: Eastern Europe Market Volume (Units) Analysis by Country, 2020 to 2035
  • Figure 103: Eastern Europe Market Value Share (%) and BPS Analysis by Country, 2025 to 2035
  • Figure 104: Eastern Europe Market Y-o-Y Growth (%) Projections by Country, 2025 to 2035
  • Figure 105: Eastern Europe Market Value (USD Million) Analysis by Product Type, 2020 to 2035
  • Figure 106: Eastern Europe Market Volume (Units) Analysis by Product Type, 2020 to 2035
  • Figure 107: Eastern Europe Market Value Share (%) and BPS Analysis by Product Type, 2025 to 2035
  • Figure 108: Eastern Europe Market Y-o-Y Growth (%) Projections by Product Type, 2025 to 2035
  • Figure 109: Eastern Europe Market Value (USD Million) Analysis by Material Type, 2020 to 2035
  • Figure 110: Eastern Europe Market Volume (Units) Analysis by Material Type, 2020 to 2035
  • Figure 111: Eastern Europe Market Value Share (%) and BPS Analysis by Material Type, 2025 to 2035
  • Figure 112: Eastern Europe Market Y-o-Y Growth (%) Projections by Material Type, 2025 to 2035
  • Figure 113: Eastern Europe Market Value (USD Million) Analysis by End User, 2020 to 2035
  • Figure 114: Eastern Europe Market Volume (Units) Analysis by End User, 2020 to 2035
  • Figure 115: Eastern Europe Market Value Share (%) and BPS Analysis by End User, 2025 to 2035
  • Figure 116: Eastern Europe Market Y-o-Y Growth (%) Projections by End User, 2025 to 2035
  • Figure 117: Eastern Europe Market Attractiveness by Product Type, 2025 to 2035
  • Figure 118: Eastern Europe Market Attractiveness by Material Type, 2025 to 2035
  • Figure 119: Eastern Europe Market Attractiveness by End User, 2025 to 2035
  • Figure 120: Eastern Europe Market Attractiveness by Country, 2025 to 2035
  • Figure 121: South Asia and Pacific Market Value (USD Million) by Product Type, 2025 to 2035
  • Figure 122: South Asia and Pacific Market Value (USD Million) by Material Type, 2025 to 2035
  • Figure 123: South Asia and Pacific Market Value (USD Million) by End User, 2025 to 2035
  • Figure 124: South Asia and Pacific Market Value (USD Million) by Country, 2025 to 2035
  • Figure 125: South Asia and Pacific Market Value (USD Million) Analysis by Country, 2020 to 2035
  • Figure 126: South Asia and Pacific Market Volume (Units) Analysis by Country, 2020 to 2035
  • Figure 127: South Asia and Pacific Market Value Share (%) and BPS Analysis by Country, 2025 to 2035
  • Figure 128: South Asia and Pacific Market Y-o-Y Growth (%) Projections by Country, 2025 to 2035
  • Figure 129: South Asia and Pacific Market Value (USD Million) Analysis by Product Type, 2020 to 2035
  • Figure 130: South Asia and Pacific Market Volume (Units) Analysis by Product Type, 2020 to 2035
  • Figure 131: South Asia and Pacific Market Value Share (%) and BPS Analysis by Product Type, 2025 to 2035
  • Figure 132: South Asia and Pacific Market Y-o-Y Growth (%) Projections by Product Type, 2025 to 2035
  • Figure 133: South Asia and Pacific Market Value (USD Million) Analysis by Material Type, 2020 to 2035
  • Figure 134: South Asia and Pacific Market Volume (Units) Analysis by Material Type, 2020 to 2035
  • Figure 135: South Asia and Pacific Market Value Share (%) and BPS Analysis by Material Type, 2025 to 2035
  • Figure 136: South Asia and Pacific Market Y-o-Y Growth (%) Projections by Material Type, 2025 to 2035
  • Figure 137: South Asia and Pacific Market Value (USD Million) Analysis by End User, 2020 to 2035
  • Figure 138: South Asia and Pacific Market Volume (Units) Analysis by End User, 2020 to 2035
  • Figure 139: South Asia and Pacific Market Value Share (%) and BPS Analysis by End User, 2025 to 2035
  • Figure 140: South Asia and Pacific Market Y-o-Y Growth (%) Projections by End User, 2025 to 2035
  • Figure 141: South Asia and Pacific Market Attractiveness by Product Type, 2025 to 2035
  • Figure 142: South Asia and Pacific Market Attractiveness by Material Type, 2025 to 2035
  • Figure 143: South Asia and Pacific Market Attractiveness by End User, 2025 to 2035
  • Figure 144: South Asia and Pacific Market Attractiveness by Country, 2025 to 2035
  • Figure 145: East Asia Market Value (USD Million) by Product Type, 2025 to 2035
  • Figure 146: East Asia Market Value (USD Million) by Material Type, 2025 to 2035
  • Figure 147: East Asia Market Value (USD Million) by End User, 2025 to 2035
  • Figure 148: East Asia Market Value (USD Million) by Country, 2025 to 2035
  • Figure 149: East Asia Market Value (USD Million) Analysis by Country, 2020 to 2035
  • Figure 150: East Asia Market Volume (Units) Analysis by Country, 2020 to 2035
  • Figure 151: East Asia Market Value Share (%) and BPS Analysis by Country, 2025 to 2035
  • Figure 152: East Asia Market Y-o-Y Growth (%) Projections by Country, 2025 to 2035
  • Figure 153: East Asia Market Value (USD Million) Analysis by Product Type, 2020 to 2035
  • Figure 154: East Asia Market Volume (Units) Analysis by Product Type, 2020 to 2035
  • Figure 155: East Asia Market Value Share (%) and BPS Analysis by Product Type, 2025 to 2035
  • Figure 156: East Asia Market Y-o-Y Growth (%) Projections by Product Type, 2025 to 2035
  • Figure 157: East Asia Market Value (USD Million) Analysis by Material Type, 2020 to 2035
  • Figure 158: East Asia Market Volume (Units) Analysis by Material Type, 2020 to 2035
  • Figure 159: East Asia Market Value Share (%) and BPS Analysis by Material Type, 2025 to 2035
  • Figure 160: East Asia Market Y-o-Y Growth (%) Projections by Material Type, 2025 to 2035
  • Figure 161: East Asia Market Value (USD Million) Analysis by End User, 2020 to 2035
  • Figure 162: East Asia Market Volume (Units) Analysis by End User, 2020 to 2035
  • Figure 163: East Asia Market Value Share (%) and BPS Analysis by End User, 2025 to 2035
  • Figure 164: East Asia Market Y-o-Y Growth (%) Projections by End User, 2025 to 2035
  • Figure 165: East Asia Market Attractiveness by Product Type, 2025 to 2035
  • Figure 166: East Asia Market Attractiveness by Material Type, 2025 to 2035
  • Figure 167: East Asia Market Attractiveness by End User, 2025 to 2035
  • Figure 168: East Asia Market Attractiveness by Country, 2025 to 2035
  • Figure 169: Middle East and Africa Market Value (USD Million) by Product Type, 2025 to 2035
  • Figure 170: Middle East and Africa Market Value (USD Million) by Material Type, 2025 to 2035
  • Figure 171: Middle East and Africa Market Value (USD Million) by End User, 2025 to 2035
  • Figure 172: Middle East and Africa Market Value (USD Million) by Country, 2025 to 2035
  • Figure 173: Middle East and Africa Market Value (USD Million) Analysis by Country, 2020 to 2035
  • Figure 174: Middle East and Africa Market Volume (Units) Analysis by Country, 2020 to 2035
  • Figure 175: Middle East and Africa Market Value Share (%) and BPS Analysis by Country, 2025 to 2035
  • Figure 176: Middle East and Africa Market Y-o-Y Growth (%) Projections by Country, 2025 to 2035
  • Figure 177: Middle East and Africa Market Value (USD Million) Analysis by Product Type, 2020 to 2035
  • Figure 178: Middle East and Africa Market Volume (Units) Analysis by Product Type, 2020 to 2035
  • Figure 179: Middle East and Africa Market Value Share (%) and BPS Analysis by Product Type, 2025 to 2035
  • Figure 180: Middle East and Africa Market Y-o-Y Growth (%) Projections by Product Type, 2025 to 2035
  • Figure 181: Middle East and Africa Market Value (USD Million) Analysis by Material Type, 2020 to 2035
  • Figure 182: Middle East and Africa Market Volume (Units) Analysis by Material Type, 2020 to 2035
  • Figure 183: Middle East and Africa Market Value Share (%) and BPS Analysis by Material Type, 2025 to 2035
  • Figure 184: Middle East and Africa Market Y-o-Y Growth (%) Projections by Material Type, 2025 to 2035
  • Figure 185: Middle East and Africa Market Value (USD Million) Analysis by End User, 2020 to 2035
  • Figure 186: Middle East and Africa Market Volume (Units) Analysis by End User, 2020 to 2035
  • Figure 187: Middle East and Africa Market Value Share (%) and BPS Analysis by End User, 2025 to 2035
  • Figure 188: Middle East and Africa Market Y-o-Y Growth (%) Projections by End User, 2025 to 2035
  • Figure 189: Middle East and Africa Market Attractiveness by Product Type, 2025 to 2035
  • Figure 190: Middle East and Africa Market Attractiveness by Material Type, 2025 to 2035
  • Figure 191: Middle East and Africa Market Attractiveness by End User, 2025 to 2035
  • Figure 192: Middle East and Africa Market Attractiveness by Country, 2025 to 2035

Frequently Asked Questions

What was the overall size of the Genitourinary Prosthetics Market in 2025?

The overall market size for genitourinary prosthetics market was USD 634.70 Million in 2025.

How big is the Genitourinary Prosthetics Market expected in 2035?

The genitourinary prosthetics market is expected to reach USD 1,014.3 Million in 2035.

What will drive the demand for Genitourinary Prosthetics Market during the forecast period?

Rising prevalence of urological disorders and technological advancements in prosthetics anticipates the growth of the genitourinary prosthetics market.

List the top 5 Key players of the Genitourinary Prosthetics Market?

The top key players that drives the development of genitourinary prosthetics market are Boston Scientific Corporation, Zephyr Surgical Implants SÀRL, Coloplast Care, Promedon and UroMed

Which segment in product is expected to lead in Genitourinary Prosthetics Market?

Devices segment by product type is expected to dominate the market during the forecast period.

Explore Similar Insights

Future Market Insights

Genitourinary Prosthetics Market