The Trends, Growth, and Opportunity Analysis of Shisha Tobacco in GCC Countries is estimated to be valued at USD 1186.4 billion in 2025 and is projected to reach USD 2206.1 billion by 2035, registering a compound annual growth rate (CAGR) of 6.4% over the forecast period.
The Shisha Tobacco market in GCC countries is experiencing robust expansion driven by cultural acceptance, tourism growth, and a rising preference for social leisure experiences among young adults. The region’s vibrant café and lounge culture has significantly contributed to the increasing consumption of shisha tobacco, with both locals and expatriates driving sustained demand. The market is also influenced by evolving consumer preferences toward premium and flavored tobacco varieties, aligning with global lifestyle trends.
Regulatory relaxation in certain regions and controlled legalization of shisha consumption within hospitality establishments have further enhanced market accessibility. Innovations in packaging, flavor profiles, and nicotine content are enabling manufacturers to attract diverse consumer groups. Additionally, the growing adoption of herbal and low-nicotine shisha products is reflecting the shift toward healthier alternatives.
Expansion of specialized shisha lounges, coupled with tourism development in destinations such as Dubai, Doha, and Riyadh, continues to boost the market As consumer experiences become more personalized, the GCC shisha tobacco market is expected to maintain strong momentum over the forecast period.
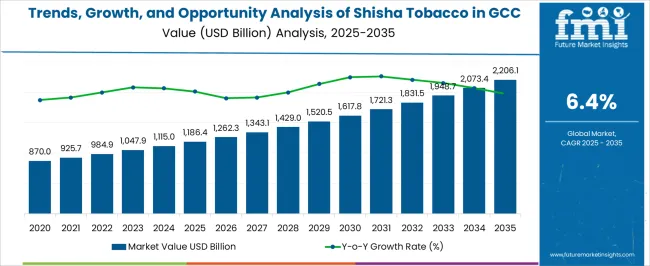
| Metric | Value |
|---|---|
| Trends, Growth, and Opportunity Analysis of Shisha Tobacco in GCC Countries Estimated Value in (2025 E) | USD 1186.4 billion |
| Trends, Growth, and Opportunity Analysis of Shisha Tobacco in GCC Countries Forecast Value in (2035 F) | USD 2206.1 billion |
| Forecast CAGR (2025 to 2035) | 6.4% |
The market is segmented by Various Types Of Shisha Tobacco, Flavor, End Users, and Sales Channel and region. By Various Types Of Shisha Tobacco, the market is divided into Strong Shisha Tobacco, Mild Shisha Tobacco, and Light Shisha Tobacco. In terms of Flavor, the market is classified into Fruit, Chocolate, Caramel, Mint, Blended, and Others. Based on End Users, the market is segmented into Casual Diver, Beginner/ New Diver, Active Diver, and Advanced/ Professional Diver. By Sales Channel, the market is divided into Direct Sales, Hypermarkets/ Supermarkets, Specialty Stores, Convenience Stores, Independent Small Stores, Online Retailers, and Other Sales Channel. Regionally, the market is classified into North America, Latin America, Western Europe, Eastern Europe, Balkan & Baltic Countries, Russia & Belarus, Central Asia, East Asia, South Asia & Pacific, and the Middle East & Africa.
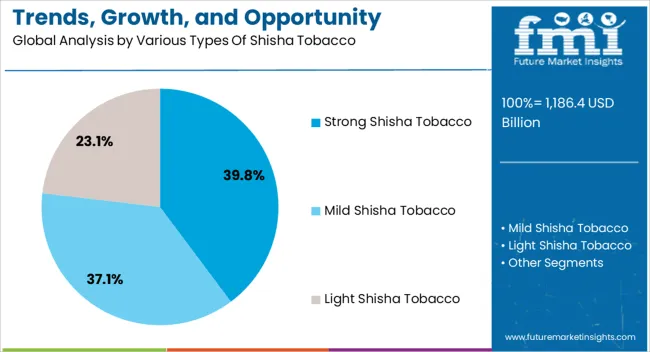
The strong shisha tobacco segment is projected to capture 39.8% of the market revenue in 2025, establishing itself as the dominant type. Growth in this segment is primarily attributed to its popularity among experienced smokers who prefer intense flavors and higher nicotine concentrations for a more satisfying experience. Strong shisha tobacco delivers a richer aroma and longer smoke duration, making it the preferred choice in traditional settings and premium lounges.
Manufacturers are increasingly focusing on quality refinement, using high-grade tobacco leaves and advanced curing methods to enhance consistency and flavor depth. This type also aligns with the cultural identity of shisha consumption across GCC countries, where authentic and bold experiences are valued.
The availability of strong shisha variants across retail and lounge channels, combined with product innovations in packaging and blend quality, is reinforcing its market dominance As consumers continue to seek stronger flavor profiles that align with traditional smoking habits, the strong shisha tobacco type is expected to retain its leadership position.
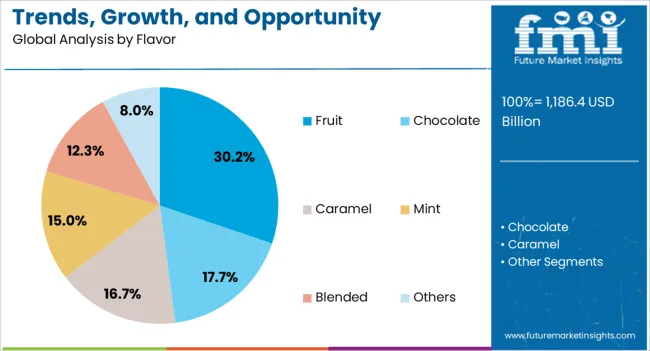
The fruit flavor segment is anticipated to hold 30.2% of the market revenue in 2025, making it the leading flavor category. The dominance of this segment stems from widespread consumer preference for fruity and refreshing blends such as apple, grape, and watermelon, which provide smoother and more aromatic smoking experiences. Fruit flavors are particularly popular among younger demographics and female consumers, as they offer a lighter and more enjoyable taste profile compared to traditional variants.
Manufacturers are expanding their flavor portfolios by introducing exotic fruit combinations and premium-grade ingredients to meet evolving consumer demands. The availability of fruit flavors across diverse price ranges and packaging formats further enhances accessibility.
Moreover, the trend of social smoking and flavored experiences in lounges and tourist destinations continues to support segment growth The balance between taste diversity, aroma richness, and modern appeal positions the fruit flavor segment as a key growth driver in the GCC shisha tobacco market, with steady expansion expected over the coming years.
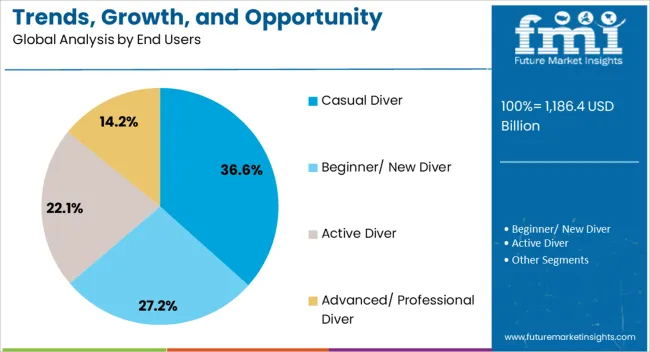
The casual diver segment is expected to account for 36.6% of the market revenue in 2025, establishing itself as the largest end-user group. This segment comprises occasional smokers who view shisha consumption as a recreational and social activity rather than a daily habit. The increasing popularity of shisha lounges, beachfront cafés, and rooftop venues across GCC cities has made casual smoking experiences more accessible and fashionable.
Younger adults and tourists represent a significant share of this segment, driven by the desire for social bonding and cultural immersion. Casual divers are also inclined toward lighter blends and flavored options that provide enjoyable experiences without the intensity of traditional shisha. The growing number of tourism-driven hospitality establishments offering premium shisha services has further expanded this consumer base.
Marketing strategies emphasizing lifestyle, leisure, and luxury have effectively attracted casual consumers As the region’s social and tourism sectors continue to flourish, the casual diver segment is expected to remain a major contributor to the GCC shisha tobacco market’s growth.
| Leading Product Type | Strong Shisha Tobacco |
|---|---|
| Value Share (2025) | 39.8% |
Strong shisha tobacco is predicted to seize a 39.80% value share in GCC countries. Surging demand for this product type is propelled by the strong perception that it is less harmful to health than regular tobacco. Additionally, the availability of many flavors is another factor that is raising sales of strong shisha tobacco.
| Leading Sales Channel | Direct Sales |
|---|---|
| Value Share (2025) | 23.5% |
Direct sales of shisha tobacco remain a prominent sales channel in GCC countries as cafes, lounges, and bars continue to buy shisha tobacco to attract customers to their venues.
The online segment is however emerging to be a key performer in this segment, multiplying at a significant pace. The rapid growth of this segment can be ascribed to cheaper prices for the same quality of shisha products. Other benefits of the online sales channel include free delivery, coupons, and other exclusive offers.
Saudi Arabia is a significant location for the key vendors of shisha tobacco. Lounges, hotels, and cafes in this country are increasingly purchasing shisha tobacco to lure customers. This is motivating direct sales of the product, and profiting many merchants.
Another key aspect that is increasing sales of shisha tobacco in Saudi Arabia is the surging perception among tourists that the shisha tobacco available in the country is of high quality. As a result, tourists visiting Saudi Arabia pay more to shisha tobacco vendors.
Weak regulatory framework in Saudi Arabia for tobacco usage is giving leeway for the sales of shisha tobacco to tourists visiting from other parts of the globe. Additionally, strict smoking bans in public areas in Saudi Arabia are propelling sales of hookah equipment for use in household and commercial sectors.
United Arab Emirates (UAE) is expected to be profitable for shisha tobacco businesses. Proliferating trend of chewing khat in the country is expanding the industry’s size. Additionally, increasing health concerns among consumers are creating demand for herbal shisha smoking.
UAE is witnessing the opening up of new establishments that offer the best-in-town shisha menu, served alongside mouth-watering nibbles and fantastic views. Growing demand for shisha tobacco at these “insta worthy” hotels, cafes, and other food establishments is expanding the scope of shisha tobacco in the country.
Shisha tobacco sales in Qatar are predicted to increase due to the count of bars, nightclubs, pubs, taverns, and lounges. Additionally, demand for different smoking accessories, such as hookah tobacco, is improving in Qatar owing to consumers’ hectic lifestyles and rising preference for socializing.
However, campaigns to inhibit smoking and ensure a smoke-free Majlises, which is the name used for the sitting room usually located within a home to socialize, entertain, and discuss issues and events, are expected to hamper the shisha tobacco sales in Qatar.
The shisha tobacco sales are surging in Kuwait, propelled by the cultural tradition of using shisha in the country. Strong influence by peers and families is a key determiner of this prevalent smoking habit. Additionally, the significant use of shisha tobacco among university students is raising prospects for shisha tobacco vendors.
Males with high incomes are the prominent users of shisha tobacco in Kuwait. Consumption of shisha tobacco is going to be influenced by mass media interventions, anti-smoking campaigns, and rising tobacco product taxes.
Increasing sales and consumption of shisha tobacco in Bahrain is pushing product sales. Merchants are thus selling their products online to capture a young and impressionable population seeking shisha tobacco. Vendors are emphasizing easy access to shisha tobacco across the country to rope in more customers.
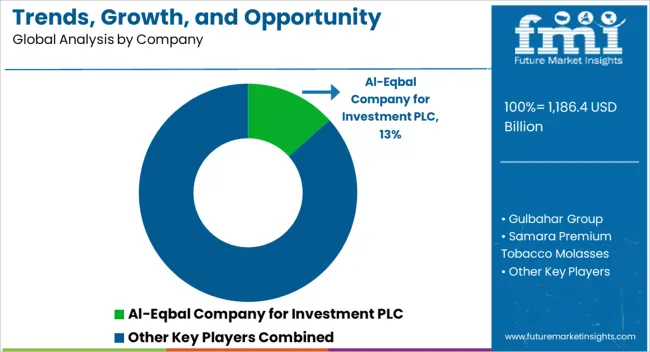
Key players are strengthening their presence in GCC countries by doubling down on different business strategies. Players are launching new products across borders to increase their reach. They are further coming into partnerships and collaborating with other players to increase their visibility.
Players are introducing shisha tobacco in several flavors and aromas like fruit flavors, lavender, pistachio, mint green apple, etc. These flavors appeal to the young population, which forms a large consumer base for shisha tobacco. Participants are continuously improving the taste of their shisha tobacco products as per the customers' feedback.
Shisha tobacco vendors are now focusing on online retail channels to distribute their offerings. Since online channel eliminates the role of middlemen, players save money and sell their products at a cheaper price point to their customers, creating a win-win situation for both parties. Growing preference for online retailers is also driven by several benefits unavailable offline. These include discounts, free and quick delivery, redeemable coupons, etc.
Latest Developments that are Influencing the Shisha Tobacco Industry in GCC Countries
The global trends, growth, and opportunity analysis of shisha tobacco in gcc countries is estimated to be valued at USD 1,186.4 billion in 2025.
The market size for the trends, growth, and opportunity analysis of shisha tobacco in gcc countries is projected to reach USD 2,206.1 billion by 2035.
The trends, growth, and opportunity analysis of shisha tobacco in gcc countries is expected to grow at a 6.4% CAGR between 2025 and 2035.
The key product types in trends, growth, and opportunity analysis of shisha tobacco in gcc countries are strong shisha tobacco, mild shisha tobacco and light shisha tobacco.
In terms of flavor, fruit segment to command 30.2% share in the trends, growth, and opportunity analysis of shisha tobacco in gcc countries in 2025.


Full Research Suite comprises of:
Market outlook & trends analysis
Interviews & case studies
Strategic recommendations
Vendor profiles & capabilities analysis
5-year forecasts
8 regions and 60+ country-level data splits
Market segment data splits
12 months of continuous data updates
DELIVERED AS:
PDF EXCEL ONLINE
Trends, Growth, and Opportunity Analysis of Drinking Water in Saudi Arabia Forecast and Outlook 2025 to 2035
Trends, Growth, and Opportunity Analysis of Culinary Tourism in Italy Size and Share Forecast Outlook 2025 to 2035
Monaco Casino Tourism Industry Trends – Growth & Forecast through 2034
Trends, Growth, and Opportunity Analysis of Sustainable Tourism in Thailand Size and Share Forecast Outlook 2025 to 2035
Indonesia Sustainable Tourism Market Growth – Forecast 2024-2034
Trends, Growth, and Opportunity Analysis of Micro-investing Platform in Australia Size and Share Forecast Outlook 2025 to 2035
Trends, Growth, and Opportunity Analysis of Tourism in Burma Size and Share Forecast Outlook 2025 to 2035
US Luxury Fine Jewelry Market Insights 2024 to 2034
Trends, Growth, and Opportunity Analysis of Pea Protein in South Korea Size and Share Forecast Outlook 2025 to 2035
Trends, Growth, and Opportunity Analysis of Rail Tourism in Europe Size and Share Forecast Outlook 2025 to 2035
Trends, Growth, and Opportunity Analysis of Sports Tourism in South Africa Size and Share Forecast Outlook 2025 to 2035
UK Medical Tourism Market Analysis – Growth & Forecast 2024-2034
Trends, Growth, and Opportunity Analysis of Outbound Tourism in France Forecast and Outlook 2025 to 2035
Trends, Growth, and Opportunity Analysis of Outbound Tourism in China Market Forecast and Outlook 2025 to 2035
United States Outbound Tourism Market Analysis - Size, Share, and Forecast 2024 to 2034
Trends, Growth, and Opportunity Analysis of Outbound Tourism in GCC Countries Size and Share Forecast Outlook 2025 to 2035
Trends, Growth, and Opportunity Analysis of Data Center Facility in Morocco Size and Share Forecast Outlook 2025 to 2035
Europe Connected Car Market Growth - Trends & Forecast through 2034
Trends, Growth, Opportunity Analysis of Medical Tourism in Thailand Size and Share Forecast Outlook 2025 to 2035
Hair Regrowth Treatments Market Size and Share Forecast Outlook 2025 to 2035

Thank you!
You will receive an email from our Business Development Manager. Please be sure to check your SPAM/JUNK folder too.
Chat With
MaRIA