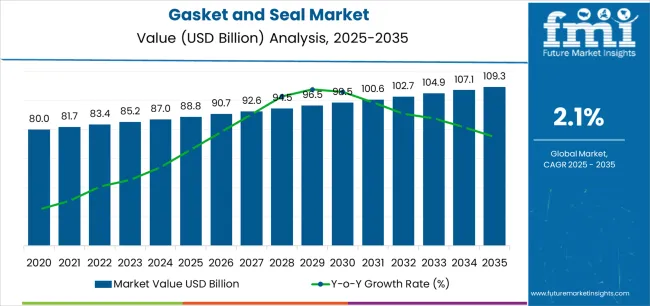
The gasket and seal market stands at the threshold of a decade-long expansion trajectory that promises to reshape sealing technology and fluid containment solutions. The market's journey from USD 88.8 billion in 2025 to USD 109.3 billion by 2035 represents substantial growth, demonstrating the accelerating adoption of advanced sealing materials and performance optimization across automotive manufacturing, industrial equipment, and emerging energy sectors.
The first half of the decade (2025-2030) will witness the market climbing from USD 88.8 billion to approximately USD 98.5 billion, adding USD 9.7 billion in value, which constitutes 47% of the total forecast growth period. This phase will be characterized by the rapid adoption of advanced elastomer systems, driven by increasing automotive production volumes and the growing need for high-performance sealing solutions worldwide. Enhanced material capabilities and thermal resistance features will become standard expectations rather than premium options.
The latter half (2030-2035) will witness continued growth from USD 98.5 billion to USD 109.3 billion, representing an addition of USD 10.8 billion or 53% of the decade's expansion. This period will be defined by mass market penetration of hydrogen-compatible sealing technologies, integration with comprehensive fluid management platforms, and seamless compatibility with emerging mobility infrastructure. The market trajectory signals fundamental shifts in how automotive and industrial sectors approach sealing performance and contamination prevention, with participants positioned to benefit from growing demand across multiple material types and application segments.
| Period | Primary Revenue Buckets | Share | Notes |
|---|---|---|---|
| Today | Automotive OEM sealing systems | 42% | Engine, transmission, chassis applications |
| Industrial machinery seals | 28% | Hydraulic, pneumatic, rotary equipment | |
| Aftermarket replacement parts | 15% | Service kits, maintenance components | |
| Energy & chemicals sector | 10% | Oil & gas, petrochemical processing | |
| Specialty applications (aerospace, electronics) | 5% | High-performance, precision sealing | |
| Future (3-5 yrs) | EV & hydrogen mobility seals | 18-22% | Battery cooling, fuel-cell stacks, H₂ systems |
| Traditional automotive seals | 28-32% | ICE engines declining, thermal management growing | |
| Industrial automation & robotics | 16-20% | Precision seals, miniaturized components | |
| Renewable energy & hydrogen infrastructure | 8-12% | Electrolyzers, compression, storage systems | |
| Process industries (chemicals/pharma) | 10-14% | Sanitary seals, compliance-driven upgrades | |
| Aftermarket & service | 12-15% | Extended maintenance cycles, premium kits | |
| Aerospace & defense | 4-6% | High-temperature, specialized materials |
| Metric | Value |
|---|---|
| Market Value (2025) | USD 88.8 billion |
| Market Forecast (2035) | USD 109.3 billion |
| Growth Rate | 2.1% CAGR |
| Leading Product Technology | Seals |
| Primary Application | Automotive Segment |
The market demonstrates strong fundamentals with seal products capturing dominant share through advanced fluid containment capabilities and automotive manufacturing optimization. Automotive applications drive primary demand, supported by increasing vehicle production and powertrain sealing requirements. Geographic expansion remains concentrated in developed markets with established automotive infrastructure, while emerging economies show accelerating adoption rates driven by manufacturing localization initiatives and rising quality standards.
Primary Classification: The market segments by product type into seals (including O-rings, rotary shaft seals, hydraulic seals, oil seals, and other seal types) and gaskets, representing the evolution from basic sealing components to sophisticated fluid management solutions for comprehensive automotive and industrial optimization.
Secondary Classification: Material type segmentation divides the market into non-metallic materials (including rubber/elastomers, PTFE, graphite, thermoplastic composites, and other non-metallics) and metallic materials, reflecting distinct requirements for chemical resistance, temperature capability, and operational durability standards.
Tertiary Classification: End-use segmentation covers automotive applications (including engine and powertrain, transmission and driveline, EV and hybrid systems, chassis/HVAC/thermal, and aftermarket service kits), industrial machinery, oil and gas, chemical processing, and other sectors.
Regional Classification: Geographic distribution covers North America, Latin America, Western Europe, Eastern Europe, East Asia, South Asia Pacific, and Middle East & Africa, with developed markets leading adoption while emerging economies show accelerating growth patterns driven by manufacturing expansion programs.
The segmentation structure reveals technology progression from standard sealing components toward sophisticated material systems with enhanced performance and compatibility capabilities, while application diversity spans from automotive powertrains to hydrogen infrastructure requiring comprehensive fluid containment solutions.
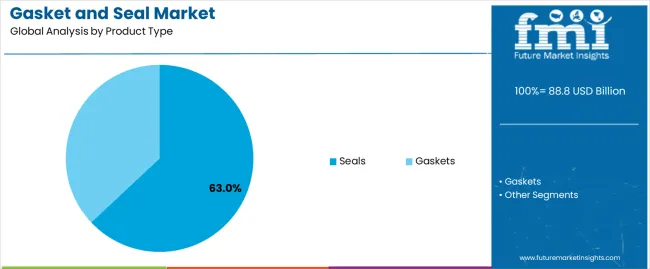
Market Position: Seals command the leading position in the gasket and seal market with 63.0% market share through advanced fluid containment features, including superior dynamic sealing capability, operational versatility, and automotive manufacturing optimization that enable production facilities to achieve reliable leak prevention across diverse mechanical systems and industrial equipment environments.
Value Drivers: The segment benefits from automotive and industrial preference for dynamic sealing systems that provide consistent performance under motion, reduced maintenance requirements, and operational longevity without requiring frequent replacement. Advanced design features enable application-specific configurations, material optimization, and integration with existing mechanical systems, where sealing reliability and operational efficiency represent critical equipment requirements.
Competitive Advantages: Seal products differentiate through proven operational reliability, diverse application compatibility, and integration with comprehensive fluid management systems that enhance equipment effectiveness while maintaining optimal performance standards suitable for automotive, hydraulic, and rotary applications.
Key market characteristics:
Within the seals segment, O-rings maintain the dominant subsegment position with 28.0% of total market share due to their universal application versatility and cost-effective sealing performance. These components appeal to manufacturers requiring standardized sealing solutions with broad compatibility for static and dynamic applications. Market strength is driven by automotive expansion and industrial automation, emphasizing reliable sealing solutions and design simplicity through standardized configurations.
Rotary shaft seals capture 12.0% of total market share through specialized requirements in rotating equipment, automotive drivetrains, and industrial machinery requiring dynamic sealing at shaft interfaces. Hydraulic seals hold 9.0% of total market share, oil seals account for 7.0%, while other seals including diaphragm, lip seals, and packings represent 7.0% through specialized sealing applications.
Gaskets capture 37.0% market share through static sealing requirements in flanged connections, engine assemblies, and industrial equipment requiring compression-based sealing solutions and surface conformability.
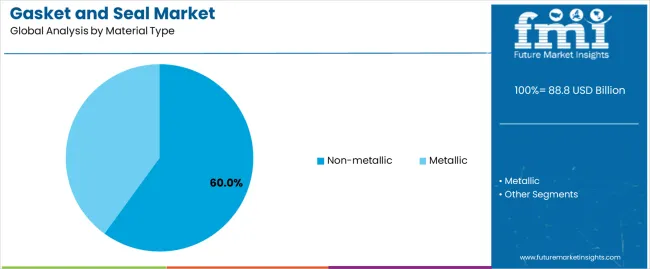
Market Context: Non-metallic materials demonstrate the dominant market position in the gasket and seal market with 60.0% market share due to widespread adoption of elastomer systems and increasing focus on chemical resistance, temperature flexibility, and application versatility that maximize sealing performance while maintaining cost effectiveness.
Appeal Factors: Non-metallic material users prioritize chemical compatibility, elasticity properties, and adaptability to diverse operating conditions that enable effective sealing operations across multiple industries and equipment types. The segment benefits from substantial automotive investment and material innovation programs that emphasize the development of advanced elastomer systems for sealing optimization and performance enhancement applications.
Growth Drivers: Automotive electrification programs incorporate advanced non-metallic seals for thermal management, while hydrogen infrastructure development increases demand for specialized elastomer capabilities that comply with permeation standards and minimize gas escape risks.
Market Challenges: Temperature limitations and chemical compatibility restrictions may limit material selection in extreme operating environments or aggressive chemical exposure scenarios.
Application dynamics include:
Within non-metallic materials, rubber and elastomers maintain the dominant position with 38.0% of total market share through versatile sealing performance and broad application compatibility. PTFE materials capture 7.0% of total market share, graphite holds 6.0%, thermoplastic composites account for 5.0%, while other non-metallics including cork and ceramics represent 4.0% through specialized applications.
Metallic materials capture 40.0% market share through high-temperature sealing requirements in power generation, aerospace engines, and extreme pressure applications requiring metal-to-metal sealing and structural integrity.
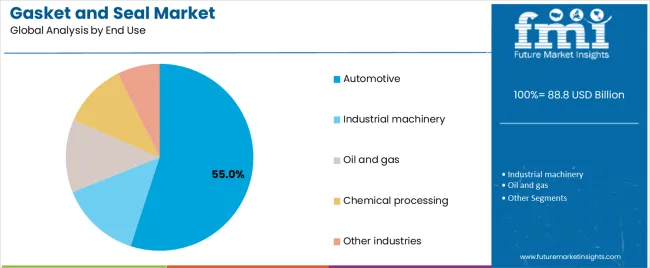
Market Position: Automotive applications command dominant market position with 55.0% market share through comprehensive sealing requirements across vehicle systems and powertrain components.
Value Drivers: This end-use segment provides the fundamental demand driver for sealing technology in transportation, meeting requirements for engine performance, fluid containment, and vehicle durability without operational compromise.
Growth Characteristics: The segment benefits from global vehicle production volumes, electrification transition creating new sealing applications, and established procurement programs that support widespread adoption and supply chain integration.
Within automotive applications, engine and powertrain systems maintain the dominant position with 24.0% of total market share through critical sealing requirements for combustion chambers, oil systems, and cooling circuits. Transmission and driveline applications capture 9.0% of total market share, EV and hybrid systems hold 7.0%, chassis/HVAC/thermal systems account for 8.0%, while aftermarket service kits represent 7.0% through replacement and maintenance demand.
Industrial machinery applications capture significant market share through hydraulic systems, pneumatic equipment, and manufacturing automation requiring precision sealing solutions. Oil and gas, chemical processing, and other industrial sectors maintain substantial positions through process equipment and infrastructure sealing requirements.
| Category | Factor | Impact | Why It Matters |
|---|---|---|---|
| Driver | Automotive production growth & electrification (EV transition, battery thermal management, power electronics cooling) | ★★★★★ | Vehicle production driving base demand while electrification creates new sealing applications; thermal management systems in EVs requiring specialized sealing solutions for battery cooling and power electronics. |
| Driver | Industrial automation & precision machinery (robotics, semiconductor equipment, medical devices) | ★★★★☆ | Automated systems need miniaturized, precision seals; semiconductor manufacturing and cleanroom applications expanding high-performance material demand. |
| Driver | Hydrogen economy infrastructure (fuel cells, electrolyzers, compression systems, distribution networks) | ★★★★☆ | Emerging hydrogen applications require specialized sealing materials; H₂ compatibility driving R&D investment and creating premium product segments. |
| Restraint | Raw material price volatility (elastomer feedstocks, fluoropolymers, specialty compounds) | ★★★★☆ | Petroleum-derived elastomer prices fluctuating with crude oil; specialty materials facing supply constraints affecting margins and pricing stability. |
| Restraint | Extended maintenance cycles & durability improvements (longer-life formulations, reduced replacement frequency) | ★★★☆☆ | Better sealing materials lasting longer reduce replacement demand; extended oil change intervals in automotive decreasing service-driven seal purchases. |
| Trend | Sustainable & bio-based materials (recycled elastomers, bio-sourced polymers, circular economy initiatives) | ★★★★★ | Environmental regulations and corporate sustainability goals driving material innovation; bio-based and recyclable sealing materials gaining specification traction. |
| Trend | Hydrogen-compatible sealing technology (permeation resistance, rapid gas decompression durability, FFKM/PTFE development) | ★★★★☆ | Fuel-cell mobility and green hydrogen infrastructure requiring specialized materials; suppliers investing in H₂-service testing and certification capabilities. |
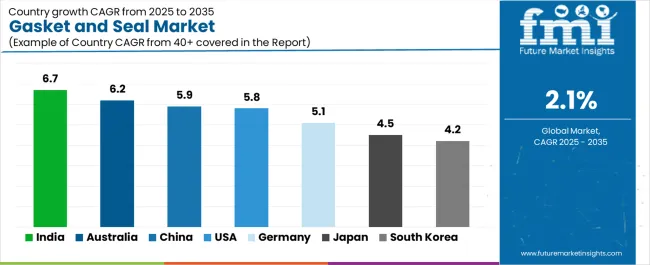
The gasket and seal market demonstrates varied regional dynamics with Growth Leaders including India (6.7% growth rate) and Australia (6.2% growth rate) driving expansion through manufacturing scale-up initiatives and infrastructure development. Steady Performers encompass China (5.9% growth rate), United States (5.8% growth rate), and Germany (5.1% growth rate), benefiting from established automotive industries and advanced material adoption. Developed Markets feature Japan (4.5% growth rate) and South Korea (4.2% growth rate), where precision engineering and electronics miniaturization support consistent growth patterns.
Regional synthesis reveals South Asian markets leading adoption through vehicle production expansion and manufacturing localization, while North American and East Asian countries maintain strong growth supported by aerospace/energy applications and material technology advancement. European markets show moderate growth driven by automotive applications and eco-material integration trends.
| Region/Country | 2025-2035 Growth | How to win | What to watch out |
|---|---|---|---|
| India | 6.7% | Focus on localization support | Quality control variability; price competition |
| Australia | 6.2% | Lead with mining-grade durability | Project timing delays; commodity cycles |
| China | 5.9% | Offer scale manufacturing | Local competition; IP protection challenges |
| United States | 5.8% | Push aerospace/H₂ technology | Reshoring complexity; skilled labor gaps |
| Germany | 5.1% | Premium precision materials | Over-engineering costs; automotive transition |
| Japan | 4.5% | Miniaturization expertise | Deflation pressures; conservative adoption |
| South Korea | 4.2% | Multi-industry diversification | Export dependency; technology cycles |
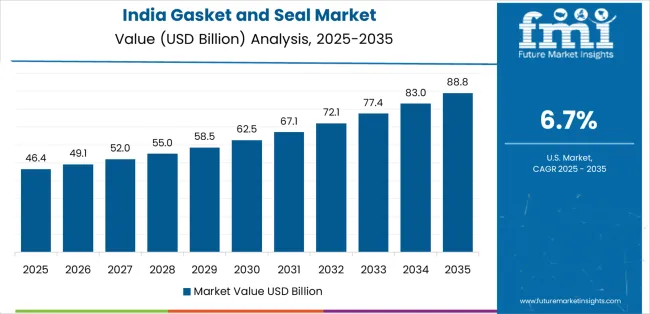
India establishes fastest market growth through aggressive vehicle production programs and comprehensive infrastructure development, integrating advanced gasket and seal solutions as standard components in automotive manufacturing and industrial installations. The country's 6.7% growth rate reflects government initiatives promoting manufacturing self-reliance and industrial expansion that mandate the use of quality sealing systems in automotive and process facilities. Growth concentrates in major industrial hubs, including Chennai automotive cluster, Pune manufacturing zone, and Gujarat industrial corridors, where manufacturing infrastructure development showcases localized sealing component production that appeals to automotive manufacturers seeking cost-effective solutions and domestic supply chain capabilities.
Indian manufacturers are developing locally-produced sealing solutions that combine competitive pricing advantages with improving quality standards, including automotive-grade elastomers and industrial seal configurations. Distribution channels through automotive tier suppliers and industrial equipment distributors expand market access, while government Make in India initiatives support adoption across diverse automotive and industrial segments.
Strategic Market Indicators:
In Perth mining operations, Queensland resource projects, and offshore platforms, industrial facilities are implementing advanced gasket and seal solutions as standard equipment for process reliability and safety compliance applications, driven by increasing mining activity and infrastructure modernization programs that emphasize the importance of leak prevention. The market holds a 6.2% growth rate, supported by resource sector expansion and stringent safety requirements that promote high-performance sealing systems for mining and oil and gas facilities. Australian operators are adopting sealing systems that provide robust chemical resistance and extreme temperature performance, particularly appealing in resource extraction regions where harsh operating conditions and safety compliance represent critical operational requirements.
Market expansion benefits from substantial mining and energy infrastructure investment and preference for proven international sealing technology adapted for local conditions. Technology adoption follows patterns established in resource equipment, where reliability and safety compliance drive procurement decisions and facility-wide deployment.
Market Intelligence Brief:
In Shanghai automotive clusters, Guangdong manufacturing zones, and industrial centers, production facilities are implementing advanced gasket and seal solutions as standard components for quality optimization and export competitiveness applications, driven by increasing manufacturing scale and automation deployment programs that emphasize the importance of reliable sealing. The market holds a 5.9% growth rate, supported by continued industrial expansion and technology advancement programs that promote advanced sealing systems for automotive and machinery manufacturing facilities. Chinese operators are adopting sealing solutions that provide consistent quality performance and cost-effective supply, particularly appealing in high-volume production regions where manufacturing efficiency and quality standards represent critical competitive requirements.
Market expansion benefits from massive automotive and industrial machinery production capacity and supply chain integration that enable scaled sealing component manufacturing. Technology adoption follows patterns established in automotive supply chains, where quality and value drive procurement decisions and production-scale deployment.
Market Intelligence Brief:
United States establishes strong market position through comprehensive aerospace programs and emerging energy technology development, integrating gasket and seal solutions across automotive, aerospace, and industrial applications. The country's 5.8% growth rate reflects established manufacturing relationships and advanced material adoption that supports widespread use of high-performance sealing systems in critical applications and emerging hydrogen infrastructure. Demand concentrates in automotive manufacturing centers, aerospace production facilities, and emerging hydrogen hubs, where technology deployment showcases advanced material application that appeals to manufacturers seeking proven performance capabilities and innovation leadership.
American sealing suppliers leverage established engineering capabilities and comprehensive testing infrastructure, including material validation programs and application development that create customer relationships and technology advantages. The market benefits from mature quality standards and performance requirements that drive advanced material adoption while supporting innovation and emerging application development.
Market Intelligence Brief:
Germany's advanced automotive technology market demonstrates sophisticated gasket and seal deployment with documented operational effectiveness in precision machinery and automotive applications through integration with existing quality systems and manufacturing infrastructure. The country leverages engineering expertise in material technology and application development to maintain a 5.1% growth rate. Industrial centers, including Baden-Württemberg automotive region, Bavaria machinery clusters, and North Rhine-Westphalia industrial zones, showcase premium installations where sealing solutions integrate with comprehensive quality platforms and equipment management systems to optimize operational reliability and performance effectiveness.
German manufacturers prioritize precision engineering and material quality in sealing component procurement, creating demand for premium products with advanced features, including eco-material alternatives and hydrogen compatibility. The market benefits from established automotive technology infrastructure and willingness to invest in advanced sealing technologies that provide long-term operational benefits and compliance with environmental standards.
Market Intelligence Brief:
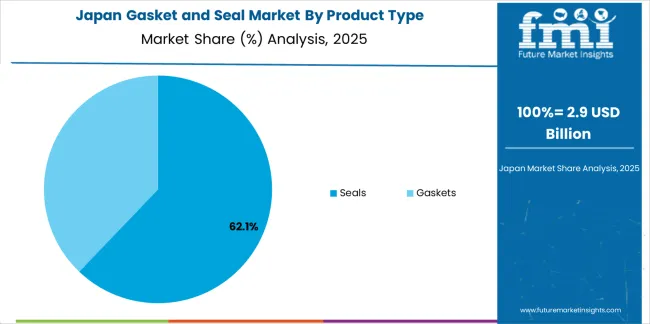
Japan's precision electronics market demonstrates sophisticated gasket and seal deployment with documented operational effectiveness in miniaturized applications and robotics through integration with quality management systems. The country maintains a 4.5% growth rate, driven by electronics manufacturing excellence and comprehensive quality standards.
Market dynamics focus on precision sealing solutions that meet rigorous performance standards for electronics, semiconductors, and automation equipment. Miniaturization requirements and quality expectations create consistent demand for advanced sealing materials in compact configurations.
Strategic Market Considerations:
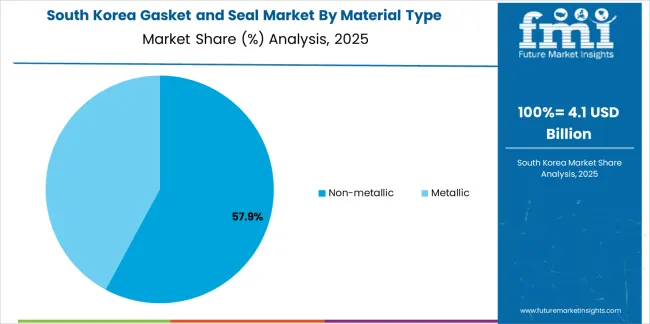
South Korea's diversified manufacturing market demonstrates balanced gasket and seal deployment across automotive, electronics, and shipbuilding through established industrial base. The country maintains a 4.2% growth rate, driven by multi-industry demand and emerging hydrogen mobility initiatives.
Market dynamics focus on versatile sealing solutions that serve automotive production, electronics assembly, and heavy industries. Technology diversification and hydrogen pilot programs create growing opportunities for specialized sealing applications.
Strategic Market Considerations:
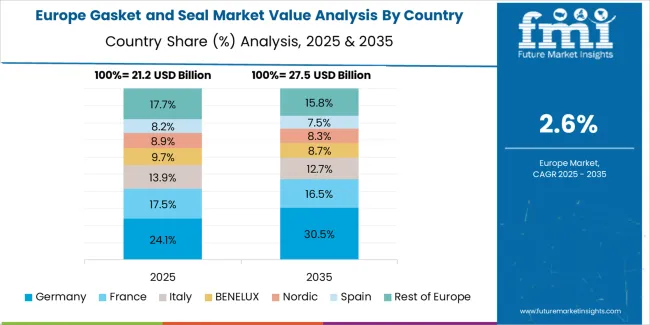
The gasket and seal market in Europe is projected to grow from USD 24.0 billion in 2025 to USD 29.0 billion by 2035, registering a CAGR of 1.9% over the forecast period. Germany is expected to maintain leadership with a 24.5% market share in 2025, easing to 23.8% by 2035 on continued dominance in automotive and precision machinery.
France holds a 15.4% share in 2025, inching to 15.7% by 2035 on process industries and aerospace sealing demand. United Kingdom accounts for a 14.1% share in 2025, stabilizing at 14.0% by 2035 with growth in energy and chemicals. Italy stands at a 13.2% share in 2025, moving to 13.4% by 2035 on machinery and HVAC exports. Spain registers a 9.1% share in 2025, reaching 9.4% by 2035 with food, pharma, and renewables investments. Rest of Europe collectively maintains 23.7% share through the forecast period with uptake in Nordics and Central/Eastern Europe for hydrogen, district energy, and industrial upgrades.
| Stakeholder | What they actually control | Typical strengths | Typical blind spots |
|---|---|---|---|
| Global automotive platforms | OEM relationships, production scale, quality certification | Automotive integration, volume efficiency, global footprint | Innovation speed; emerging applications |
| Material innovators | R&D capabilities; specialty compounds; hydrogen compatibility | Advanced formulations; application leadership | Distribution density; automotive qualification cycles |
| Regional specialists | Local manufacturing, fast delivery, application support | "Close to customer" engineering; responsive service | Technology gaps; material range limitations |
| Aftermarket-focused ecosystems | Distribution networks, service kits, cross-reference databases | Availability breadth; installer relationships | OEM specification access; premium material access |
| Specialty application leaders | Aerospace certification, semiconductor compatibility, extreme conditions | High-performance credentials; niche expertise | Volume economics; automotive mass market |
| Item | Value |
|---|---|
| Quantitative Units | USD 88.8 billion |
| Product Type | Seals (O-rings, Rotary shaft seals, Hydraulic seals, Oil seals, Other seals), Gaskets |
| Material Type | Non-metallic (Rubber/elastomers, PTFE, Graphite, Thermoplastic composites, Other non-metallics), Metallic |
| End Use | Automotive (Engine & powertrain, Transmission & driveline, EV & hybrid systems, Chassis/HVAC/thermal, Aftermarket service kits), Industrial machinery, Oil and gas, Chemical processing, Other industries |
| Regions Covered | North America, Latin America, Western Europe, Eastern Europe, East Asia, South Asia Pacific, Middle East & Africa |
| Countries Covered | United States, China, Germany, India, United Kingdom, Japan, South Korea, Australia, Canada, Brazil, France, Saudi Arabia, and 25+ additional countries |
| Key Companies Profiled | Freudenberg & Co. KG, Dana Incorporated, ElringKlinger AG, Tenneco (Federal-Mogul), SKF, Parker Hannifin, James Walker Group, Trelleborg Sealing Solutions, NOK Corporation, Banco Products (India) Ltd. |
| Additional Attributes | Dollar sales by product type and material categories, regional adoption trends across South Asia Pacific, East Asia, and North America, competitive landscape with automotive suppliers and industrial component manufacturers, equipment operator preferences for sealing reliability and material compatibility, integration with fluid management systems and thermal control platforms, innovations in material technology and hydrogen compatibility, and development of sustainable sealing solutions with enhanced performance and environmental optimization capabilities. |
The global gasket and seal market is estimated to be valued at USD 88.8 billion in 2025.
The market size for the gasket and seal market is projected to reach USD 109.3 billion by 2035.
The gasket and seal market is expected to grow at a 2.1% CAGR between 2025 and 2035.
The key product types in gasket and seal market are seals and gaskets.
In terms of material type, non-metallic segment to command 60.0% share in the gasket and seal market in 2025.


Our Research Products

The "Full Research Suite" delivers actionable market intel, deep dives on markets or technologies, so clients act faster, cut risk, and unlock growth.

The Leaderboard benchmarks and ranks top vendors, classifying them as Established Leaders, Leading Challengers, or Disruptors & Challengers.

Locates where complements amplify value and substitutes erode it, forecasting net impact by horizon

We deliver granular, decision-grade intel: market sizing, 5-year forecasts, pricing, adoption, usage, revenue, and operational KPIs—plus competitor tracking, regulation, and value chains—across 60 countries broadly.

Spot the shifts before they hit your P&L. We track inflection points, adoption curves, pricing moves, and ecosystem plays to show where demand is heading, why it is changing, and what to do next across high-growth markets and disruptive tech

Real-time reads of user behavior. We track shifting priorities, perceptions of today’s and next-gen services, and provider experience, then pace how fast tech moves from trial to adoption, blending buyer, consumer, and channel inputs with social signals (#WhySwitch, #UX).

Partner with our analyst team to build a custom report designed around your business priorities. From analysing market trends to assessing competitors or crafting bespoke datasets, we tailor insights to your needs.
Supplier Intelligence
Discovery & Profiling
Capacity & Footprint
Performance & Risk
Compliance & Governance
Commercial Readiness
Who Supplies Whom
Scorecards & Shortlists
Playbooks & Docs
Category Intelligence
Definition & Scope
Demand & Use Cases
Cost Drivers
Market Structure
Supply Chain Map
Trade & Policy
Operating Norms
Deliverables
Buyer Intelligence
Account Basics
Spend & Scope
Procurement Model
Vendor Requirements
Terms & Policies
Entry Strategy
Pain Points & Triggers
Outputs
Pricing Analysis
Benchmarks
Trends
Should-Cost
Indexation
Landed Cost
Commercial Terms
Deliverables
Brand Analysis
Positioning & Value Prop
Share & Presence
Customer Evidence
Go-to-Market
Digital & Reputation
Compliance & Trust
KPIs & Gaps
Outputs
Full Research Suite comprises of:
Market outlook & trends analysis
Interviews & case studies
Strategic recommendations
Vendor profiles & capabilities analysis
5-year forecasts
8 regions and 60+ country-level data splits
Market segment data splits
12 months of continuous data updates
DELIVERED AS:
PDF EXCEL ONLINE
Gasket Seal Machine Market Analysis - Size, Share, and Forecast Outlook 2025 to 2035
Silicone Gasket-Free Sealant Market Size and Share Forecast Outlook 2025 to 2035
Automotive Seals and Gaskets Market Size and Share Forecast Outlook 2025 to 2035
Sealing & Strapping Packaging Tape Market Size and Share Forecast Outlook 2025 to 2035
Sealing Agent for Gold Market Size and Share Forecast Outlook 2025 to 2035
Sealant Web Film Market Size and Share Forecast Outlook 2025 to 2035
Gaskets Market Size and Share Forecast Outlook 2025 to 2035
Sealed Wax Packaging Market Size and Share Forecast Outlook 2025 to 2035
Sealing And Strapping Packaging Tapes Market Size and Share Forecast Outlook 2025 to 2035
Sealless Magnetic Drive Pump Market- Growth & Demand 2025 to 2035
Sealant Films Market
Resealable Packaging Labels Market Size and Share Forecast Outlook 2025 to 2035
Resealable Closures And Spouts Packaging Market Size and Share Forecast Outlook 2025 to 2035
2 Seal Pouches Market Size and Share Forecast Outlook 2025 to 2035
Market Share Breakdown of Resealable Packaging Bag Manufacturers
Market Share Distribution Among Resealable Closures and Spouts Packaging Providers
Key Players & Market Share in 2 Seal Pouch Industry
Resealable Packaging Bag Market Analysis by PE and PP Through 2034
RF Sealer System Market Size and Share Forecast Outlook 2025 to 2035
Bag Sealer Market Analysis - Size and Share Forecast Outlook 2025 to 2035

Thank you!
You will receive an email from our Business Development Manager. Please be sure to check your SPAM/JUNK folder too.
Chat With
MaRIA