The global galvanic isolation market will increase progressively from 2025 to 2035 due to growing demands for electrical safety, signal integrity, and high-voltage isolation in industrial automation, renewable power generation, electric vehicles, medical electronics, and telecommunication.
Galvanic isolation to avoid direct electrical contact between various parts of a system is required to avoid ground loops, ensure user safety, and enable fault-tolerant design of the system. Market size would be USD 3,182.6 million in 2025 and will reach USD 6,012.4 million in 2035 with a CAGR of 6.5%.
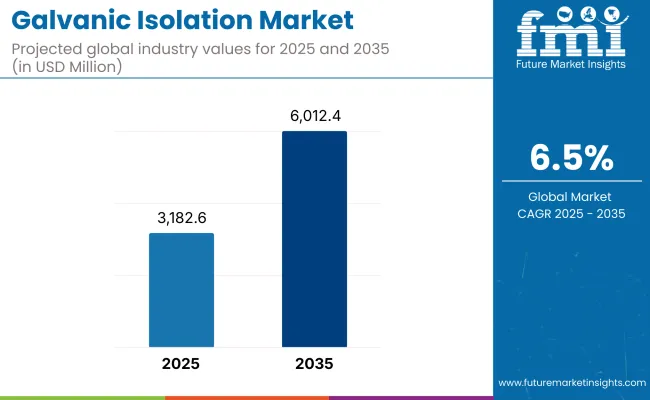
| Metric | Value |
|---|---|
| Market Size in 2025 | USD 3,182.6 million |
| Projected Market Size in 2035 | USD 6,012.4 million |
| CAGR (2025 to 2035) | 6.5% |
Usage of isolated gate drivers, digital isolators, opto-isolators, and transformer isolation technologies is increasing while system miniaturization and complexity persist. EV battery systems, grid inverters, and high-speed require ultra-low latency along with rugged isolation and hence galvanic isolation is being coerced as a design necessity.
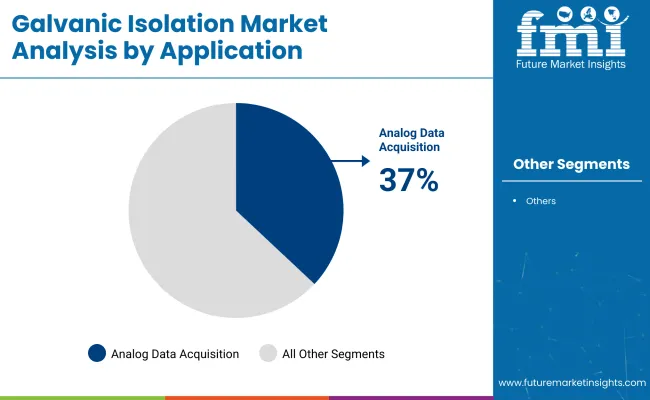
| By Application | Market Share (2025) |
|---|---|
| Analog Data Acquisition | 37% |
Analog data acquisition is anticipated to lead the galvanic isolation market in 2025 with a share of 37%. The requirement is fuelled by its significant application in maintaining the correct signal transmission between high- and low-voltage subsystems, particularly in sensitive environments such as industrial automation and medical diagnosis.
For example, factory automation controller manufacturers have a significant dependency on isolation components to maintain signal fidelity while insulating devices against transient voltages. As industries strive for smarter, more networked equipment, galvanic isolation within analog signal chains becomes necessary to ensure error-free data acquisition and safe operation.
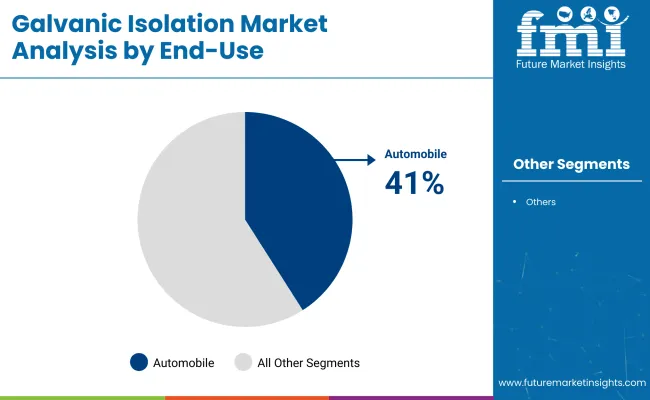
| By End-Use | Market Share (2025) |
|---|---|
| Automobile | 41% |
The automotive segment should dominate end-use demand and represent 41% of the galvanic isolation market in 2025. As cars evolve to be increasingly electronically advanced-particularly electric vehicles (EVs)-isolation of low-voltage control systems from high-voltage battery packs and powertrains is imperative.
European and East Asian carmakers are embracing digital isolators in advanced driver-assistance systems (ADAS) and battery management systems, delivering performance without safety trade-offs. Galvanic isolation in automobile design protects sensitive electronics while complying with more rigid vehicle safety regulations.
North America is at the forefront of galvanic isolation technology deployment and prominent industrial control systems, automotive and defence electronics. The USA is still the center for digital isolator innovation of next-generation power modules, with manufacturers continuing to couple reinforced isolation with silicon technology. Compliances with safety standards such as UL 1577 and IEC 60747-5-5 continue to propel use.
Asia-Pacific is in strong demand, particularly for medical electronics and industrial power saving. Germany and Switzerland are putting money into high-isolation components for MRI systems, implantable medical devices, and robot surgery platforms. Distributed energy systems such as solar + storage and microgrids also generate isolated DC-DC converter and signal isolator demand.
Asia-Pacific is the most vibrant market driven by China, Japan, and South Korea's rapidly growing electric vehicle and battery manufacturing centers, along with fast industrialization and urban infrastructure development. Galvanic isolation is being increasingly incorporated into BMS (Battery Management Systems), power inverters, and motor drive controls by suppliers, and the region is a major growth driver for isolator ICs and high-voltage opto-couplers.
Signal Degradation, Cost Constraints, and Size Limitations
The most challenging is to obtain signal speed and isolation performance. High-speed applications greet jitter and latency with some isolators. For cost-sensitive products, using lower-grade isolation components can restrict durability or safety. Miniaturized electronics also pose spatial requirements that call for challenging isolation barrier integration.
Digital Isolators, EV Platforms, and Reinforced Isolation
Next-gen capacitive and magnetic digital isolators offer higher levels of data, higher noise immunity, and better thermal resilience, a rock-solid improvement over past opto-isolators. EV manufacturing, especially on-board chargers, battery management, and motor control, is creating massive demand for high-voltage isolation (1.5kV to 6kV). Combining two levels of protection in a single device with hardened isolation is, however, soon becoming a flat-out requirement.
During 2020 to 2024, the market saw universal growth in digital isolation, particularly for industrial IoT and edge computing applications with high-speed, isolated communication. Legacy equipment more and more replaced opto-couplers with digital solutions to ensure improved energy efficiency and thermal performance.
2025 to 2035 will see focus on high-voltage reinforced isolators, self-healing insulation layers, and auto-diagnostic capability. GaN and SiC power electronic devices will introduce new requirements into ultra-fast isolator design. Environmental requirements and requirements for compact-size, reliable electronic modules will drive integration of isolation into power ICs and SoCs. Implementation of functional safety (ISO 26262, IEC 61508) will also make galvanic isolation central to the majority of vertical system designs.
Market Shifts: A Comparative Analysis 2020 to 2024 vs. 2025 to 2035
| Market Shift | 2020 to 2024 Trends |
|---|---|
| Regulatory Landscape | Compliance with IEC 60601 (medical), UL 1577 (safety), and ISO 26262 (automotive functional safety). |
| Consumer Trends | Rising demand in medical imaging devices, industrial automation, and solar inverters. |
| Industry Adoption | Integrated into analog signal pathways, motor drives, and switch-mode power supplies. |
| Supply Chain and Sourcing | Dependent on optical isolator modules and magnetic coupler ICs from Tier-1 semiconductor fabs. |
| Market Competition | Dominated by Texas Instruments, Analog Devices, Broadcom, and Silicon Labs. |
| Market Growth Drivers | Powered by industrial 4.0 trends, electric mobility, and rise in isolated gate drivers for power devices. |
| Sustainability and Environmental Impact | Limited focus on eco-friendly packaging and lifecycle energy usage. |
| Integration of Smart Technologies | Minimal integration beyond isolated DC-DC converters and simple couplers. |
| Advancements in Equipment Design | Use of discrete optical isolators and basic capacitive coupling structures. |
| Market Shift | 2025 to 2035 Projections |
|---|---|
| Regulatory Landscape | Inclusion of cybersecurity-integrated isolation mandates in medical and industrial settings; stricter fail-safe response standards for EVs. |
| Consumer Trends | Growing interest in noise-resistant, ultra-low-latency digital isolators for high-speed EV chargers and next-gen medical wearables. |
| Industry Adoption | Deployed in AI-integrated motor controllers, battery management systems, and GaN/SiC-based power electronics. |
| Supply Chain and Sourcing | Shift toward regional on-chip isolation fabrication using CMOS-compatible materials and foundry-based MEMS design for noise immunity. |
| Market Competition | Entry of fabless semiconductor startups with proprietary digital isolation IPs for IoT security, EV fast-charging, and modular robotics. |
| Market Growth Drivers | Driven by intelligent power modules, real-time process automation, and high-voltage, low-latency signal isolation for EV and energy storage. |
| Sustainability and Environmental Impact | Push for RoHS 3-compliant, halogen-free isolators and wafer-level integration to reduce board footprint and material waste. |
| Integration of Smart Technologies | Growth of AI-enabled predictive diagnostics in isolation devices; real-time error correction and electromagnetic interference compensation. |
| Advancements in Equipment Design | Shift toward integrated isolation + protection ICs, opto-free magnetic isolators, and adaptive impedance-matched isolator modules. |
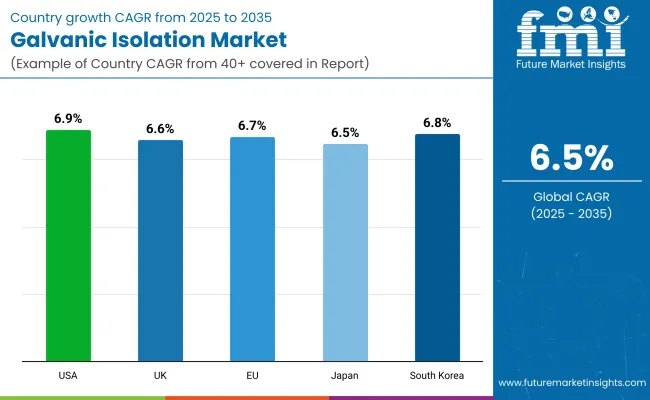
The USA market is surging due to rapid investments in EV infrastructure, digital substations, and industrial automation. Semiconductor giants are partnering with energy system integrators to embed smart galvanic isolation in high-voltage battery systems and motor inverters. Defence contractors are also utilizing ruggedized isolators for aerospace-grade control systems.
| Country | CAGR (2025 to 2035) |
|---|---|
| USA | 6.9% |
In the UK, increased demand for secure medical electronics and smart grid controllers is spurring the adoption of high-isolation ICs. NHS-backed initiatives are funding safer diagnostic platforms using magnetic and capacitive isolation. Additionally, renewable energy farms are integrating advanced gate driver isolation modules in solar and wind converters.
| Country | CAGR (2025 to 2035) |
|---|---|
| UK | 6.6% |
In the EU, galvanic isolation is central to electrification and energy transition goals. Countries like Germany and the Netherlands are deploying isolation-enhanced SiC and GaN power modules in electric buses, industrial robotics, and smart charging. Stricter safety norms under EN 50178 and EN 61010 are further catalysing adoption.
| Country | CAGR (2025 to 2035) |
|---|---|
| European Union (EU) | 6.7% |
Japan’s galvanic isolation market is gaining traction in autonomous factory automation and EV drivetrain systems. Local electronics firms are innovating around miniaturized isolation ICs compatible with robotic arms, surgical equipment, and multi-sensor systems in smart manufacturing. High-frequency noise suppression is a key product differentiator.
| Country | CAGR (2025 to 2035) |
|---|---|
| Japan | 6.5% |
South Korea is expanding its isolation capabilities in semiconductor fabs, medical device exports, and EV component production. Companies are embedding digital isolators into AI chipsets, battery monitoring circuits, and next-gen telecom infrastructure to manage signal integrity and eliminate ground loops in densely populated PCB environments.
| Country | CAGR (2025 to 2035) |
|---|---|
| South Korea | 6.8% |
Galvanic Isolation Market is seeing robust growth driven by growing demands for safety and reliability of electronic systems across multiple industries. The market is defined by a few leading players working towards technology innovations, strategic collaborations, and strengthening product portfolios to cater to changing industry requirements in sectors like healthcare, telecom, and manufacturing.
Market Share Analysis by Company
| Company Name | Estimated Market Share (%) |
|---|---|
| Texas Instruments Inc. | 15-20% |
| Analog Devices Inc. | 12-17% |
| Infineon Technologies AG | 10-15% |
| Broadcom Inc. | 8-12% |
| STMicroelectronics N.V. | 5-10% |
| Other Companies (combined) | 30-40% |
| Company Name | Key Offerings/Activities |
|---|---|
| Texas Instruments Inc. | Introduced in 2024, a new range of strengthened isolators with enhanced electromagnetic compatibility for industrial use. Introduced in 2025, expanded its bases for manufacturing in Asia to cater to increasing demand. |
| Analog Devices Inc. | In 2024, introduced a compact galvanic isolation solution designed specifically for electric vehicle battery management systems. In 2025, partnered with leading automotive companies to integrate these solutions into future-generation EVs. |
| Infineon Technologies AG | In 2024, developed high-speed digital isolators that are optimized for renewable energy inverters. In 2025, bought a start-up company that is an expert in isolation technologies to diversify its product offerings. |
| Broadcom Inc. | Released in 2024, optocouplers with improved thermal efficiency for telecommunications infrastructure. In 2025, collaborated with major telecom providers to implement these solutions within 5G networks. |
| STMicroelectronics N.V. | Launched galvanic isolation devices that have built-in surge protection in 2024 for medical products. In 2025, increased its channel network in growth markets to drive further accessibility. |
Key Company Insights
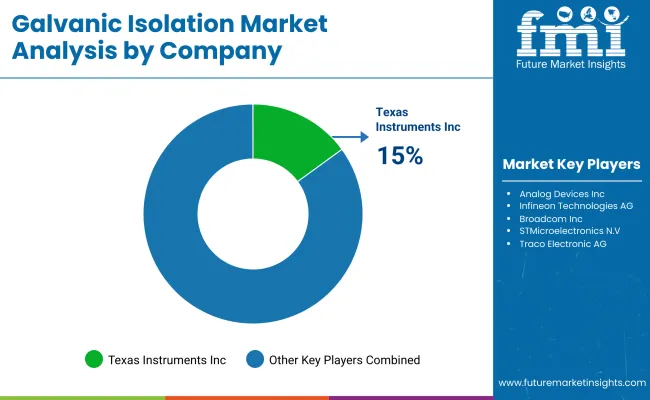
Texas Instruments Inc. (15-20%)
Texas Instruments is the market leader with a wide portfolio of isolation products catering to industrial applications. Their efforts in electromagnetic compatibility and manufacturing growth make them well placed to address growing worldwide demand.
Analog Devices Inc. (12-17%)
Analog Devices is positioning itself strongly in the automotive market by offering miniature isolation solutions to electric vehicles. Partnerships with automotive companies improve their market share in the EV segment.
Infineon Technologies AG (10-15%)
Infineon specializes in renewable energy applications, providing high-speed digital isolators for inverters. Technological strength and product capabilities are enhanced through strategic acquisitions.
Broadcom Inc. (8-12%)
Broadcom specializes in telecommunications infrastructure, supplying optocouplers with exceptional thermal performance. Integrating their products into high-end networks is made easier through alliances with telecom organizations.
STMicroelectronics N.V. (5-10%)
STMicroelectronics focuses on the medical industry with isolation products incorporating built-in surge protection. Expansion of distribution in developing economies seeks to enhance their worldwide presence.
Other Key Players (30-40% Combined)
The overall market size for the galvanic isolation market was approximately USD 3,182.6 million in 2025.
The galvanic isolation market is projected to reach approximately USD 6,012.4 million by 2035.
The increasing adoption of renewable energy systems, electric vehicles, and smart grids fuels the galvanic isolation market during the forecast period.
The top 5 countries driving the development of the galvanic isolation market are the United States, Germany, Japan, China, and South Korea.
On the basis of application, analog data acquisition is expected to command a significant share over the forecast period.


Full Research Suite comprises of:
Market outlook & trends analysis
Interviews & case studies
Strategic recommendations
Vendor profiles & capabilities analysis
5-year forecasts
8 regions and 60+ country-level data splits
Market segment data splits
12 months of continuous data updates
DELIVERED AS:
PDF EXCEL ONLINE
RNA Isolation and Enrichment Reagent Market
Cell Isolation Market Size and Share Forecast Outlook 2025 to 2035
Zonal Isolation Market Size and Share Forecast Outlook 2025 to 2035
Vibration Isolation System industry Analysis in India - Size, Share, and Forecast Outlook 2025 to 2035
Cosmid DNA Isolation Market
Power Supply Isolation Equipment Market Size and Share Forecast Outlook 2025 to 2035
Nucleic Acid Isolation and Purification Market Analysis by DNA Extraction and Purification Kits and RNA Extraction and Purification Kits Through 2035
Protein Purification and Isolation Market Insights – Size, Share & Forecast 2025 to 2035
Bonding Honeycomb Vibration Isolation Platform Market Size and Share Forecast Outlook 2025 to 2035

Thank you!
You will receive an email from our Business Development Manager. Please be sure to check your SPAM/JUNK folder too.
Chat With
MaRIA