Global frozen dessert sales are valued at USD 120 billion and are projected to reach USD 216.9 billion by 2035, expanding at a CAGR of 6.1%. Frozen desserts represent 17.6% of the USD 682.3 billion global convenience food sector in 2025, underlining their strong position as ready-to-consume indulgences.
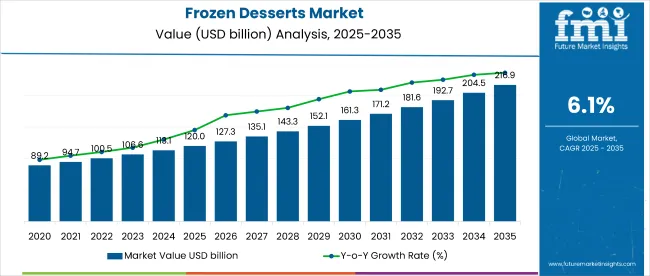
| Metric | Value |
|---|---|
| Market Size 2025 | USD 120 billion |
| Market Size 2035 | USD 216.9 billion |
| CAGR 2025 to 2035 | 6.1% |
Demand is underpinned by changing consumption patterns, expansion of premium and functional offerings, and a growing preference for dairy-free, low-fat, and sugar-reduced options across developed and emerging markets.
Global frozen desserts value is rising steadily, but real volume remains flat. In 2024, Unilever, the world’s largest ice cream player, posted €8.3 billion (≈USD 9.0 billion) in sales, with just 1.6% volume growth after years of shrinkflation. USA per capita intake has hovered at ~19 lb for a decade, while India's market is accelerating from a low base (~4-5 cups per capita), recording 15-20% summer sales growth. In contrast, Chinese buyers are turning back to ultra-low-cost SKUs, rejecting the ¥40 (≈USD 5.5) "ice cream assassin" trend. Strip away price hikes and the category’s global CAGR barely beats GDP.
What’s really moving shelves are two poles: indulgent micro-formats like Magnum Bon-Bons and value SKUs like ₹20 (≈USD 0.24) kulfi or sub-¥5 (≈USD 0.70) sticks. Plant-based remains under 3% of retail sales and is struggling with margin erosion due to fat input inflation. Meanwhile, regulatory and operational headwinds are intensifying: from EU deforestation rules and HFSS ad bans to cold-chain carbon scrutiny and retailer energy-scorecards. Unilever’s upcoming ice cream spinoff signals a new era of P&L accountability, volume over vanity, compliance over claims.
Frozen desserts market analysis has been segmented by product type; category; distribution channel; and region. By product type, the market covers yogurts; ice cream; and cakes. By category, the segmentation includes conventional and sugar-free. By distribution channel, the market is divided into offline retail stores and online retail stores. By region, the analysis spans North America; Latin America; Western Europe; Eastern Europe; Balkans & Baltic; Russia & Belarus; Central Asia; East Asia; South Asia & Pacific; and Middle East & Africa.
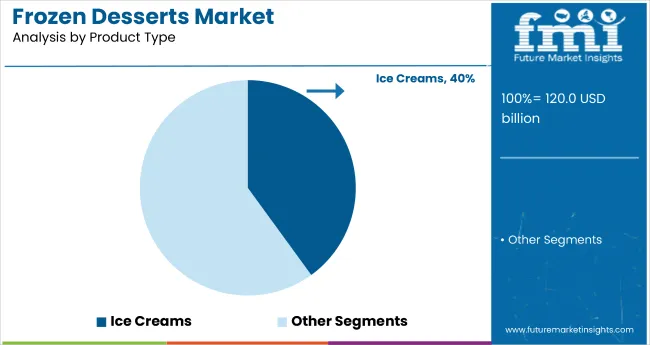
In 2025, the ice cream segment commands the largest share of the frozen desserts market, accounting for 40% of total value. Its dominance is supported by broad consumer appeal, seasonal demand spikes, and extensive brand innovation in flavors, textures, and formats.
Two key drivers are influencing this trend: increased preference for indulgent, premium ice creams among high-income consumers, and rising penetration in emerging markets, particularly through low-unit-price SKUs and mini-pack formats. However, market friction stems from growing health concerns, prompting some consumers to shift toward low-fat or dairy-free alternatives.
A structural disruptor lies in climate-linked demand volatility; ice cream consumption rises up to 50% during hot weather spells but drops over 20% during colder weeks. For producers, this necessitates flexible production capacity and region-specific inventory buffers to preserve margin performance.
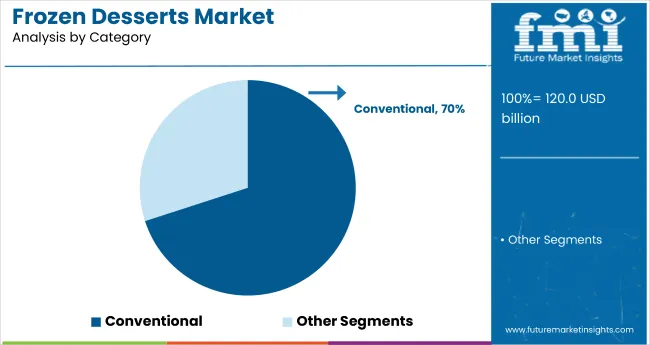
The conventional segment holds 70% share of the frozen desserts market in 2025, maintaining its lead over sugar-free and niche alternatives. This segment continues to benefit from widespread availability, consumer familiarity, and strong brand equity built around traditional recipes and indulgent textures.
Key growth factors include persistent demand from millennial and Gen X consumers for familiar comfort foods, and continuous product launches in classic formats with new flavor twists. However, headwinds include rising consumer scrutiny of high sugar and fat content, particularly in North America and Western Europe, where regulatory warnings and front-of-pack labeling are gaining traction.
A quiet disruptor is the rise of mid-premium private label offerings in the conventional category. These now account for up to 20% of shelf share in Europe, undercutting legacy brands and tightening price bands across supermarket chains.
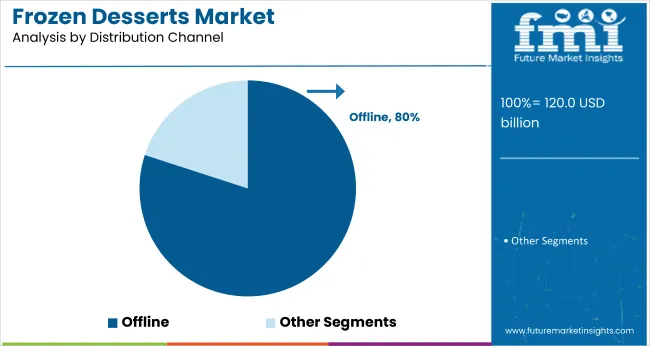
Offline retail stores account for the majority of frozen dessert sales, retaining a dominant position across both developed and emerging markets. Brick-and-mortar outlets continue to benefit from impulse-driven purchases, strong freezer infrastructure, and in-store promotional campaigns targeting family and single-serve formats.
Key growth levers include,
A structural shift is emerging as quick-commerce and omnichannel players negotiate freezer placement partnerships with supermarkets. While still under 15% of total value in 2025, these hybrid models are eroding offline exclusivity, especially in urban Tier-1 zones in Asia and North America.
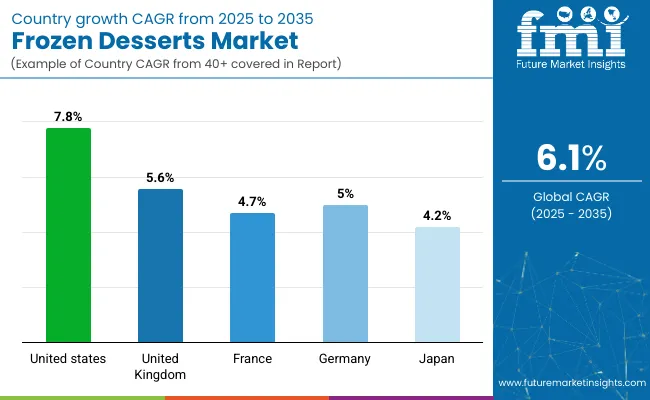
The frozen desserts market in the United States is estimated at USD 40.5 billion in 2025 and is projected to reach USD 85.8 billion by 2035, expanding at a CAGR of 7.8%. This growth is underpinned by the continued popularity of ice cream and frozen novelties, along with robust demand for indulgent, multi-serve formats.
On the margin front, manufacturers benefit from premiumization and flavor innovation, but are increasingly constrained by rising ingredient costs and energy expenses tied to cold-chain operations. USA plants produced 1.31 billion gallons of ice cream in 2024, but volume growth has largely plateaued, average per capita consumption has held flat at around 19 lb (≈4 gallons) per year for over a decade.
Regulatory shifts are adding pressure: the upcoming HFSS ad restrictions and mandatory nutritional labeling updates could raise reformulation costs by 4-6% of COGS. At the retail level, discounters and convenience chains are exerting pricing power, squeezing promotional windows and pack size flexibility. Meanwhile, consumer preference is bifurcating; mini-indulgences under 100 kcal are gaining ground, while mid-priced pints face shelf reduction.
Sales of frozen desserts in the United Kingdom are valued at USD 5.7 billion in 2025 and are expected to reach USD 9.9 billion by 2035, expanding at a CAGR of 5.6%. Growth is driven by demand for dairy-based ice creams, plant-forward formats, and reduced-sugar products. However, margins face compression from regulatory compliance and discounter pricing tactics.
From Jan 2026, the UK’s HFSS (high fat, sugar, salt) legislation will ban advertising of qualifying products on TV and online before 9 PM; this is set to impact over 60% of frozen dessert SKUs. Reformulation costs are expected to add 4-6% to cost of goods sold, especially for conventional brands reliant on full-fat dairy and sugar-heavy flavoring systems.
Retail control is tightening, with Aldi and Tesco leveraging private label programs to expand value-oriented and vegan frozen dessert lines. While plant-based remains <3% of category revenue, its share is highest in the UK among EU-5, supported by oat- and coconut-based options rolled out under private and premium brands alike.
France’s frozen desserts demand is valued at USD 4.3 billion in 2025 and is projected to reach USD 6.9 billion by 2035, reflecting a CAGR of 4.7%. Demand is primarily driven by artisanal-style ice creams, indulgent dairy-based novelties, and seasonal consumption peaks tied to summer heatwaves.
Margin growth is supported by premium segments, particularly single-serve gelato and regional flavor SKUs. However, operational costs are rising due to increased cold-chain energy prices and regulatory shifts under the EU’s deforestation and packaging laws. Reformulation efforts to meet upcoming sugar-content caps in school-friendly desserts have added 3-5% to formulation budgets.
French consumers remain resistant to plant-based substitutes, less than 2% of frozen dessert sales derive from non-dairy products. Survey data indicates over 70% of respondents associate “real ice cream” with dairy origin and texture, limiting vegan market penetration. Private labels continue to grow, especially through retailers like Leclerc and Carrefour, which are blending value pricing with clean-label claims.
Germany’s frozen desserts market is valued at USD 4.9 billion in 2025 and is forecast to reach USD 8.0 billion by 2035, expanding at a CAGR of 5%. The market benefits from stable year-round demand, with summer temperatures boosting impulse sales of ice cream sticks and multipacks.
Margin pressure is intensifying as energy prices elevate cold-chain operating costs, which account for over 18% of logistics overhead in the frozen category. Additionally, EU-wide environmental regulations such as the upcoming deforestation-free sourcing law are compelling brands to shift toward traceable palm and cocoa inputs, adding relabeling and compliance costs of up to €0.03 (≈USD 0.03) per unit.
Consumer habits are shifting incrementally: while indulgent dairy remains core, sugar-reduced and lactose-free formats are gaining retail facings. German discounters dominate distribution, with Aldi and Lidl increasing private label penetration, now accounting for over 45% of frozen dessert SKUs nationally.
Demand for frozen desserts in Japan is projected at USD 3.5 billion in 2025 and is expected to reach USD 5.3 billion by 2035, advancing at a CAGR of 4.2%. Growth is driven by small-format innovation, texture differentiation (e.g., mochi-based), and high consumer interest in limited-edition seasonal flavors.
Margins remain relatively stable due to Japan’s efficient cold-chain infrastructure and high price elasticity for novelty items. However, unit growth is tempered by an aging population and shrinking household sizes, which favor portion-controlled formats over family packs. Retailers are responding with compact SKUs targeting senior consumers and premium shoppers alike.
Regulatory oversight is moderate, though Japan has signalled alignment with upcoming APAC-wide guidelines on nutritional disclosures and plastic packaging. The plant-based segment remains niche under 2% of category value with limited traction beyond metropolitan convenience stores.
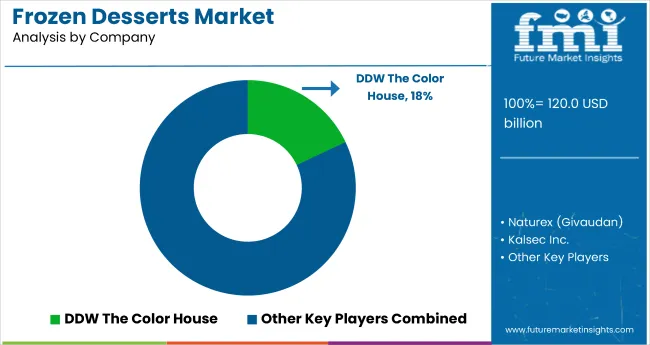
The players in the frozen desserts market are focusing on product reformulation, distribution realignment, and compliance preparedness to preserve margins and defend market share. Unilever, Nestlé, and Danone lead the global tier, collectively controlling over 35% of the market in 2025. Unilever, with brands like Magnum and Cornetto, is executing a strategic spinoff of its ice cream unit by end to 2025 to isolate its seasonally volatile P&L and concentrate on core personal care assets.
Nestlé’s key activities remain routed through its Froneri joint venture, which manages premium assets across Europe and North America. Danone is expanding its presence in lactose-free frozen yogurt and gelato, aligning with demand for digestive wellness and low-sugar indulgence. Private-label growth has triggered tactical responses, including multipack pricing and “clean-label” repositioning across legacy portfolios.
Over the short term, margin volatility is expected from soft-commodity spikes and new regulatory burdens. Cocoa futures surpassed USD 6,950/t in July 2025, prompting Barry Callebaut to issue a profit warning. Retail shelf dynamics are tightening: in the USA, promotional windows for branded SKUs have narrowed to under six weeks annually.
Over the next 3-5 years, players with vertically integrated sourcing, energy-efficient cold-chain investments, and real-time carbon tracking capabilities are expected to lead. Late movers relying on traditional SKUs and price-led promotions face increased margin compression and retail delisting risks.
| Attribute | Details |
|---|---|
| Market Size (2025) | USD 120 billion |
| Market Size (2035) | USD 216.9 billion |
| CAGR (2025 to 2035) | 6.1% |
| Base Year | 2024 |
| Historical Data | 2020 to 2024 |
| Forecast Period | 2025 to 2035 |
| Units of Measurement | Value (USD Billion) |
| Segmentation - Product Type | Yogurts, Ice Cream, Cakes |
| Segmentation - Category | Conventional, Sugar-Free |
| Segmentation - Distribution Channel | Offline Retail Stores, Online Retail Stores |
| Regions/Countries Covered | US, UK, France, Germany, Japan, and 40+ others |
| Key Companies Profiled | Unilever, Nestlé SA, Danone SA, General Mills Inc., The Hain Celestial Group, Ferrero, Kellogg, Conagra, Halo Top, Daiya |
By product type, methods industry has been categorized into yogurts, ice cream and cakes
By category, methods industry has been categorized into conventional and sugar free
By distribution channel industry has been categorized into offline retail stores and online retail stores
Industry analysis has been carried out in key countries of North America, Europe, Middle East, Africa, ASEAN, South Asia, Asia, New Zealand and Australia
The global frozen desserts market is valued at USD 120 billion in 2025.
The market is expected to reach USD 216.9 billion by 2035.
The United States leads with an estimated 33.8% share of global sales.
Ice cream holds the largest share, accounting for 46% of market value.
The market is projected to grow at a CAGR of 6.1% from 2025 to 2035.


Our Research Products

The "Full Research Suite" delivers actionable market intel, deep dives on markets or technologies, so clients act faster, cut risk, and unlock growth.

The Leaderboard benchmarks and ranks top vendors, classifying them as Established Leaders, Leading Challengers, or Disruptors & Challengers.

Locates where complements amplify value and substitutes erode it, forecasting net impact by horizon

We deliver granular, decision-grade intel: market sizing, 5-year forecasts, pricing, adoption, usage, revenue, and operational KPIs—plus competitor tracking, regulation, and value chains—across 60 countries broadly.

Spot the shifts before they hit your P&L. We track inflection points, adoption curves, pricing moves, and ecosystem plays to show where demand is heading, why it is changing, and what to do next across high-growth markets and disruptive tech

Real-time reads of user behavior. We track shifting priorities, perceptions of today’s and next-gen services, and provider experience, then pace how fast tech moves from trial to adoption, blending buyer, consumer, and channel inputs with social signals (#WhySwitch, #UX).

Partner with our analyst team to build a custom report designed around your business priorities. From analysing market trends to assessing competitors or crafting bespoke datasets, we tailor insights to your needs.
Supplier Intelligence
Discovery & Profiling
Capacity & Footprint
Performance & Risk
Compliance & Governance
Commercial Readiness
Who Supplies Whom
Scorecards & Shortlists
Playbooks & Docs
Category Intelligence
Definition & Scope
Demand & Use Cases
Cost Drivers
Market Structure
Supply Chain Map
Trade & Policy
Operating Norms
Deliverables
Buyer Intelligence
Account Basics
Spend & Scope
Procurement Model
Vendor Requirements
Terms & Policies
Entry Strategy
Pain Points & Triggers
Outputs
Pricing Analysis
Benchmarks
Trends
Should-Cost
Indexation
Landed Cost
Commercial Terms
Deliverables
Brand Analysis
Positioning & Value Prop
Share & Presence
Customer Evidence
Go-to-Market
Digital & Reputation
Compliance & Trust
KPIs & Gaps
Outputs
Full Research Suite comprises of:
Market outlook & trends analysis
Interviews & case studies
Strategic recommendations
Vendor profiles & capabilities analysis
5-year forecasts
8 regions and 60+ country-level data splits
Market segment data splits
12 months of continuous data updates
DELIVERED AS:
PDF EXCEL ONLINE
Competitive Landscape of Frozen Desserts Providers
Dry Mix Base for Frozen Desserts Market
Frozen Pet Food Market Size and Share Forecast Outlook 2025 to 2035
Frozen Yogurt Market Size and Share Forecast Outlook 2025 to 2035
Frozen Egg Market Size and Share Forecast Outlook 2025 to 2035
Frozen Food Packaging Market Size and Share Forecast Outlook 2025 to 2035
Frozen Tissues Samples Market Size and Share Forecast Outlook 2025 to 2035
Frozen Food Packaging Machines Market Size and Share Forecast Outlook 2025 to 2035
Frozen Food Market Analysis - Size, Share, and Forecast Outlook 2025 to 2035
Frozen Pastries Market Size and Share Forecast Outlook 2025 to 2035
Frozen Baked Goods Market Size and Share Forecast Outlook 2025 to 2035
Frozen Potatoes Market Size and Share Forecast Outlook 2025 to 2035
Frozen Beverage Dispenser Market Size and Share Forecast Outlook 2025 to 2035
Frozen Meat Grinder Market Size and Share Forecast Outlook 2025 to 2035
Frozen Fruits and Vegetables Market Size and Share Forecast Outlook 2025 to 2035
Frozen Vegetable Market Analysis - Size, Share, and Forecast Outlook 2025 to 2035
Frozen Cheese Market Size and Share Forecast Outlook 2025 to 2035
Frozen Snacks Market Analysis - Size, Share, and Forecast Outlook for 2025 to 2035
Frozen Fruit Bars Market Analysis - Size and Share Forecast Outlook 2025 to 2035
Frozen Ready Meals Market Analysis - Size, Share, and Forecast Outlook 2025 to 2035

Thank you!
You will receive an email from our Business Development Manager. Please be sure to check your SPAM/JUNK folder too.
Chat With
MaRIA