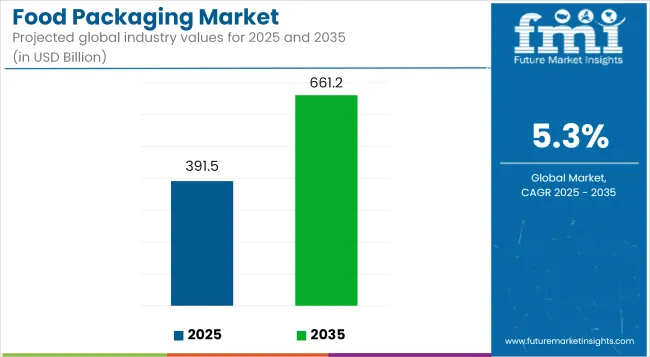
The food packaging market is projected to grow from USD 391.5 billion in 2025 to USD 661.2 billion by 2035, registering a CAGR of 5.3% during the forecast period. Sales in 2024 reached USD 371.7 billion, indicating a steady demand trajectory.

| Metric | Value |
|---|---|
| Market Size (2025E) | USD 391.5 billion |
| Market Value (2035F) | USD 661.2 billion |
| CAGR (2025 to 2035) | 5.3% |
This growth has been attributed to the increasing demand for convenient, sustainable, and safe food packaging solutions across various sectors, including ready-to-eat meals, dairy products, and bakery items. The rise in e-commerce and food delivery services has further propelled the adoption of innovative packaging solutions.
Advancements in smart packaging technologies, such as active and intelligent packaging with temperature control indicators, have enhanced product appeal and safety, aligning with the evolving needs of manufacturers and consumers alike.
In February 2025, Berry Global Group, Inc. collaborated with snacks and treats leader Mars to transition its pantry jars for M&M’S®, SKITTLES® and STARBURST® brands to 100% recycled plastic packaging.
“As companies across the globe commit to transitioning to a circular economy, the ability to deliver products made with recycled materials at scale is crucial,” said Peter Goshorn, Vice President of Food, and Beverage & Spirits for Berry Global’s Consumer Packaging North America Division. “That’s why we’re collaborating with leading brands, like Mars, to significantly increase the use of recycled content to drive responsible business growth without compromising performance or aesthetics.”
The food packaging demand is poised for continued growth, driven by the ongoing expansion of various end-use industries and the increasing emphasis on sustainable packaging solutions. The market's trajectory suggests a steady rise in demand for innovative, eco-friendly packaging that caters to both consumer preferences and regulatory requirements.
Companies investing in research and development to create durable, cost-effective, and environmentally friendly packaging are expected to gain a competitive edge. The integration of advanced materials and ergonomic designs will likely play a crucial role in shaping the future of the Food Packaging Market.
The market is segmented based on material type, packaging type, end-use category, and region. By material type, the market includes plastic, paper & paperboard, glass, metal, and biodegradable & compostable materials. In terms of packaging type, the market is categorized into rigid packaging, semi-rigid packaging, and flexible packaging.
By end-use category, the market comprises bakery & confectionery, dairy products, meat, poultry & seafood, ready-to-eat meals, fruits & vegetables, snacks & cereals, and beverages. Regionally, the market is analyzed across North America, Latin America, East Asia, South Asia & Pacific, Eastern Europe, Western Europe, Oceania, and the Middle East & Africa.

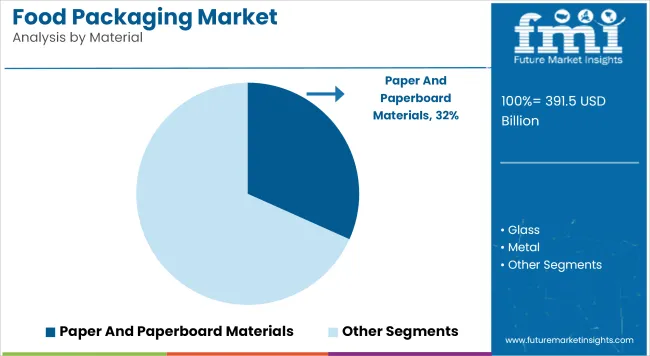
Paper and paperboard materials have been projected to capture 31.7% of the global food packaging market in 2025, driven by their sustainability, recyclability, and brand-friendly aesthetic. These materials have been used widely in boxes, wraps, and trays for packaging dry, baked, and chilled food products.
Their biodegradable nature has aligned closely with regulatory efforts and consumer expectations for low-impact packaging. High print compatibility has allowed paper-based packaging to carry clear branding, product information, and promotional designs.
Coated paperboard with moisture and grease resistance has been introduced for foodservice containers and takeaway cartons. Innovations in barrier coatings, such as bio-based laminates and PLA films, have enhanced shelf life while maintaining composability. Lightweight and foldable designs have been optimized for space-saving during storage and transit.
Recycled paperboard content has been increasingly adopted, particularly in secondary and tertiary packaging applications. Retailers and QSR chains have promoted paper-based containers as alternatives to plastic, often with compostable certifications. Dual-material formats combining paper with biopolymers have been launched for leak-proof ready-meal trays.
Regulatory bans on single-use plastics have accelerated investment in paper and molded fiber technologies. Paper-based packaging lines have been scaled for automation, offering fast throughput and flexibility across SKUs. Locking mechanisms and anti-tamper features have been added for secure food delivery packaging. QR codes and traceability markers have been easily printed onto these surfaces for enhanced supply chain visibility.

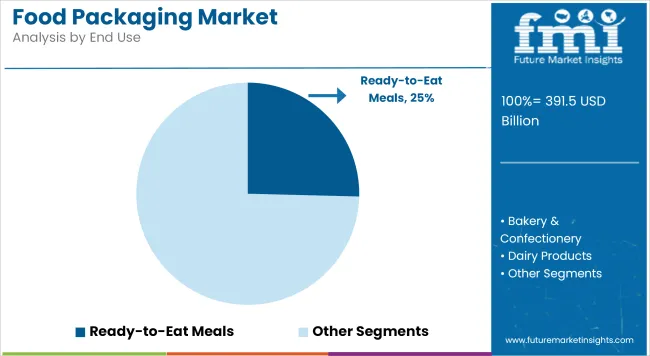
Ready-to-eat meals have been estimated to represent 25.4% of the global food packaging demand in 2025, driven by urbanization, busy lifestyles, and dual-income households. Single-serve trays, microwavable containers, and sealed pouches have been deployed to support extended shelf life and ease of consumption.
Thermoformed containers and paperboard trays with sealing films have been widely used across chilled and frozen categories. Leak-proof and tamper-evident formats have been preferred by convenience food brands and retailers.
Modified atmosphere packaging (MAP) and vacuum sealing technologies have been integrated to preserve freshness and maintain safety during transit. Microwave-safe materials such as coated paperboard and CPET trays have been selected for ready meals requiring heat activation. Clear lid windows and transparent films have enhanced product visibility for retail display.
Sustainability concerns have driven the use of recyclable mono-material films and compostable trays for eco-conscious meal packaging. Portion control and health-focused meal kits have prompted growth in compact, compartmentalized packaging styles. QR-coded labels have enabled consumers to track sourcing and nutritional details in premium ready meals.
Reusable designs for subscription-based meal services have also gained visibility in urban markets. Private-label brands and multinational food companies have invested in new automation-compatible formats to enhance packaging speed and reduce operational costs. Vending machine meals and airline catering trays have further fueled the adoption of high-barrier, ready-to-serve containers.
Regulatory Compliance and Sustainability Pressures
Regulatory challenges are ever-growing in the food packaging market as governments are implementing strict guidelines and infrastructure requirements due to rising food safety concerns, and increasing regulatory norms surrounding safety, labelling, and waste disposal across multiple regions. Compliance complexities for manufacturers arise due to different regulations around single-use plastics, chemical migration from packaging materials and recyclability standards.
To continue to respond to consumer demand for eco-friendly and biodegradable packaging, companies also need to invest continuously in research to develop materials that meet safety standards. Another challenge is to affect global market entry due to regional regulatory variations, companies must manage cumbersome approval processes to meet approval in several markets.
Rising Demand for Smart and Sustainable Packaging Solutions
As consumers become eco-friendlier, the need for packaging materials which can mold into biodegradable products, recyclable products and compostable products is increasing. Such companies find a competitive advantage in investing in sustainable alternatives (plant-based plastics, edible packaging and other paper-based solutions).
Moreover, smart packaging technologies, such as QR codes, temperature-sensitive labels, and RFID tracking, are revolutionizing the industry by increasing supply chain transparency, minimizing food waste, and enhancing consumer engagement. AI-enabled predictive analytics also drives smarter packaging design, allowing brands to optimize their use of materials and improve product safety.

United States food packaging market would continue envisioning strong growth owing to increasing demand for convenience foods, growing consumer awareness regarding sustainable packaging, and government regulations fostering implementation of food safety measures in packaging. There is a strong adoption of eco-friendly and biodegradable packaging solutions in the global market. Moreover, the expansion of online food delivery services is driving the need for well-designed and resilient packaging materials.
| Country | CAGR (2025 to 2035) |
|---|---|
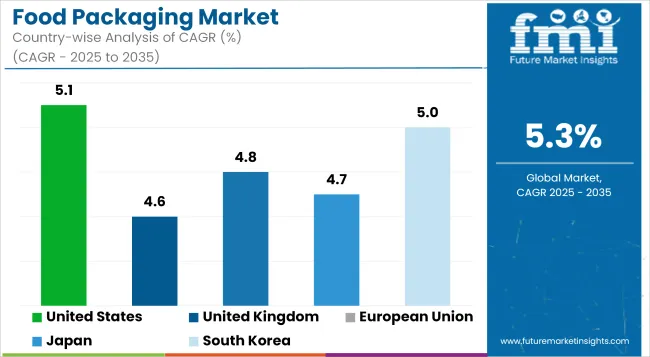
| United States | 5.1% |
The UK food packaging market is being driven by stringent environmental regulations, demand for recyclables packing, and increasing demand for ready-to-eat meals. Market growth is also being accelerated by the move towards more plant-based and sustainable food products.
| Country | CAGR (2025 to 2035) |
|---|---|
| United Kingdom | 4.6% |
The food packaging market in EU is growing at a steady rate, with the introduction of regulatory policies such as the European Green Deal along with the growing adoption of smart packaging technologies. Sustainable packaging solutions are being embraced by countries like Germany, France, and Italy. The growing e-commerce food industry and optimization toward plastic waste reduction are among the key factors driving the market during the forecast period.
| Country | CAGR (2025 to 2035) |
|---|---|
| European Union | 4.8% |
Food packaging market in Japan is entered with modern technological innovations, demand for premium packaging and food safety standards. A focus on quality packaging both aesthetic and functional in the country is leading demand for materials for ageing in casks and barrels throughout the beverage sector. Furthermore, government policies supporting biodegradable and smart packaging solutions are providing a positive thrust to the market growth.
| Country | CAGR (2025 to 2035) |
|---|---|
| Japan | 4.7% |
The market is mainly driven by the rapid growth of the food delivery market and the growing user preference for eco-friendly packaging in South Korea. Government regulation prohibiting single-use plastics, coupled with investment in sustainable packaging alternatives, is also driving demand. Moreover, the country is witnessing rising adoption of technological development in active & intelligent packaging.
| Country | CAGR (2025 to 2035) |
|---|---|
| South Korea | 5.0% |
The food packaging market is experiencing significant growth as a result of increasing consumer demand for convenience foods, a rise in demand for sustainability in packaging solutions, and strict food safety regulations.
As ready to eat meals, convenience foods, dairy products, and fresh produce become ever more popular, this news has magnified the need for effective, ruffling, and of course, eco-friendly packaging. To fulfil the amended requirements of the market, manufacturers are concentrating on innovations in biodegradable materials, smart packaging, and extended shelf-life technologies.
The move towards more sustainable and recyclable materials is one of the key trends which are impacting the market in which individual consumers as well as regulators in the world are highlighted to reduce plastic waste. Owing to the advances in food-grade packaging technology (including active and intelligent packaging), food preservation, freshness and safety are other areas in which science and technology contribute.
The plastic and paper-based segments of the material type segments hold the largest market share by revenue due to the versatility, durability, and cost-effectiveness. Still, metal and glass packages are important in certain food segments where some barrier functionalities and long shelf life are required.
In fact, plastic packaging is popular because it is light, cheap and can be designed in different shapes. It is a very important part quality preservation, preventing contamination, and improving shelf stability. But environmental issues surrounding plastics waste are driving manufacturers to biodegradable and recyclable plastics, including polylactic acid (PLA) and polyethylene terephthalate (PET).
Whether for bakery, confectionery or fresh produce applications, paper-based packaging is steadily emerging as a more sustainable alternative to plastic. Also driving innovation are companies looking for more moisture and grease resistant fiber based materials and coatings to support the growth of compostable and recyclable paper packaging demand.
Metal packaging not only provides great barrier properties and durability, it is primarily used for canned foods and drinks. It is especially common for products such as dairy, ready-to-eat meals, and preserved foods. But the higher cost and weight issues are stumbling blocks to wider use.
Glass vs. Other materials glass packaging is a popular choice for premium food products and beverages due to their premium barrier protection, lack of reactivity and recyclability. In the organic and gourmet food sector, where maintaining the original taste and quality of food products is critical, the demand for glass packaging is on the rise.
Growing sustainability concerns to drive emergence of paper-based/ biodegradable plastics as the fastest growing product for packaging demand growth in a given packaging material for a respective application is highly dependent on the product composition as well as life cycle, and environmental impact.
In terms of application, the ready-to-eat meals and dairy products segments dominate the market, supported by growing demand for convenience foods and dairy-based nutrition. Pastry, confectionery and floppy natto are just a few of the growing packaging opportunities.
The ready to eat meal packaging would grow owing to the modifying lifestyles, urbanization and necessity for muscle-free now and then meal choices. Microwaveable trays, vacuum-sealed containers, and modified atmosphere packaging (MAP) are some of the packaging solutions taking over the market to preserve the freshness and shelf life of products.
Food & Beverage-Dairy product packaging is one of the top trends in preventing contamination, maintaining product integrity, and shelf stability in dairy. These may be in cartons, plastic pouches, glass bottles or metal cans, with a growing trend towards using sustainable and aseptic packaging solutions.
Bakery & Confectionery Packaging-This type of packaging involves specialized material for packaging to resist moisture, preserve texture, and offer enhanced visibility. There is an increase in the demand for stand-up pouches, paper-based wrappers, and resalable packaging in this segment to meet the changing consumer's preferences.
Fresh produce packaging focuses on breathable and biodegradable solutions that keep the product fresh and limit food waste. Film surfaces made of bioplastic and compostable trays are increasingly used to improve supply chain efficiency and food safety, along with smart packaging technologies.
Innovative and sustainable packaging solutions will drive the evolution of the food packaging market, as they are responding to increasing consumer expectations regarding sustainability, convenience, and food safety.
The food packaging market has seen significant growth if we take into account the endless demand for convenience food, sustainability, and advanced packaging technologies. To meet the changing consumer and regulatory demands, manufacturers are emphasizing on biodegradable materials, intelligent packaging solutions, and shelf life extension technologies. The market is additionally propelled by the rapid growth of e-commerce grocery sales and meal kits.
All Other Main Competitors
The overall market size for the food packaging market was USD 391,500 million in 2025.
The food packaging market is expected to reach USD 661,200 million in 2035.
The demand for food packaging is expected to rise due to increasing consumer demand for convenient, sustainable, and safe food packaging solutions.
The top five countries driving the development of the food packaging market are the USA, China, India, Germany, and Japan.
Flexible packaging and rigid packaging are expected to command a significant share over the assessment period.


Our Research Products

The "Full Research Suite" delivers actionable market intel, deep dives on markets or technologies, so clients act faster, cut risk, and unlock growth.

The Leaderboard benchmarks and ranks top vendors, classifying them as Established Leaders, Leading Challengers, or Disruptors & Challengers.

Locates where complements amplify value and substitutes erode it, forecasting net impact by horizon

We deliver granular, decision-grade intel: market sizing, 5-year forecasts, pricing, adoption, usage, revenue, and operational KPIs—plus competitor tracking, regulation, and value chains—across 60 countries broadly.

Spot the shifts before they hit your P&L. We track inflection points, adoption curves, pricing moves, and ecosystem plays to show where demand is heading, why it is changing, and what to do next across high-growth markets and disruptive tech

Real-time reads of user behavior. We track shifting priorities, perceptions of today’s and next-gen services, and provider experience, then pace how fast tech moves from trial to adoption, blending buyer, consumer, and channel inputs with social signals (#WhySwitch, #UX).

Partner with our analyst team to build a custom report designed around your business priorities. From analysing market trends to assessing competitors or crafting bespoke datasets, we tailor insights to your needs.
Supplier Intelligence
Discovery & Profiling
Capacity & Footprint
Performance & Risk
Compliance & Governance
Commercial Readiness
Who Supplies Whom
Scorecards & Shortlists
Playbooks & Docs
Category Intelligence
Definition & Scope
Demand & Use Cases
Cost Drivers
Market Structure
Supply Chain Map
Trade & Policy
Operating Norms
Deliverables
Buyer Intelligence
Account Basics
Spend & Scope
Procurement Model
Vendor Requirements
Terms & Policies
Entry Strategy
Pain Points & Triggers
Outputs
Pricing Analysis
Benchmarks
Trends
Should-Cost
Indexation
Landed Cost
Commercial Terms
Deliverables
Brand Analysis
Positioning & Value Prop
Share & Presence
Customer Evidence
Go-to-Market
Digital & Reputation
Compliance & Trust
KPIs & Gaps
Outputs
Full Research Suite comprises of:
Market outlook & trends analysis
Interviews & case studies
Strategic recommendations
Vendor profiles & capabilities analysis
5-year forecasts
8 regions and 60+ country-level data splits
Market segment data splits
12 months of continuous data updates
DELIVERED AS:
PDF EXCEL ONLINE
Food Packaging Film Market Size and Share Forecast Outlook 2025 to 2035
Food Packaging Machines Market Size and Share Forecast Outlook 2025 to 2035
Food Packaging Films Market Size and Share Forecast Outlook 2025 to 2035
Food Packaging Tester Market Size and Share Forecast Outlook 2025 to 2035
Market Share Breakdown of Food Packaging Film Providers
Food Packaging Equipment Market
Food Tub packaging Market Size and Share Forecast Outlook 2025 to 2035
Seafood Packaging Market Size and Share Forecast Outlook 2025 to 2035
Seafood Packaging Market Size, Share & Forecast 2025 to 2035
Food Grade Packaging Market Insights – Demand, Size & Industry Trends 2025-2035
Evaluating Seafood Packaging Market Share & Provider Insights
Food Powder Packaging Machine Market Size and Share Forecast Outlook 2025 to 2035
Analyzing Food Powder Packaging Machine Market Share & Industry Trends
Pet Food Packaging Industry Analysis in Europe - Size, Share, and Forecast 2025 to 2035
Baby Food Packaging Market Analysis - Size, Share, and Forecast Outlook 2025 to 2035
PVDC Food Packaging Market
Fresh Food Packaging Market Forecast and Outlook 2025 to 2035
Smart Food Packaging Market Size and Share Forecast Outlook 2025 to 2035
Rigid Food Packaging Market Size, Share & Forecast 2025 to 2035
Assessing Snack Food Packaging Market Share & Industry Trends

Thank you!
You will receive an email from our Business Development Manager. Please be sure to check your SPAM/JUNK folder too.
Chat With
MaRIA