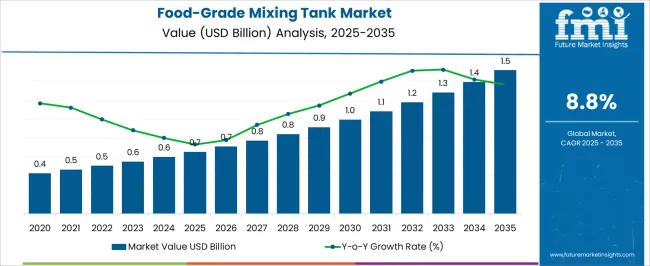
The Food-Grade Mixing Tank Market is estimated to be valued at USD 0.7 billion in 2025 and is projected to reach USD 1.5 billion by 2035, registering a compound annual growth rate (CAGR) of 8.8% over the forecast period.
| Metric | Value |
|---|---|
| Food-Grade Mixing Tank Market Estimated Value in (2025 E) | USD 0.7 billion |
| Food-Grade Mixing Tank Market Forecast Value in (2035 F) | USD 1.5 billion |
| Forecast CAGR (2025 to 2035) | 8.8% |
The Food-Grade Mixing Tank market is progressing steadily, driven by rising hygiene standards and demand for advanced mixing technologies in food and beverage processing. Industry insights from manufacturing and engineering publications indicate a growing emphasis on automation, clean-in-place compatibility, and sanitary design, which are becoming critical purchase factors for processors. Investments in dairy, beverage, and confectionery production facilities have increased, with companies aiming to improve batch consistency and reduce contamination risks.
Annual reports and press briefings by leading manufacturers highlight a trend toward stainless steel-based modular tank systems that allow better customization and integration with high-speed mixing equipment. As food safety regulations continue to tighten globally, equipment designed for precise mixing under strict quality control is gaining traction.
Future growth opportunities are expected to be shaped by the expansion of functional foods, plant-based alternatives, and clean-label formulations These trends, along with capacity expansion in mid- and large-scale production, are anticipated to sustain demand for food-grade mixing tanks across regions.
The market is segmented by Product Type, Technology, and Capacity and region. By Product Type, the market is divided into Batch-wise Mixing Tank and Continuous Mixing Tank. In terms of Technology, the market is classified into High Shear Mixer Tank and Planetary Mixer Tank. Based on Capacity, the market is segmented into 10,000 litres per hour to 40,000 litres per hour, Less than 10,000 litres per hour, and Over 40,000 litres per hour. Regionally, the market is classified into North America, Latin America, Western Europe, Eastern Europe, Balkan & Baltic Countries, Russia & Belarus, Central Asia, East Asia, South Asia & Pacific, and the Middle East & Africa.
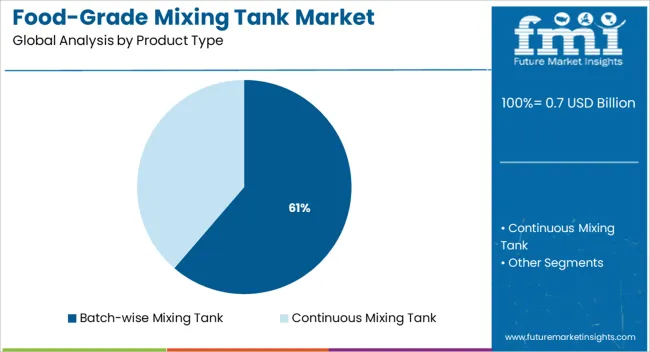
The batch-wise mixing tank segment is projected to account for 61.3% of the Food-Grade Mixing Tank market revenue share in 2025, making it the dominant product type. This leadership is being supported by its operational flexibility and compatibility with small to medium-volume production runs. Batch-wise systems have been widely adopted by food manufacturers aiming for high product variety and frequent changeovers.
Engineering publications note that these tanks are favored due to their ease of cleaning and ability to support multiple recipes with reduced cross-contamination risk. Investor updates and facility expansion announcements reflect that such systems are especially relevant in dairy, sauces, and specialty food production, where precision and batch control are essential.
Additionally, lower capital investment compared to continuous systems has made batch-wise tanks more accessible to mid-sized processors Their modularity and integration with automated controls are further contributing to operational efficiency, making them a preferred solution in food-grade applications.
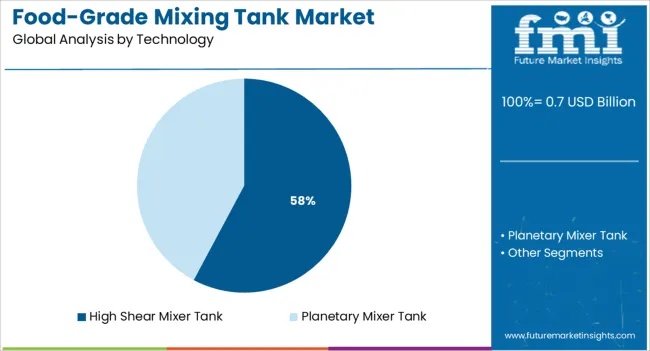
The high shear mixer tank segment is anticipated to hold 57.8% of the Food-Grade Mixing Tank market revenue share in 2025, establishing itself as the leading technology. This dominance is being driven by its capability to deliver superior dispersion, emulsification, and homogenization for complex food formulations. Technical briefs and product releases emphasize that high shear tanks are essential in producing sauces, dairy emulsions, and other formulations that require tight particle size control.
Manufacturers are increasingly adopting this technology to improve product consistency and reduce processing time, both of which contribute to higher throughput and reduced waste. Operational efficiencies achieved through rapid mixing and uniform results are reinforcing its position across various food processing lines.
Additionally, its compatibility with high-viscosity ingredients and ability to integrate into automated systems has made it highly suitable for modern food production environments These advantages are enabling the high shear mixer tank segment to maintain a leading market share.
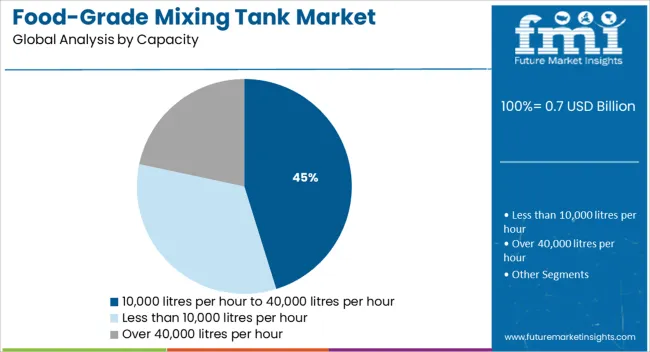
The capacity segment ranging from 10,000 litres per hour to 40,000 litres per hour is expected to hold 45.2% of the Food-Grade Mixing Tank market revenue share in 2025. Its prominence is being shaped by increasing demand from mid-scale and large-scale food producers who require high-volume throughput without compromising on mixing quality. Facility investment updates and production scaling announcements have indicated that this capacity range is well-suited for operations aiming to meet growing consumer demand while maintaining flexibility in product offerings.
Tanks within this range are being preferred due to their balance between scalability and manageable energy consumption. Process engineers and plant designers often highlight that this capacity segment provides an optimal footprint-to-output ratio, particularly in space-constrained facilities.
Additionally, the integration of automated controls, real-time monitoring, and cleaning systems at this scale is facilitating compliance with global food safety standards These operational and regulatory advantages are supporting the segment’s sustained growth across food and beverage sectors.
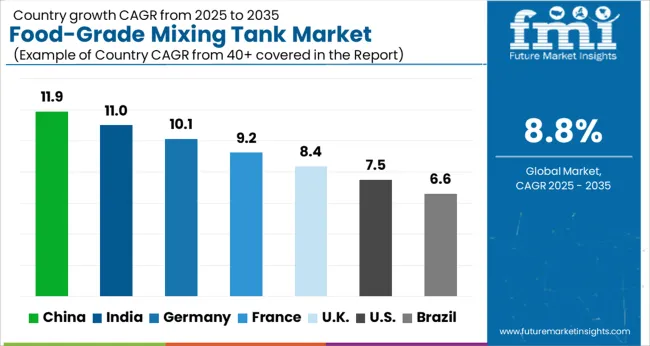
The global demand for food-grade mixing tanks is anticipated to grow at 8.8% CAGR between 2025 and 2035 in comparison to the 6.5% CAGR registered during the historical period from 2020 to 2025.
The rapid expansion of food & beverage, bakery, dairy, and confectionery industries across the world and subsequent usage of mixing tanks across these sectors are some of the key factors driving the global food-grade mixing tank market.
Similarly, increasing penetration of automation in the food manufacturing industry and growing consumer preference towards processed foods due to busy lifestyles and increasing disposable income are expected to push the demand for food-grade mixing tanks during the projection period.
In addition, advancements in food mixing technology, new product launches by key players, and the rising focus of food manufacturers to increase their productivity will further expand the global food-grade mixing tank market size over the next decade.
Rapid Growth of End-Use Industries and Growing Focus Toward Improving Food Hygiene to Boost Market During the Next Ten Years
According to FMI, massive growth in the beverage, dairy, and confectionery industries due to the rapidly growing population, changing lifestyles, and increasing consumption of processed foods and beverages, is likely to boost the global food-grade mixing tank market during the forecast period.
As the demand in the dairy, confectionery and bakery industries grows, food service organizations are focusing their efforts on providing quality products to their clients. They are using automated food-grade mixing tanks to avoid direct contact, reduce contamination, and improve food quality and safety. This will continue to support the market expansion over the next ten years.
Similarly, advances in the e-commerce sector have made food-grade mixing tanks more readily available. As a result, the global market has been influenced by the increased usage of an e-commerce platform for the procurement of food-grade mixing tanks.
Furthermore, widening application in the food and beverage sector and collaboration between beverage players and food-grade mixer equipment manufacturers are expected to bode well for the overall market.
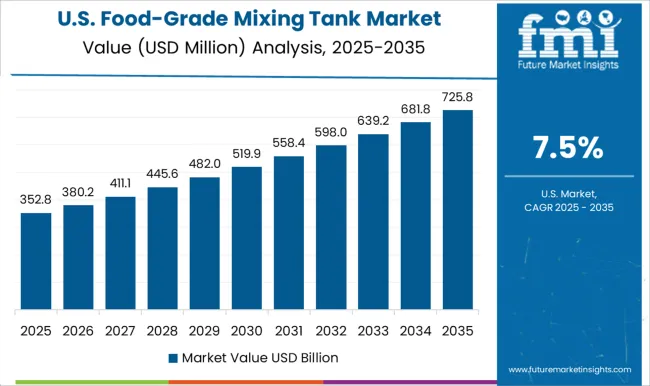
Growing Demand for Processed Food Products boosting Market in the USA.
According to FMI, the USD food-grade mixing tanks market is expected to surpass a valuation of USD0.7 Million in 2025, accounting for 68% of the North American food-grade mixing tank market.
Rising demand for processing foods, beverages, and dairy products due to changing lifestyles, growing consumer awareness, and increasing disposable income is driving demand for food-grade mixing tanks in the USA market.
Similarly, the growing adoption of advanced processing equipment such as food-grade mixing tanks across food manufacturing industries to improve food quality and hygiene, reduce mixing times, and increase overall productivity is likely to fuel sales during the next ten years.
Increasing Popularity of Fizzy Drinks Pushing Demand in the UK Market
The food-grade mixing tank market in the UK is currently valued at USD 38.7 Million and it accounts for roughly 22% of the European market. Rising demand for fast food and sugary drinks, growing food insecurity concerns, and advancements in mixing technology are some of the key factors driving the UK food-grade mixing tank market.
Manufacturers of food-grade mixing tanks across the UK are offering more and more advanced solutions to the beverage industry as demand for mixer tanks for fizzy drinks and other beverages continues to increase. This will further boost the market in the country.
Rapid Expansion of Confectionery Industry Fuelling Sales in China
China's food-grade mixing tank market is expected to surpass USD 31.7 Million in 2025 and it is likely to account for 32% market share in the Asia-Pacific food-grade mixer tank industry. The rapid expansion of the confectionery industry, increasing consumption of ready-to-eat foods, and favorable government support are driving the food-grade mixing tank market forward in China.
China's confectionery business has strong long-term prospects, thanks to the introduction of new flavor confectionery items and huge demand potential from rural areas. People are spending large amounts on various confectioneries to fulfill their appetites.
Increasing Adoption Across Diverse End-Use Industries Boosting Demand
Based on technology, the global food-grade mixing tank market is segmented into high-shear mixer tanks and planetary mixer tanks.
Among these, the high-shear mixer tank segment is likely to hold the largest share of the global market and further grow at a robust pace during the next ten years. This can be attributed to the rising adoption of high-shear mixer tanks across end-use industries like food & beverages, confectionery, and bakery due to their cost-effective nature.
However, the planetary mixer tank segment is expected to grow at a higher CAGR during the projection period owing to their increasing usage across the food and beverage industry for intense mixing applications.
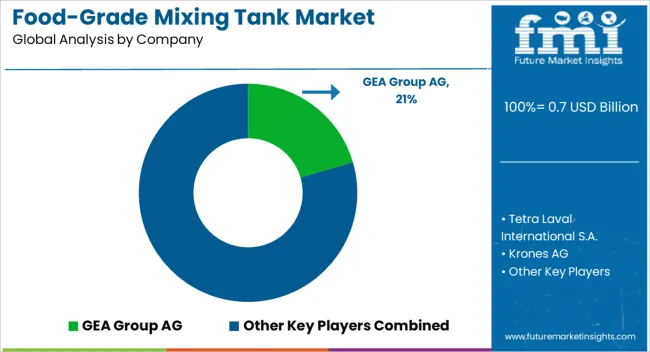
Leading players operating in the global food-grade mixing tank market are adopting various organic and inorganic strategies such as new product launches, partnerships, facility expansions, mergers, and collaborations to gain a competitive edge in the market. for instance,
With lucrative opportunities on the horizon, various start-ups are entering the food-grade mixing tank market space. For instance, Shandong Tonsenbrew Co., Ltd, a professional designer, developer, manufacturer, and seller of brewery equipment, food & beverage processing tanks, and pharmaceutical & chemical machinery was founded in 2020 in Jinan China.
The company offers various types of food & beverage processing machines including sanitary stainless storage tanks, mixing tanks, milk tanks, hot and cold tanks, fermentation tanks, asepsis storage tanks, etc. Since its establishment in 2020, Shandong has become an ideal destination for industries looking to get quality food-grade mixing tanks.
Shandong adheres to the principle of customer first, quality first, and life-long service, and under this guidance, constantly strives to improve its own level. The company is focused on developing and supplying various types of food-grade mixing tanks to a wide range of industries.
| Attribute | Details |
|---|---|
| Estimated Market Size (2025) | USD 0.7 billion |
| Projected Market Size (2035) | USD 1.5 billion |
| Anticipated Growth Rate (2025 to 2035) | 8.8% CAGR |
| Forecast Period | 2025 to 2035 |
| Historical Data Available for | 2020 to 2025 |
| Market Analysis | USD Million for Value and Units for Volume |
| Key Regions Covered | North America; Latin America; Europe; Asia Pacific; Oceania; Middle East & Africa (MEA) |
| Key Countries Covered | The USA, Canada, Mexico, Germany, The UK, France, Italy, Spain, China, Japan, India, South Korea, Malaysia, Thailand, Indonesia, Australia, Brazil, Argentina, South Africa, UAE |
| Key Segments Covered | Product Type, Technology, Capacity, Region |
| Key Companies Profiled | GEA Group AG; Tetra Laval International S.A.; Krones AG; Sulzer Ltd; Buhler Holding AG; JBT Corporation; KHS GmbH; Marel hf; Hosokawa Micron Corporation.; ICC Northwest; Pulsair system, Inc.; Frain Industries, Inc.; G and F Manufacturing Company Inc.; Heritage Equipment Company; SIEHE Industry; Apache Stainless Equipment Corporation |
| Report Coverage | Market Forecast, Company Share Analysis, Competitive Landscape, DROT Analysis, Market Dynamics and Challenges, and Strategic Growth Initiatives |
The global food-grade mixing tank market is estimated to be valued at USD 0.7 billion in 2025.
The market size for the food-grade mixing tank market is projected to reach USD 1.5 billion by 2035.
The food-grade mixing tank market is expected to grow at a 8.8% CAGR between 2025 and 2035.
The key product types in food-grade mixing tank market are batch-wise mixing tank and continuous mixing tank.
In terms of technology, high shear mixer tank segment to command 57.8% share in the food-grade mixing tank market in 2025.


Our Research Products

The "Full Research Suite" delivers actionable market intel, deep dives on markets or technologies, so clients act faster, cut risk, and unlock growth.

The Leaderboard benchmarks and ranks top vendors, classifying them as Established Leaders, Leading Challengers, or Disruptors & Challengers.

Locates where complements amplify value and substitutes erode it, forecasting net impact by horizon

We deliver granular, decision-grade intel: market sizing, 5-year forecasts, pricing, adoption, usage, revenue, and operational KPIs—plus competitor tracking, regulation, and value chains—across 60 countries broadly.

Spot the shifts before they hit your P&L. We track inflection points, adoption curves, pricing moves, and ecosystem plays to show where demand is heading, why it is changing, and what to do next across high-growth markets and disruptive tech

Real-time reads of user behavior. We track shifting priorities, perceptions of today’s and next-gen services, and provider experience, then pace how fast tech moves from trial to adoption, blending buyer, consumer, and channel inputs with social signals (#WhySwitch, #UX).

Partner with our analyst team to build a custom report designed around your business priorities. From analysing market trends to assessing competitors or crafting bespoke datasets, we tailor insights to your needs.
Supplier Intelligence
Discovery & Profiling
Capacity & Footprint
Performance & Risk
Compliance & Governance
Commercial Readiness
Who Supplies Whom
Scorecards & Shortlists
Playbooks & Docs
Category Intelligence
Definition & Scope
Demand & Use Cases
Cost Drivers
Market Structure
Supply Chain Map
Trade & Policy
Operating Norms
Deliverables
Buyer Intelligence
Account Basics
Spend & Scope
Procurement Model
Vendor Requirements
Terms & Policies
Entry Strategy
Pain Points & Triggers
Outputs
Pricing Analysis
Benchmarks
Trends
Should-Cost
Indexation
Landed Cost
Commercial Terms
Deliverables
Brand Analysis
Positioning & Value Prop
Share & Presence
Customer Evidence
Go-to-Market
Digital & Reputation
Compliance & Trust
KPIs & Gaps
Outputs
Full Research Suite comprises of:
Market outlook & trends analysis
Interviews & case studies
Strategic recommendations
Vendor profiles & capabilities analysis
5-year forecasts
8 regions and 60+ country-level data splits
Market segment data splits
12 months of continuous data updates
DELIVERED AS:
PDF EXCEL ONLINE
Tanker Truck Market Size and Share Forecast Outlook 2025 to 2035
Mixing Console Market by Type, Sales Channel, Application & Region Forecast till 2025 to 2035
Tank Insulation Market Growth – Trends & Forecast 2024-2034
LNG Tank Containers Market Size and Share Forecast Outlook 2025 to 2035
CNG Tanks Cylinders Market Growth - Trends & Forecast 2025 to 2035
ISO Tank Container Market Growth – Trends & Forecast 2024-2034
CIP Tank Market Growth – Trends & Forecast 2024-2034
Ink Tank Printer Market
Foam Mixing Machine Market Size and Share Forecast Outlook 2025 to 2035
Rail Tank Cars Market Size and Share Forecast Outlook 2025 to 2035
Fish Tank Water Additives Market Trends - Growth & Demand Forecast 2025 to 2035
Milk Tank Cooling System Market Growth – Trends & Forecast 2025 to 2035
Brine Tank for Water Softener Market Size and Share Forecast Outlook 2025 to 2035
Water Tanker Truck Market Size and Share Forecast Outlook 2025 to 2035
Stock Tank Market Size and Share Forecast Outlook 2025 to 2035
Paint Mixing Market Analysis - Size, Share, and Forecast Outlook for 2025-2035
Surge Tanks Market Growth - Trends & Forecast 2025 to 2035
Vacuum Mixing Devices Market Analysis - Size, Share & Forecast 2025 to 2035
Shrink Tanks Market
Polymer Mixing Unit Market Size and Share Forecast Outlook 2025 to 2035

Thank you!
You will receive an email from our Business Development Manager. Please be sure to check your SPAM/JUNK folder too.
Chat With
MaRIA