The Food Extruder Market is estimated to be valued at USD 64.3 billion in 2025 and is projected to reach USD 94.3 billion by 2035, registering a compound annual growth rate (CAGR) of 3.9% over the forecast period.
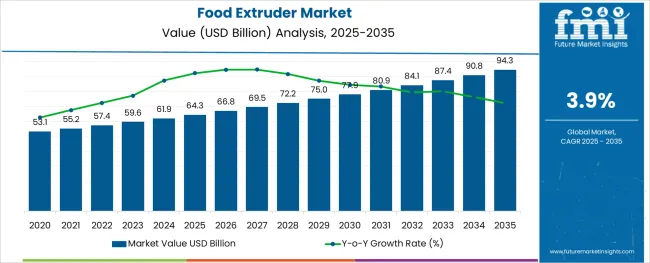
The food extruder market is witnessing sustained growth as technological innovation, changing dietary patterns, and rising demand for processed and functional foods reshape the competitive landscape. The market is being driven by the ability of extrusion technology to deliver high throughput, consistent product quality, and versatility across a range of food categories.
Growing consumer preference for ready-to-eat, fortified, and plant-based products is motivating manufacturers to adopt advanced extrusion systems that support complex formulations and efficient production. Future growth is expected to be supported by automation trends, energy-efficient designs, and growing investments in emerging markets where processed food consumption is accelerating.
Strategic collaborations between equipment manufacturers and food producers are paving the way for innovative solutions tailored to evolving consumer and regulatory demands, ensuring the long-term viability of extrusion technology in the food industry.
The market is segmented by Type, End Use, and Sales Channel and region. By Type, the market is divided into Twin Screw Extruders, Single Screw Extruders, and Contra Twin Screw Extruders. In terms of End Use, the market is classified into Food Processing, Bakery Confectionaries, and Others. Based on Sales Channel, the market is segmented into Direct and Retail Sales. Regionally, the market is classified into North America, Latin America, Western Europe, Eastern Europe, Balkan & Baltic Countries, Russia & Belarus, Central Asia, East Asia, South Asia & Pacific, and the Middle East & Africa.
The market is segmented by Type, End Use, and Sales Channel and region. By Type, the market is divided into Twin Screw Extruders, Single Screw Extruders, and Contra Twin Screw Extruders. In terms of End Use, the market is classified into Food Processing, Bakery Confectionaries, and Others. Based on Sales Channel, the market is segmented into Direct and Retail Sales. Regionally, the market is classified into North America, Latin America, Western Europe, Eastern Europe, Balkan & Baltic Countries, Russia & Belarus, Central Asia, East Asia, South Asia & Pacific, and the Middle East & Africa.
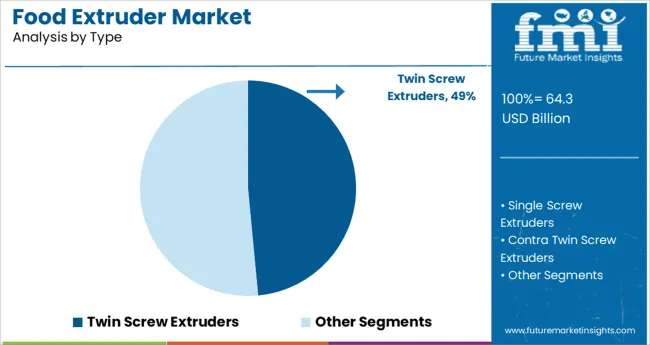
When segmented by type, the twin screw extruders segment is expected to hold 48.5% of the total market revenue in 2025, establishing itself as the leading type segment. This leadership is attributed to the superior versatility and processing capabilities of twin screw systems, which have enabled precise control over texture, moisture, and ingredient distribution in complex formulations.
The ability to handle high-fiber and high-protein ingredients while maintaining product quality has positioned this segment strongly within both traditional and emerging food categories. Enhanced energy efficiency and ease of cleaning have further contributed to operational benefits, supporting adoption across food manufacturers seeking both productivity and compliance.
The adaptability of twin screw extruders to various product lines and their ability to support innovation have reinforced their prominence as the preferred choice for producers targeting diverse and premium food offerings.
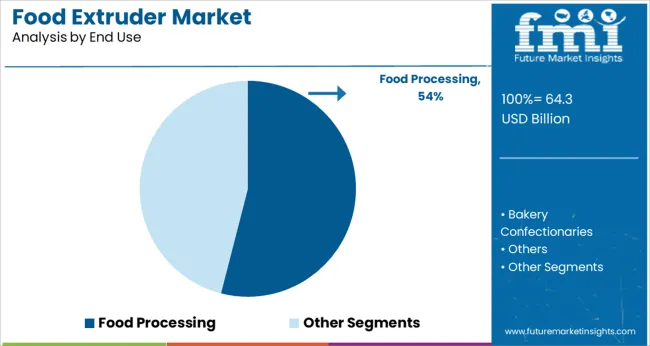
Segmented by end use, the food processing segment is forecast to command 54.0% of the market revenue in 2025, maintaining its dominant position. This prominence has been strengthened by the growing scale and complexity of modern food production, which has necessitated reliable, high-capacity extrusion systems to meet rising demand.
The ability of extruders to produce a wide array of products including snacks, cereals, and alternative proteins has driven extensive deployment within processing facilities. Manufacturers have increasingly prioritized extrusion technology to optimize production efficiency, meet evolving consumer tastes, and ensure compliance with food safety standards.
The segment’s leadership is also supported by investments in modernizing processing plants, where extrusion serves as a core technology enabling cost-effective mass production and product innovation, consolidating its critical role in the food value chain.
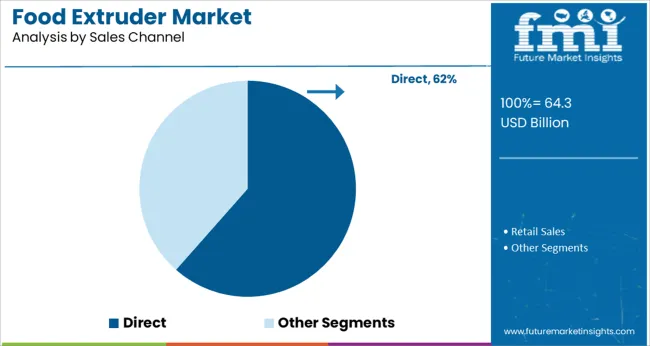
When segmented by sales channel, the direct segment is projected to capture 61.5% of the market revenue in 2025, emerging as the leading channel. This dominance has been reinforced by the preference of manufacturers to engage directly with equipment suppliers for customized solutions, technical support, and after-sales service.
Direct sales have enabled closer collaboration between buyers and suppliers, facilitating tailored designs that align with specific production requirements and regulatory expectations. The complexity of extrusion systems and the need for specialized installation, maintenance, and operator training have further driven reliance on direct engagements.
This approach has also ensured higher accountability, faster response times, and stronger partnerships, which have collectively solidified direct sales as the primary channel of choice among food manufacturers investing in extrusion technology.
By 2035, the food extruder market is predicted by FMI to reach over USD 64.3 billion. In the first half of 2025, the global food extruder market increased by 4.9% which is the market share valued at USD 64.3 billion. Though not equally distributed throughout all regions, this growth is stronger in developing markets, where it is predicted to reach at the end of 2025 valued at USD 59.6 billion with a CAGR of 3.9%.
Based on extruder type, the market is segmented as single screw extruders, twin screw extruders, and contra twin screw extruders. Recent research has shown the single screw extruder to grow at a CAGR worth 4.7% in the year 2020 to 2025. The market during the period 2025 to 2035 registered a CAGR of 3.2%.
Food Extruder Market:
| Attributes | Food Extruder Market |
|---|---|
| CAGR (2025 to 2035) | 3.9% |
| Market Value (2035) | USD 72.16 billion |
| Growth Factor | There is a dramatic increase in the popularity of processed foods across the globe due to their convenience, taste appeal, and increased awareness about healthy eating practices. |
| Opportunity | Developing new extruded food products, expanding the processed food sector through government initiatives, and exploiting untapped opportunities |
| Key Trends | Health-conscious individuals are seeking healthy snacks in developed as well as developing countries as lifestyle diseases increase |
Plant-based Food Market:
| Attributes | Plant-based Food Market |
|---|---|
| CAGR (2025 to 2035) | 11.7% |
| Market Value (2035) | USD 16.35 billion |
| Growth Factor | Several food industry pioneers have launched products in this segment and there has been a growing awareness of the health and environmental benefits of plant-based foods over animal-based foods. |
| Opportunity | Increasing consumer interest in healthier food alternatives to animal-based products and diverse ingredients |
| Key Trends | Vegan restaurants are becoming more popular as consumers become more health conscious. |
Pet Food Extrusion Market:
| Attributes | Pet Food Extrusion Market |
|---|---|
| CAGR (2025 to 2035) | 5.6% |
| Market Value (2035) | USD 100.73billion |
| Growth Factor | The increasing pet population coupled with rising spending on different pet food products by pet owners. |
| Opportunity | The increasing popularity of pet food extrusion equipment and the benefits of the extrusion process in pet food such as the removal of toxic compounds and microorganisms, and enhancement in food digestibility. |
| Key Trends | Pet owners consider their pets to be part of the family and provide nutritional pet food products. |
Processed Foods are in High Demand
The growth of the processed food industry drives the food extrusion market. Moreover, the urban population of developing nations is likely to have a positive impact on the demand for processed products, in turn driving the demand for food extrusion equipment as well.
There has been a gradual shift in consumer preferences over the last two decades from ready-to-eat items and traditional breakfast and snack meals into ready-to-eat options in emerging nations such as China, India, Brazil, and the Middle East.
An Increase in Personal Disposable Income
One of the main reasons behind the successful expansion of the food extrusion industry is the increasing number of people with disposable income and the rising standard of living, especially in developing economies.
In addition to the factors mentioned above, there are several other factors contributing to the development of the food extrusion market, such as changing lifestyles, modernization, a rise in the demand for packaged and processed foods in Western nations, and an ever-increasing world population.
With the advancement of the food distribution channel, the popularity of nutritional eatables, as well as the increase in research and development expenditures, the value of the food extrusion market will continue to rise.
Growing Awareness of Healthy Eating Habits
Healthy eating habits are becoming increasingly relevant to people. As a result, consumers are increasingly looking for healthier alternatives, such as whole-grain pasta and fruit and vegetable snacks. This market is expected to grow in the coming years due to the use of food extruders in the production of these healthier alternatives.
Volatile Nature of the Prices of Raw Materials
Due to the changing climatic conditions across the globe, the production of raw materials such as potatoes, corn, and tapioca has been reduced. The demand for snack pellets is on the rise, but snack pellet manufacturers are struggling to meet the growing demand due to a shortage of raw materials.
Due to this volatility factor, other raw materials, such as wheat and vegetable oil, have experienced price fluctuations of more than 40%. In addition, natural gas has seen its price fluctuate by more than 25%, as well. Aside from this, the high prices of the ingredients that are used in snack pellets, such as binding agents and savory flavors, also act as a restraint.
Since the raw material prices for snack pellets have increased in recent years, manufacturers are experiencing a decline in their profit margins as a result of an increase in the prices of raw materials.
New Product Launches and Updated Product Developments
As the processed food industry has evolved in recent years, new players have emerged, snack portfolios have expanded through continual product innovation, marketing campaigns have been aggressive to establish supplier-consumer relationships, and consumption patterns have changed as convenience food demand has increased.
Furthermore, due to the rise in sedentary lifestyles and the occurrence of lifestyle diseases both in developed and developing countries, there is an increasing desire for healthy snacks. This is due to the rise in sedentary lifestyles and lifestyle diseases caused by sedentary lifestyles. As a result of this growth in demand, existing as well as new players will have attractive opportunities in the future to meet this demand.
Operational Complexity during the Processing of Food
The viscosity, screw speed, temperature, and pressure along with the complexity of the mathematical description of the process play a very substantial role in the efficiency of the process.
As a result, the dynamics of this process make it difficult to develop accurate dynamic models of the extrusion process. Furthermore, several load variables affect viscosity regulation. These load variables are dependent on the choice of the manipulation variable and can cause disturbances during the process.
In addition, additional caution should be taken while processing functional products since nutrients in the ingredients may be lost in the processing process.
It is identified that the single screw food extruder is operated as the most recognized in the extruder type category and has accounted for major shares during the base year. Currently, the single screw extruder segment is anticipated to propel at a substantial rate growing at a CAGR of 4.7% during the base period of 2020 to 2025. The reasons attributing to the steady advancement of the single screw food extruder market are identified as follows:
The food extruder's most recognized end-use segment is food processing, and it accounts for major shares during the base year. A CAGR of 4.1% is expected to be achieved during the base period of 2020 to 2025 in the food-processed end-use segment. Among the most common types of Food Extruders, the gas machine is the most popular because it can be run using natural gas or bottled propane depending on the utility provider's policies.
Food extruder manufacturers in Europe benefit from the development of a snack food market that presents opportunistic growth opportunities. Eastern & South-eastern European countries are expected to drive food market growth in this region by increasing the consumption of processed products.
In this region, increasing consumption of snack products has also forced manufacturers to source extruded snack products from other parts of the world to guarantee an uninterrupted supply of raw materials, since domestic production is insufficient to meet the demands of the European food industry.
North America accounted for the largest share of the global food extruder market due to industries such as food and beverage, pharmaceuticals, and animal feed. There are technological advancements in food extruders along with a well-established manufacturing sector in the region. Additionally, consumers are becoming increasingly aware of the health benefits associated with specific ingredients used in processed foods.
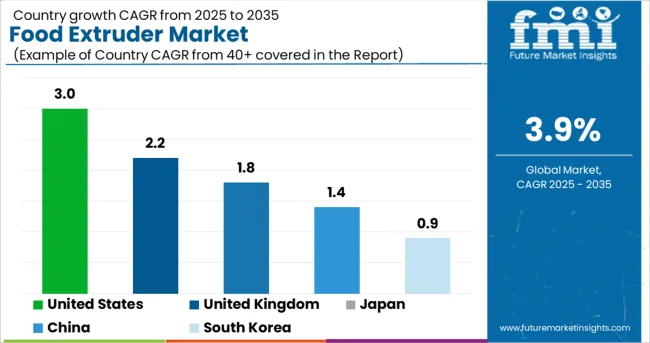
| Countries | Statistics |
|---|---|
| United States | The food extruder market in the USA currently holds the maximum number of shares and has registered a market valuation of USD 64.3 billion in 2025. The market is projected to reach a valuation of USD 94.3 billion by the end of 2035. CAGR for 2025 to 2035: 3% Historical CAGR (2020 to 2025): 4.6% |
| United Kingdom | Europe is identified to hold a significant market share in the food extruder market. Currently, the United Kingdom is the leading country in this region and is accountable for a market valuation of USD 647.3 million in 2025, advancing at a moderate-paced CAGR of 2.2%. The market valuation is expected to surpass USD 3.4 billion by 2035. Historical CAGR (2020 to 2025): 3.6% |
| China | China is projected to advance at a rapid pace, registering a CAGR of 2.9% through the forecast period. The country is currently holding a market valuation of USD 1.4 billion in 2025. FMI estimates valuation to surpass USD 5.8 billion by the end of 2035. Historical CAGR (2020 to 2025): 4.1% |
| Japan | Japan is projected to advance at a moderate pace, registering a CAGR of 1.8% through the forecast period. The country is currently holding a market valuation of USD 775.2 million in 2025. FMI estimates valuation to surpass USD 4.7 billion by the end of 2035. Historical CAGR (2020 to 2025): 3% |
| South Korea | The Korean food extruder market is anticipated to advance at a slow-paced CAGR of 0.9% during the forecast period. At present, the market is holding a valuation of USD 225.2 million in 2025. The analysts at FMI have projected a market value of USD 2.7 billion by 2035. Historical CAGR (2020 to 2025): 2.4% |
Emerging Companies Add an Edge to the Food Extruder Market Dynamics
New entrants to the food extruder market are leveraging advances in technology to launch enhanced products and gain a competitive advantage through the introduction of enhanced products. Investing continuously in research and development activities keeps these firms up-to-date with consumer preferences as well as the end-use industry requirements to remain competitive. Efforts are being made to strengthen their foothold in the industry. This will enable them to increase their visibility within the forum as well as help enhance the further development of the food extruder.
Key players operating the global food extruders market include
Key Developments for Food Extruder Market
| Attribute | Details |
|---|---|
| Forecast Period | 2025 to 2035 |
| Historical Data Available for | 2020 to 2025 |
| Market Analysis | billion for Value and MT for Volume |
| Key Regions Covered | North America; Latin America; Europe; East Asia; South Asia; Oceania; and the Middle East & Africa |
| Key Countries Covered | The USA, Canada, Brazil, Mexico, Chile, Peru, Germany, United Kingdom, Spain, Italy, France, Russia, Poland, China, India, Japan, Australia, New Zealand, GCC Countries, North Africa, South Africa, and Turkey |
| Key Segments Covered | Type, End Use, Sales Channel, Region |
| Key Companies Profiled | Buhler; Baker Perkins; Coperion; Lindquist Machine; Pavan SPA; The Bonnot Company; American Extrusion International; Shandong Light M&E Co., Ltd; Snactek; Doering systems, Inc.; PacMoore; Egan Food Technologies; Schaaf Technologie GmbH; Wenger Manufacturing, Inc.; Brabender GmbH & Co. KG; Jinan Darin Machinery Co., Ltd. |
| Report Coverage | Market Forecast, Company Share Analysis, Competition Intelligence, DROT Analysis, Market Dynamics and Challenges, and Strategic Growth Initiatives |
| Customization & Pricing | Available upon Request |
The global food extruder market is estimated to be valued at USD 64.3 billion in 2025.
It is projected to reach USD 94.3 billion by 2035.
The market is expected to grow at a 3.9% CAGR between 2025 and 2035.
The key product types are twin screw extruders, single screw extruders and contra twin screw extruders.
food processing segment is expected to dominate with a 54.0% industry share in 2025.


Full Research Suite comprises of:
Market outlook & trends analysis
Interviews & case studies
Strategic recommendations
Vendor profiles & capabilities analysis
5-year forecasts
8 regions and 60+ country-level data splits
Market segment data splits
12 months of continuous data updates
DELIVERED AS:
PDF EXCEL ONLINE
Food & Beverage OEE Software Market Size and Share Forecast Outlook 2025 to 2035
Food Grade Crosslinked Polyvinylpolypyrrolidone (PVPP) Market Size and Share Forecast Outlook 2025 to 2035
Food Grade Cassia Gum Powder Market Size and Share Forecast Outlook 2025 to 2035
Food Grade Dry Film Lubricant Market Size and Share Forecast Outlook 2025 to 2035
Foodservice Equipment Market Analysis - Size, Share, and Forecast Outlook 2025 to 2035
Food Basket Market Forecast and Outlook 2025 to 2035
Food Grade Tremella Polysaccharide Market Size and Share Forecast Outlook 2025 to 2035
Food Sorting Machine Market Size and Share Forecast Outlook 2025 to 2035
Foodservice Paper Bag Market Size and Share Forecast Outlook 2025 to 2035
Food Stabilizers Market Size and Share Forecast Outlook 2025 to 2035
Food Packaging Film Market Size and Share Forecast Outlook 2025 to 2035
Food Certification Market Size and Share Forecast Outlook 2025 to 2035
Food Tray Market Size and Share Forecast Outlook 2025 to 2035
Food & Beverage Industrial Disinfection and Cleaning Market Size and Share Forecast Outlook 2025 to 2035
Food Technology Market Size and Share Forecast Outlook 2025 to 2035
Food Tourism Sector Market Size and Share Forecast Outlook 2025 to 2035
Food Processing Boiler Market Size and Share Forecast Outlook 2025 to 2035
Food Packaging Machines Market Size and Share Forecast Outlook 2025 to 2035
Food Minerals Market Size and Share Forecast Outlook 2025 to 2035
Food And Beverage Chemicals Market Size and Share Forecast Outlook 2025 to 2035

Thank you!
You will receive an email from our Business Development Manager. Please be sure to check your SPAM/JUNK folder too.
Chat With
MaRIA