The global foley catheters market is valued at USD 2,043.0 million in 2025, registering Y-o-Y growth of 7.8% over 2024. 2-Way Foley Catheters dominates the product segments and sales are projected to increase at a healthy CAGR of 7.6% attaining market value of USD 4,125.5 million by 2035
Foley catheters plays an integral role of urological care and critical patient post-surgical recovery with urine retention or incontinence. Being a rising trend in surgical procedures, elderly population along with patient with chronic diseases like urological disorders, diabetes, cancers and neurological disorder, the demand has increased highly.
Due to its high usage, Foley catheters are used widely within hospitals and long-term care settings for intensive care unit patients, surgical recovery, and elderly care.
Innovation in catheter material with designs that are patient friendly and adoption of technologies that prevents infection control will become the primary parameters in the coming years.
Foley catheter vendors are constantly working towards embracing antimicrobial coating technologies with the primary aim in reduction of catheter associated urinary tract infections. This is the most common complication of long-term catheterized patients.
The shift in the industry will significant change the market landscape where usage of biocompatible silicone catheters will provide longer indwelling times and fewer allergic reactions than the latex alternatives. Innovations such as sensor-enabled smart catheters are going to promote real-time output monitoring, early detection of infections and automated management of drainage to improve patient care with lesser hospitalization risk.
As the number of minimally invasive procedures increases and with home-based healthcare gaining momentum, the need for self-catheterization-friendly, pre-sterilized disposable catheters is expected to rise, setting a strong platform for growth in the market
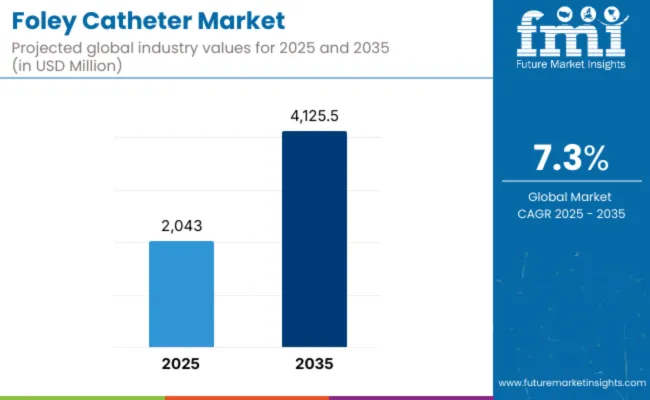
| Metric | Value |
|---|---|
| Industry Size, 2025 | USD 2,043.0 million |
| Industry Value, 2035 | USD 4,125.5 million |
| CAGR (2025 to 2035) | 7.3% |
Technological innovation, sustainability initiatives, increased regional demand and disease prevalence are expected to propel the Foley catheter market to new heights in the coming decade.
Companies are working towards improving biocompatibility so that it reduces the infections rates and ensure comfort for the patient. As hospitals and clinical settings move toward reducing catheter associated infection, antimicrobial-coated and silver-alloy Foley catheters will take center stage towards adoption.
The emphasis towards sustainability will encourage manufacturers to provide foley catheters that are environmental-friendly and latex-free. The continued movement to single-use, pre-sterilized catheters will reduce cross-contamination risks while maintaining efforts to support global infection control movements.
Regionally, North America and Europe will remain leaders in the market due to significant number of surgical procedures that are being carried out in healthcare facilities, high patient footfall seeking in-patient admissions. However, the Asia-Pacific and Latin America regions will be expected to grow the fastest, as health care investments continue to rise, awareness of urological care increases and disease prevalence continues to grow.
Chronic conditions, such as urinary incontinence, benign prostatic hyperplasia, diabetes, and kidney disorders, will continue to drive Foley catheter adoption across the globe.
Increased emphasis on usage in home healthcare settings, rising minimally invasive procedures, and improved patient-centric designs. It is expected that the intertwining of technology development, regulatory support, and patient need evolution will steer the market toward leading growth and enhanced patient results for the next ten years.
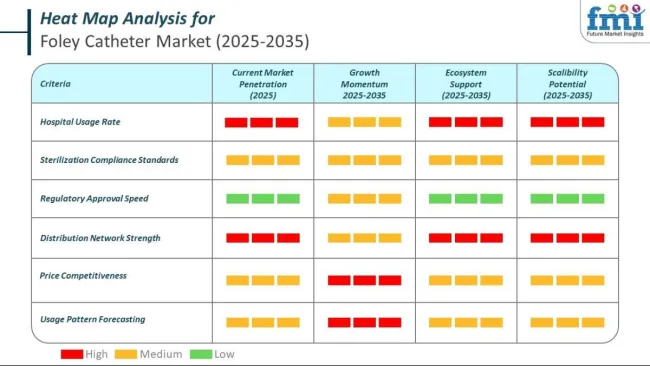
The global foley catheter market operates within tightly regulated environments, where national authorities define classification, performance standards, and licensing pathways to ensure patient safety and product quality. Regulatory compliance is critical for manufacturers entering or expanding within markets such as the United States, India, China, and Japan. Each country enforces device-specific protocols related to classification, testing, registration, and ongoing surveillance, particularly for moderate- to high-risk devices like Foley catheters.
The section contains information about the leading segments in the industry. Based on product type, 2-way foley catheter are expected to account 54.7% of the global share in 2025.
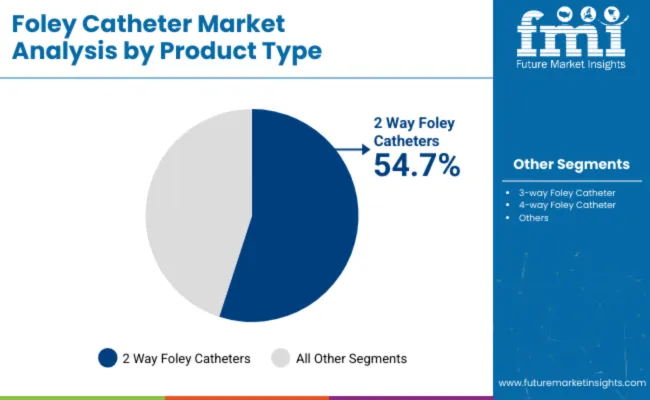
| Product Type | Value Share (2025) |
|---|---|
| 2 Way Foley Catheters | 54.7% |
The consumption pattern of 2-way foley catheters dominates the market due to their versatility and suitability for a wide range of medical applications. Two separate channels are designed for draining urine and inflating the retention balloon. With proper utilization, they might be preferred tools for doing routine urinary catheterization either within healthcare or even homecare setting.
Their relative ease of simplicity during utilization makes the procedure most chosen by patients that entail situations of urinary retention or post-bleeding disorders including bladder impairment conditions.
The two-way Foley catheters are made of different materials such as latex and silicone and thus catering to a varied patients base and reducing the risk of allergy. Besides this, since they are cheaper as compared to the more complex catheter types, there would be widespread utilization, especially in developing markets.
This combination of functionality, cost-effectiveness, and ease of availability solidifies 2-way Foley catheters as the market leader, appealing to both healthcare providers and patients globally.
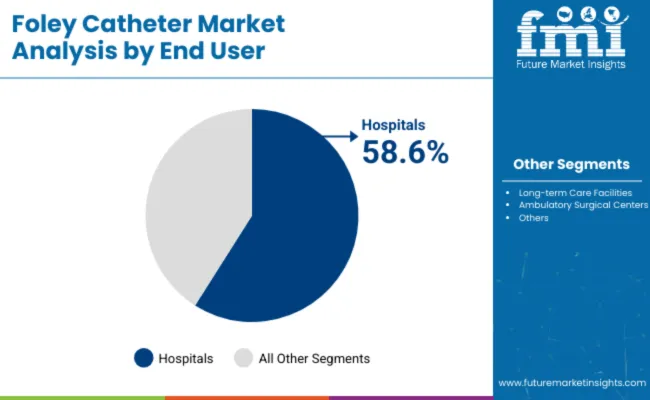
| By End User | Value Share (2025) |
|---|---|
| Hospitals | 58.6% |
The leading market share of the foley catheter market is attributed to hospitals, primarily because of the large number of surgical procedures and the requirement for proper urinary management in critical care settings. Surgical departments require Foley catheters for post-operative patients, especially in urological, gynecological, and orthopedic surgeries, where temporary urinary drainage is required.
In addition, intensive care units and emergency departments often employ Foley catheters in managing immobile or critically ill patients who are unable to urinate independently. In addition, long-term catheterization cases involving severe bladder dysfunction or chronic urinary incontinence are also offered in hospitals.
Wide ranges of catheters are available, from those with antimicrobial coating to temperature-sensing models which would ensure patient safety and infection control in a hospital. On top of that, these make hospitals the leading end-users, because they have all the purchasing might and access to more advanced medical technologies.
A comparative analysis of fluctuations in compound annual growth rate (CAGR) for the foley catheter industry outlook between 2024 and 2025 on a six-month basis is shown below.
By this examination, major variations in the performance of these markets are brought to light, and trends of revenue generation are captured hence offering stakeholders useful ideas on how to carry on with the market’s growth path in any other given year. January through June covers the first part of the year called half1 (H1), while half2 (H2) represents July to December.
The table below compares the compound annual growth rate (CAGR) for the global foley catheter market from 2024 to 2025 during the first half of the year. This overview highlights key changes and trends in revenue growth, offering valuable insights into market dynamics. H1 covers January to June, while H2 spans July to December.
Analysts predict the business will surge at a 7.5% CAGR in the first half (H1) of the decade from 2024 to 2034, followed by a slightly lower growth rate of 7.9% in the second half (H2) of the same period.
| Particular | Value CAGR |
|---|---|
| H1 | 7.5% (2024 to 2034) |
| H2 | 7.9% (2024 to 2034) |
| H1 | 7.3% (2025 to 2035) |
| H2 | 8.0% (2025 to 2035) |
Moving into the following period, from H1 2025 to H2 2035, the CAGR is projected to decline slightly to 7.3% in the first half and projected to lower at 8.0% in the second half. In the first half (H1) the market will also witness a decrease of 20 BPS while in the second half (H2), the market is projected to witness an increase of 13.4 BPS.
Adoption of Anti-Infective and Antimicrobial Foley Catheters increasing Demand
There is a substantial demand rising from hospitals, long term care facilities using anti-infective and antimicrobial Foley catheters extensively to combat catheter-associated urinary tract infections (CAUTIs). Manufacturers are focusing on producing Foley catheters that have prepared with silver-alloy, antibiotic agents and hydrophilic polymers coating to evade any kind of bacterial colonization and biofilm formation. Many clinical studies have been carried out and demonstrated that infection rates are extremely reduced by silver-coating and antimicrobial catheters and are thus widely used in ICU settings, post-surgical care settings and long-term catheterized patients.
Healthcare facilities are now using infection-resistant catheters to meet stringent regulatory requirements and HAI reduction programs. Most healthcare facilities have adopted hydrogel-coated catheters which separate the catheter from the urethral lining, reducing enormous friction and preventing infections. In light of increasing antibiotic resistance, medical institutions have opted for silver-ion catheters and nitrofurazone-coated catheters that prevent bacterial adhesion without encouraging drug resistance. Thus, the market for antimicrobial Foley catheters has will open up with innovation, biocompatibility and long-lasting catheter solutions among the healthcare providers.
Preference for Silicone-Based Foley Catheters Over Latex Boosting the Growth in the Market
Prolonged catheters usage creates allergic reactions among immobile patients. Healthcare providers have increasingly preferring silicone-based Foley catheters over latex alternatives due to its biocompatibility, longer indwelling times and reduced allergic reactions. Silicone catheters do not contain latex-proteins, which trigger hypersensitivity in critical patients, making them a safer alternative for individuals with latex allergies.
Unlike latex, silicone catheters does not absorb any fluids and thus prevents from catheter swelling, lumen obstruction and material degradation over time. Medical professionals favor 100% silicone catheters for long-term usage due to their higher durability and stability in critical care settings, ensuring consistent urine drainage. Silicone’s non-porous surface reduces encrustation and mineral buildup particularly in patients prone to urinary tract infections (UTIs) or bladder stones.
In many countries, regulatory bodies have also been advocated towards the use of DEHP-free and BPA-free catheters which is further boosting the shift from latex to silicone Foley catheters. Patients requiring long-term catheterization such as those with spinal cord injuries, multiple sclerosis or any bladder disorders now benefit from soft and flexible silicone catheters. Manufacturers continue to innovative silicone catheter designs incorporating hydrophilic coatings and temperature-sensing capabilities to enhance comfort and real-time patient monitoring.
Smart Foley Catheters with Sensors Will Revolutionizing Urinary Care
Advancements in technology in the designs of catheters and smart monitoring systems are propelling the Foley catheter market at a relatively fast pace. Increasing usage of sensor-enabled and antimicrobial-coated Foley catheters present a huge opportunity for manufacturers to develop innovative solutions with a view of enhancing patient safety, infection control as well as real-time monitoring.
Among the many promising developments the industry is offering, integration of smart sensors in Foley catheters is the most notable. These sensors of biometrics track urine output, bladder pressure, temperature changes, and early infection signals so healthcare professionals recognize catheter occlusion and complications before the symptoms become worse.
This technology is very useful for patients who spend time in an ICU, are recovered from surgery, and long-term catheterized reducing HAI and sepsis complications.
Manufacturers are also coming up with drug-eluting and antimicrobial-infused Foley catheters, which releases controlled amounts of antibiotics, silver nanoparticles, and other antimicrobial agents, thereby preventing the adhesion of bacteria. Catheter material also ensures biocompatibility; it reduces friction and minimizes urethral trauma to improve patient outcome.
This would make the market for technologically advanced Foley catheters open up significantly to new opportunities in innovation and commercialization, due to increased focus on infection prevention, patient comfort, and integration of digital healthcare.
Increasing Product Recalls Causing Reputational Damage to the Foley Catheter Market
Recalls of products may cost the Foley catheters market fortune.
Increasing frequency of product recalls may erode the consumer trust in that particular brand and generate negative publicity and financial burdens causing diminishment of the market share for the company. For example, in February 2024 Medline Industries, LP is an American private healthcare company, announced a recall for certain foal catheters kits and trays due to the possible contamination.
An increasing frequency of product recalls may not only harm that particular brand but also warns consumers against the entire industry, raising suspicion and eroding trust in such devices.
Thus, increasing product recalls can act as a restraint on the growth of the Foley catheters market.
The global foley catheter industry recorded a CAGR of 7.0% during the historical period between 2020 and 2024. The growth of the foley catheter diagnostics industry was positive as it reached a value of USD 1,894.7 million in 2024 from USD 1,446.9 million in 2020.
While historically, Foley catheters were predominantly used for treating urinary retention and other urological issues, they had been designed with more concern paid to functionality than patient comfort. Early designs often caused considerable discomfort and complications such as infections and urethral tears due to their bulk and rigid materials.
The absence of advanced coatings or lubricants made their insertion very difficult, which was fairly dissatisfying to the patients, hence increasing the risk of further complications.
Manufacturers began incorporating features that could mitigate some of these limitations. Some of the innovations included pre-lubricated surfaces, hydrophilic coatings, and advanced balloon mechanisms for reduction of friction and increased comfort to the patient.
This period opened the door for more product designs directed at patient-centric objectives to minimize discomfort and complications such as infection and bladder spasm.
As it stands, the present and future of Foley catheter shows alignment with changes in digital health and minimally invasive technologies. With smart catheters equipped with inbuilt sensors, it becomes a path-breaking trend. The devices monitor real-time parameters like urine output, pressure, and temperature to enable timely medical decisions and treatment actions.
Automated features, such as controlled inflation and deflation mechanisms, help to enhance precision and ease of use. Connected medical devices also bring forth the use of these newer standards.
In this, the design of a catheter continues to change towards more minimally invasive designs made from less thick and softer materials aimed at easier insertion and lesser friction during insertion. Such evolution bears one main result: Increased comfort to the patient accompanied by decreased risks of infections and injuries.
The progress the Foley catheter market has made fits within the broader trend of the health industry toward digitalization and minimally invasive treatments, promising ample precision, patient comfort, and outcome improvements.
Tier 1 companies accounts for a 75.9% revenue share and dominates the Foley catheter market. Key Industry leaders includes BD, Cardinal Health, Teleflex Inc., and B. Braun Melsungen AG are the front runners.
These global giants boast extensive portfolios of Foley catheters, ranging from traditional models to advanced designs featuring smart technologies and innovative coatings. With substantial manufacturing capability, solid regulatory relationships, and well-structured worldwide distribution networks, such firms are the yardsticks for innovation and quality.
Tier 2 players, including Coloplast, Medline Industries, LP., Well Lead Medical Co. Ltd., and ConvaTec Group Plc, account for 12.6% of the market. These companies have a significant distribution network in specific regional markets with diverse sales channels.
They predominantly emphasize on cost-effective and patient-friendly solutions, leveraging their agility to quickly respond to shifts in demand. Tier 2 firms frequently invest in enhancing minimally invasive designs, positioning themselves as reliable alternatives to Tier 1 players.
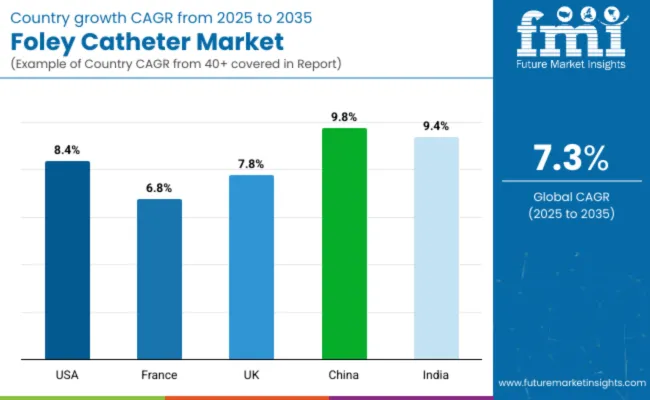
| Country | Value CAGR (2025 to 2035) |
|---|---|
| United States | 8.4% |
| France | 6.8% |
| UK | 7.8% |
| China | 9.8% |
| India | 9.4% |
The section below covers the foley catheter industry analysis for the sales for different countries. Market demand analysis on key countries in several regions of the globe, includes North America, Latin America, East Asia, South Asia & Pacific, Western Europe, Eastern Europe and Middle East & Africa.
The United States is anticipated to remain at the forefront with maximum share in North America, with a CAGR of 8.4% through 2035. In South Asia & Pacific, India is projected to witness the highest CAGR in the market of 9.4% by 2035.
The United States dominates the global market with high share in 2024. The United States is expected to exhibit a CAGR of 8.4% throughout the forecast period (2025 to 2035).
The USA has earned a good name for exporting medical items through their catheters offering to clients. Apart from that, good economics in Germany allows it to maintain a strong influence in terms of manufacturing. German companies specialize in making quality, high-performance Foley catheters that satisfy international requirements.
The advances to make such catheters are focused on providing for anti-infection tactics, mainly silver-coated and hydrophilic catheters, which keep patients safe but also deliver on efficiency. Germany's hub for European manufacturing offers seamless distribution for its neighboring countries and even further away and ensures a presence in the market.
German enterprises use novel manufacturing methods to produce remarkably durable catheters focused on user comfort, minimizing urethral injuries in long-term use. Germany observes all EU guidelines on medical devices, which guarantees product reliability and adherence to safety standards. This has enabled Germany to dominate the market as they are in tandem with the healthcare export infrastructure, creating sufficient room for escalated demand.
In 2024, France foley catheter market held a dominant revenue in the Western Europe market and is expected to grow with a CAGR of 6.8%.
The Foley catheter market is dominated by the France because of the high prevalence of chronic urological conditions like benign prostatic hyperplasia (BPH), urinary incontinence as well as bladder dysfunction therein. Aging population is very crucial, because older persons frequently need catheterization for managing their problems over the long term.
A large number of surgical patients in the France see urology, gynecology, and oncology require Foley catheters for handling urinary incontinence effectively. The increasing patient awareness about the comforts of the products, for example, BPH and urinary incontinence, and long-term catheterization to help enhance such catheters with pre-lubricated and anti-infective features continues to drive the significance of advanced designs.
Other factors such as the supportive reimbursements further support this objection to a larger degree, as they encourage the spread of Foley catheters for presidents and seniors in the market, ensuring there is continuous demand and growth in development.
India foley catheter market occupies a leading value share in South Asia & Pacific market in 2024 and is expected to grow with a CAGR of 9.4% during the forecasted period.
India is playing key importance in the global Foley catheter market owing to its growing medical tourism industry and the availability of cheap operations. The country attracts international patients looking for affordable procedures related to urology, most of which require catheterization.
Local manufacturers provide Foley catheters of high quality at cheaper prices that can serve both local and global markets. There is an ever-increasing burden of urological conditions such as urinary retention and urinary tract infections, so the demand for the devices is fueled in the vast rural and urban populations of India. Innovations such as silicone-based catheters and pre-lubricated designs cater to a diverse patient base, including those in need of long-term use.
Initiatives of the government, such as "Make in India", encouraged local manufacturers to scale up their capacity for higher availability of affordable Foley catheters. The rise of private hospitals and growing insurance coverage within India help ensure a steady local demand and would assist the country in being a global supplier.
The Foley catheter market is marked by the presence of established medical device manufacturers and emerging companies focused on delivering innovative solutions.
Key players like BD, Teleflex Inc., Cardinal Health Inc., and B. Braun Melsungen AG dominate the market with extensive product portfolios, ranging from standard catheters to advanced models with features such as anti-infection coatings and real-time monitoring capabilities.
Recent Industry Developments in Foley Catheter Market
| Report Attributes | Details |
|---|---|
| Market Size (2024) | USD 1,895.8 million (estimated based on 7.8% YoY growth) |
| Current Total Market Size (2025) | USD 2,043.0 million |
| Projected Market Size (2035) | USD 4,125.5 million |
| CAGR (2025 to 2035) | 7.6% |
| Base Year for Estimation | 2024 |
| Historical Period | 2020 to 2024 |
| Projections Period | 2025 to 2035 |
| Quantitative Units | USD million for value and thousand units for volume |
| Product Types Analyzed (Segment 1) | 2-Way Foley Catheter, 3-Way Foley Catheter, 4-Way Foley Catheter |
| Materials Analyzed (Segment 2) | Latex Foley Catheter, Silicone Foley Catheter, Other Materials |
| Indications Analyzed (Segment 3) | Urinary Incontinence, Urethral Stricture, Chronic Obstruction, Neurogenic Bladder, Enlarged Prostate Gland/BPH, Prostate Cancer, Other Indications |
| End Users Analyzed (Segment 4) | Hospitals, Long-term Care Facilities, Ambulatory Surgical Centers |
| Regions Covered | North America; Latin America; Western Europe; Eastern Europe; South Asia and Pacific; East Asia; Middle East & Africa |
| Countries Covered | United States, Canada, Mexico, Brazil, Argentina, Germany, France, United Kingdom, Italy, Spain, Netherlands, China, India, Japan, South Korea, ANZ, GCC Countries, South Africa |
| Key Players influencing the Foley Catheter Market | Becton, Dickinson & Company, Cardinal Health, B. Braun SE, Coloplast, Medtronic, ConvaTec Group Plc, Teleflex Inc., Medline Industries, LP, Optimum Medical Limited, Polymedicure, AdvaCare Pharma, Well Lead Medical Co., Ltd., Advin Health Care |
| Additional Attributes | Dollar sales by product type (2-way, 3-way, 4-way), Shift in catheter material preference (latex vs silicone), Indication-based trends in urology and surgical care, High-volume adoption in hospital and long-term care settings, Global rise in catheter-associated urinary complications driving innovation |
| Customization and Pricing | Customization and Pricing Available on Request |
In terms of product type, the industry is divided into 2-way foley catheter, 3-way foley catheter, and 4-way foley catheter.
In terms of material, the industry is divided into latex foley catheter, silicone foley catheter and other materials
In terms of application, the industry is divided into urinary incontinence, urethral stricture, chronic obstruction, neurogenic bladder, enlarged prostate gland/BPH, prostate cancer and other indications
In terms of end user, the industry is segregated into hospitals, long-term care facilities, and ambulatory surgical centers.
Key countries of North America, Latin America, East Asia, South Asia & Pacific, Western Europe, Eastern Europe, and Middle East and Africa (MEA) have been covered in the report.
The global foley catheter industry is projected to witness CAGR of 7.3% between 2025 and 2035.
The global foley catheter industry stood at USD 1,894.7 million in 2024.
The global foley catheter industry is anticipated to reach USD 4,125.5 million by 2035 end.
China is expected to show a CAGR of 13.1% in the assessment period.
The key players operating in the global foley catheter industry include Becton, Dickinson & Company, Cardinal Health, B. Braun SE, Coloplast, Medtronics, ConvaTec Group Plc, Teleflex Inc., Medline Industries, LP., Optimum Medical Limited, Polymedicure, AdvaCare Pharma, Well Lead Medical Co.,Ltd., and Advin Health Care


Full Research Suite comprises of:
Market outlook & trends analysis
Interviews & case studies
Strategic recommendations
Vendor profiles & capabilities analysis
5-year forecasts
8 regions and 60+ country-level data splits
Market segment data splits
12 months of continuous data updates
DELIVERED AS:
PDF EXCEL ONLINE
UK Foley Catheter Market Insights – Size, Trends & Growth 2025-2035
India Foley Catheter Market Report – Trends, Demand & Forecast 2025-2035
China Foley Catheter Market Insights – Demand, Trends & Forecast 2025-2035
France Foley Catheter Market Trends – Demand, Growth & Forecast 2025-2035
Temperature Sensing Foley Catheter Market
Catheter Market Insights by Product, Indication, End-user, and Region 2025 to 2035
Catheter-Directed Thrombolysis Market Growth - Trends & Forecast 2025 to 2035
Catheter Tip Syringe Market Size, Share & Demand Outlook 2025 to 2035
Catheter Associated Urinary Tract Infections (UTI) Treatment Market - Demand & Forecast 2025 to 2035
Catheter Systems Market
Transcatheter Heart Valve Replacement Market Analysis - Trends & Forecast 2025 to 2035
Transcatheter Mitral Valve Market Overview – Size, Share & Forecast 2024-2034
Global Microcatheter Market Analysis – Trends, Size & Forecast 2024-2034
Transcatheter Bioprosthesis Market
Stroke Catheters Market Analysis - Size, Share, and Forecast Outlook 2025 to 2035
Airway Catheters Market Analysis - Growth & Industry Insights 2025 to 2035
Rectal Catheters Market
Robotic Catheterization Systems Market Growth – Innovations, Trends & Forecast 2025-2035
Balloon Catheters Analysis by Product Type by Indication and by End User through 2035
Drainage Catheter Market

Thank you!
You will receive an email from our Business Development Manager. Please be sure to check your SPAM/JUNK folder too.
Chat With
MaRIA