Flocking Tape Market Size and Share Forecast Outlook 2025 to 2035

The flocking tape market is projected to grow from USD 3.3 billion in 2025 to USD 5.1 billion by 2035, registering a CAGR of 4.5% during the forecast period. Sales in 2024 reached USD 2.6 billion, reflecting steady growth driven by increasing demand for high-performance, sustainable, and multifunctional adhesive solutions.
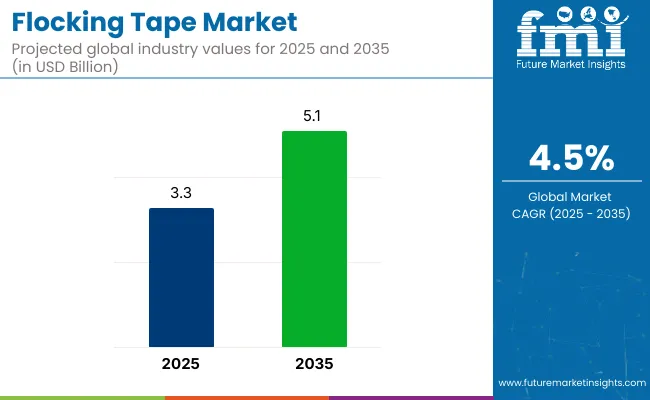
Quick Stats of Flocking Tape Market

  • Market Value (2025): USD 3.3 billion
  • Forecast Value (2035): USD 5.1 billion
  • Forecast CAGR: 4.5%
  • Material Leader in 2025: Polyester Flocking Tape (38.6% market share)
  • Top End-use: Automotive Manufacturing (42.1% share)
  • Key Growth Region: North America (USA is the fastest-growing market with 4.8% CAGR)

Flocking Tape Market

Metric Value
Market Size in 2025 USD 3.3 Billion
Projected Market Size in 2035 USD 5.1 Billion
CAGR (2025 to 2035) 4.5%

This growth is attributed to the rising adoption of electric vehicles (EVs), lightweight automobile components, and advancements in Nano coatings technology to increase durability. The market's expansion is further supported by innovations in flocking tape designs and materials, enhancing their functionality and appeal to various industries.

In January 2025, FrogTape® introduced the latest innovation in its portfolio - FrogTape Advanced™, the most elite painter’s tape on the market. “In 2010, FrogTape® forever changed how we paint. Consumers and professionals alike could forget about the common challenge of paint bleed and instead experience super sharp paint lines every time, thanks to the tape’s PaintBlock® Technology.

This feature seals the tape edges, blocking paint bleed to deliver clean lines and a beautiful result,” says Mary Kate Hearns, Senior Product Manager for FrogTape®. “Now, we’re introducing the most technologically advanced tape we’ve ever made. FrogTape Advanced™ takes PaintBlock® Technology and combines it with new innovations to provide an even more premium product, giving DIYers and pros alike the confidence to take on any project.”

Growing environmental awareness is reshaping the flocking tape market, prompting producers to develop tapes that are biodegradable, non-toxic, and recyclable. Recent advancements feature the use of nano-coating technologies for enhanced durability, the introduction of smart adhesives that respond to temperature changes, and the adoption of more eco-friendly flocking fibers.

These advancements align with global sustainability goals and regulatory requirements, making flocking tapes an attractive option for environmentally conscious consumers. Additionally, the adoption of computerized equipment in industrial production lines is expected to improve efficiency and cost savings.

The flocking tape market will witness growth over the next decade, driven by increasing demand in automotive, aerospace, construction, and consumer goods industries for high-performance and sustainable adhesive solutions. Companies investing in innovative, eco-friendly technologies are expected to gain a competitive edge.

The market's expansion is further supported by the growing emphasis on noise reduction, surface protection, and aesthetic enhancement in various applications. With continuous advancements in materials and manufacturing processes, the flocking tape market is set to offer lucrative opportunities for stakeholders over the forecast period.

Analyzing Flocking Tape Market by Top Investment Segment

The market has been segmented based on type, material, end-use industry, and region. Types such as single-sided flocking tape, double-sided flocking tape, self-adhesive flocking tape, and non-adhesive flocking tape (used with external adhesives) have been incorporated to support bonding precision, application flexibility, and noise reduction.

Materials including polyester, nylon, rayon, cotton, and eco-friendly or biodegradable alternatives have been selected to offer texture, durability, and environmental compatibility. End-use industries such as automotive manufacturing, electronics manufacturing, textile & fashion, packaging, furniture manufacturing, and DIY & craft sectors have been included where flocking tapes are utilized for insulation, decorative, and functional performance.

Regional segmentation has been structured across North America, Latin America, East Asia, South Asia & Pacific, Eastern Europe, Western Europe, Oceania, and the Middle East & Africa to reflect demand trends, industrial base, and regulatory shifts.
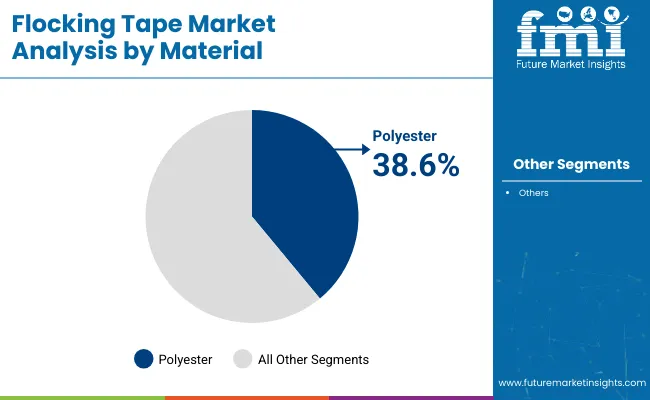
Polyester Flocking Tape Preferred for Its Abrasion Resistance and Noise Dampening

Flocking Tape Market Analysis By Material

Polyester flocking tape is expected to hold the largest share of 38.6% in the flocking tape market in 2025, as its application has been driven by high durability, surface conformity, and anti-squeak performance. These tapes have been extensively applied in sealing systems, sliding components, and interior trim sections.

Consistent adhesion and flock retention have been ensured through controlled electrostatic coating processes. Resistance to abrasion, stretching, and edge fray has supported use in both visible and concealed vehicle parts.

Production flexibility has enabled polyester tapes to be tailored to a range of widths, thicknesses, and fiber densities. Compatibility with automated lamination and die-cutting equipment has improved throughput in high-volume production environments. Dimensional stability and elongation control have been achieved for accurate fit in curved or grooved assemblies. Market share has been maintained due to proven mechanical performance across industrial and transport applications.
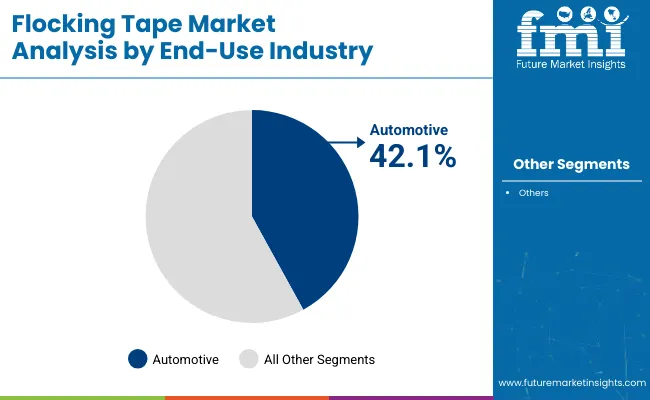
Automotive Segment Leads Due to High Noise Control and Fitment Demands

Flocking Tape Market Analysis By End Use Industry

The automotive segment is projected to account for 42.1% of the flocking tape market in 2025, as its dominance has been driven by requirements for NVH (noise, vibration, and harshness) reduction and precise part alignment.

Flocking tapes have been integrated into door panels, window channels, and dashboard assemblies to reduce frictional noise and provide smooth tactile surfaces. Resistance to wear and sliding fatigue has been prioritized in areas subjected to repeated motion. Seamless fitment and thermal stability have supported use in both ICE and electric vehicle platforms.

OEM specifications and interior styling standards have guided product configurations and installation techniques. Flocking tapes have been paired with plastic, metal, and composite substrates for diverse trim assemblies. Increased vehicle customization and part modularity have reinforced the need for adjustable and high-tolerance tape formats. Continued vehicle production and global platform expansions have preserved the segment’s leading role.

Challenges and Opportunities

Challenges

High Production Costs and Limited Awareness in Emerging Markets

The flocking tape market is the high manufacturing cost, particularly for high-durability as well as for weather-resistant applications. Unlike standard adhesive tapes, the scenery of electrostatic flocking is more complex and costly, making NTN less competitive. Moreover, the market growth is also hindered due to developing regions not being aware of and adopting this market. Specifically in automotive, construction and industrial.

Opportunities

Growth in Automotive, Electronics, and Noise-Reduction Applications

Car interior applications, electronic insulation, and soundproofing are driving increasing demand for flocking tapes, driven by greater emphasis on noise reduction, toughness, and aesthetics. Innovations in sustainable adhesives, self-repairing flocking products, and conductive flock tapes for electronic shielding are expanding market possibilities.

Additionally, increase in adoption of electric vehicles (EVs) and lightweight automobile components are driving the demand for flocking tapes for wire harness protection and anti-squeak applications.

Country-wise Outlook

United States

The USA flocking tape market is growing steadily with increasing demand from automotive, electronics, and constructions industries. The adoption of flocking tape in vehicles for noise reduction, surface protection, and aesthetic enhancement is driving the market growth.

Moreover, the growth in demand for high-performance adhesive products across the textile and packaging sectors is expected to drive the market growth. Innovative green and heat defiant flocking tappings are also shaping the market, as they comply with acute environmental guidelines.

Country CAGR (2025 to 2035)
USA 4.8%

United Kingdom

The UK flocking tape market is expanding due to increased use in the automotive and aerospace segments where noise and vibrations reductions are the key drivers for the segment. Increasing application of flocking tape in decorative and protection application in furniture and textile industries are other factors expected to drive the market growth.

In addition, adhesive flocking tapes development is being influenced by the demand for low-emission and sustainable adhesives to comply with UK environmental laws.

Country CAGR (2025 to 2035)
UK 4.3%

European Union

Flocking tape market in Europe will be driven by stringent regulations on noise reduction and energy efficiency of appliances and vehicles. Rising adoption of flocking tape in automotive dashboards, window channels, and door seals is anticipated to drive the market.

Germany, France and Italy as major markets, with strong demand from the automotive, textile and packaging industries. The flocking tape market is being impacted by increasing focus on sustainable & biodegradable adhesive solutions due to environmental regulations in the E.U.

Region CAGR (2025 to 2035)
EU 4.2%

Japan

Japan's flocking tape market is growing due to its high demand in precision engineering, automotive and consumer electronics sectors. Flocking Tape market is anticipated to witness market growth, owing to the dynamic technological advancement in advanced materials and high-performance adhesive solutions, in the country of Japan.

Use of flocking tape for noise absorbing applications in vehicles and household appliances is gradually growing. In addition, favorable manufacturing practices in Japan and regulations that promote low-VOC containing adhesives will boost the market growth.

Country CAGR (2025 to 2035)
Japan 4.5%

South Korea

The South Korea flocking tape market is prospering on account of its flourishing automotive and electronics sectors. Increasing applications of flocking tape in soundproofing, scratch-resistant coatings, and decorative applications in the interiors of automotive such as carpets and mats as well as neats and cushions are driving the demand.

In addition, the packaging and consumer goods industries in South Korea’s growth is fueling demand for high quality adhesive solutions. Market growth is also being driven by the development of lightweight and heat resistant flocking tape.

Country CAGR (2025 to 2035)
South Korea 4.4%

Competitive Outlook

The flocking tape market is witnessing growth due to the increasing requirement for noise reduction, surface protection, and aesthetic appearance in sectors such as automotive, electronics, construction, and packaging.

Soft, velvet-like surfaces and high abrasion resistance make flocking tapes suitable for extensive use in sealing, anti-squeak applications, and decorative finishes. Growth of the market is supported by innovations in adhesive technology, rising usage of lightweight materials in automobile production, and rising consumer goods applications.

Key Players

  • ORAFOL Europe GmbH (Automotive and industrial-grade flock tapes with customized adhesive properties)
  • Berry Global Group, Inc. (Protective and decorative flocking tapes for packaging and consumer applications)
  • Scapa Group Ltd. (Sound-dampening flock tapes designed for high-performance automotive and aerospace industries)
  • Teraoka Seisakusho Co., Ltd. (Heat-resistant and flexible flocking tapes for industrial sealing applications)
  • Nitto Denko Corporation (Advanced adhesive flocking tapes for electronics, construction, and automotive industries)

Key Segments

By Type:

  • Single-Sided Flocking Tape
  • Double-Sided Flocking Tape
  • Self-Adhesive Flocking Tape
  • Non-Adhesive (used with external adhesives)

By Material:

  • Polyester Flocking Tape
  • Nylon Flocking Tape
  • Rayon Flocking Tape
  • Cotton Flocking Tape
  • Eco-friendly/Biodegradable Materials

By End-Use Industry:

  • Automotive Manufacturing
  • Electronics Manufacturing
  • Textile & Fashion Industry
  • Packaging Industry
  • Furniture Manufacturing
  • DIY & Craft Industries

By Region:

  • North America
  • Latin America
  • Europe
  • East Asia
  • South Asia
  • Oceania
  • MEA

Table of Content

  1. Executive Summary
    • Global Market Outlook
    • Demand-side Trends
    • Supply-side Trends
    • Technology Roadmap Analysis
    • Analysis and Recommendations
  2. Market Overview
    • Market Coverage/Taxonomy
    • Market Definition/Scope/Limitations
  3. Market Background
    • Market Dynamics
      • Drivers
      • Restraints
      • Opportunity
      • Trends
    • Scenario Forecast
      • Demand in Optimistic Scenario
      • Demand in Likely Scenario
      • Demand in Conservative Scenario
    • Opportunity Map Analysis
    • Product Life Cycle Analysis
    • Supply Chain Analysis
      • Supply Side Participants and their Roles
        • Producers
        • Mid-Level Participants (Traders/ Agents/ Brokers)
        • Wholesalers and Distributors
      • Value Added and Value Created at Node in the Supply Chain
      • List of Raw Material Suppliers
      • List of Existing and Potential Buyer’s
    • Investment Feasibility Matrix
    • Value Chain Analysis
      • Profit Margin Analysis
      • Wholesalers and Distributors
      • Retailers
    • PESTLE and Porter’s Analysis
    • Regulatory Landscape
      • By Key Regions
      • By Key Countries
    • Regional Parent Market Outlook
    • Production and Consumption Statistics
    • Import and Export Statistics
  4. Global Market Analysis 2020 to 2024 and Forecast, 2025 to 2035
    • Historical Market Size Value (USD Billion) & Volume (Units) Analysis, 2020 to 2024
    • Current and Future Market Size Value (USD Billion) & Volume (Units) Projections, 2025 to 2035
      • Y-o-Y Growth Trend Analysis
      • Absolute $ Opportunity Analysis
  5. Global Market Pricing Analysis 2020 to 2024 and Forecast 2025 to 2035
  6. Global Market Analysis 2020 to 2024 and Forecast 2025 to 2035, By Type
    • Introduction/Key Findings
    • Historical Market Size Value (USD Billion) & Volume (Units) Analysis By Type, 2020 to 2024
    • Current and Future Market Size Value (USD Billion) & Volume (Units) Analysis and Forecast By Type, 2025 to 2035
      • Single-Sided Flocking Tape
      • Double-Sided Flocking Tape
      • Self-Adhesive Flocking Tape
      • Non-Adhesive (used with external adhesives)
    • Y-o-Y Growth Trend Analysis By Type, 2020 to 2024
    • Absolute $ Opportunity Analysis By Type, 2025 to 2035
  7. Global Market Analysis 2020 to 2024 and Forecast 2025 to 2035, By Material
    • Introduction/Key Findings
    • Historical Market Size Value (USD Billion) & Volume (Units) Analysis By Material, 2020 to 2024
    • Current and Future Market Size Value (USD Billion) & Volume (Units) Analysis and Forecast By Material, 2025 to 2035
      • Polyester Flocking Tape
      • Nylon Flocking Tape
      • Rayon Flocking Tape
      • Cotton Flocking Tape
      • Eco-friendly/Biodegradable Materials
    • Y-o-Y Growth Trend Analysis By Material, 2020 to 2024
    • Absolute $ Opportunity Analysis By Material, 2025 to 2035
  8. Global Market Analysis 2020 to 2024 and Forecast 2025 to 2035, By End-Use Industry
    • Introduction/Key Findings
    • Historical Market Size Value (USD Billion) & Volume (Units) Analysis By End-Use Industry, 2020 to 2024
    • Current and Future Market Size Value (USD Billion) & Volume (Units) Analysis and Forecast By End-Use Industry, 2025 to 2035
      • Automotive Manufacturing
      • Electronics Manufacturing
      • Textile & Fashion Industry
      • Packaging Industry
      • Furniture Manufacturing
      • DIY & Craft Industries
    • Y-o-Y Growth Trend Analysis By End-Use Industry, 2020 to 2024
    • Absolute $ Opportunity Analysis By End-Use Industry, 2025 to 2035
  9. Global Market Analysis 2020 to 2024 and Forecast 2025 to 2035, By Region
    • Introduction
    • Historical Market Size Value (USD Billion) & Volume (Units) Analysis By Region, 2020 to 2024
    • Current Market Size Value (USD Billion) & Volume (Units) Analysis and Forecast By Region, 2025 to 2035
      • North America
      • Latin America
      • Europe
      • East Asia
      • South Asia
      • Oceania
      • MEA
    • Market Attractiveness Analysis By Region
  10. North America Market Analysis 2020 to 2024 and Forecast 2025 to 2035, By Country
    • Historical Market Size Value (USD Billion) & Volume (Units) Trend Analysis By Market Taxonomy, 2020 to 2024
    • Market Size Value (USD Billion) & Volume (Units) Forecast By Market Taxonomy, 2025 to 2035
      • By Country
        • USA
        • Canada
      • By Type
      • By Material
      • By End-Use Industry
    • Market Attractiveness Analysis
      • By Country
      • By Type
      • By Material
      • By End-Use Industry
    • Key Takeaways
  11. Latin America Market Analysis 2020 to 2024 and Forecast 2025 to 2035, By Country
    • Historical Market Size Value (USD Billion) & Volume (Units) Trend Analysis By Market Taxonomy, 2020 to 2024
    • Market Size Value (USD Billion) & Volume (Units) Forecast By Market Taxonomy, 2025 to 2035
      • By Country
        • Brazil
        • Mexico
        • Argentina
        • Chile
        • Peru
        • Rest of Latin America
      • By Type
      • By Material
      • By End-Use Industry
    • Market Attractiveness Analysis
      • By Country
      • By Type
      • By Material
      • By End-Use Industry
    • Key Takeaways
  12. Europe Market Analysis 2020 to 2024 and Forecast 2025 to 2035, By Country
    • Historical Market Size Value (USD Billion) & Volume (Units) Trend Analysis By Market Taxonomy, 2020 to 2024
    • Market Size Value (USD Billion) & Volume (Units) Forecast By Market Taxonomy, 2025 to 2035
      • By Country
        • Germany
        • Italy
        • France
        • UK
        • Spain
        • Russia
        • BENELUX
        • Rest of Europe
      • By Type
      • By Material
      • By End-Use Industry
    • Market Attractiveness Analysis
      • By Country
      • By Type
      • By Material
      • By End-Use Industry
    • Key Takeaways
  13. East Asia Market Analysis 2020 to 2024 and Forecast 2025 to 2035, By Country
    • Historical Market Size Value (USD Billion) & Volume (Units) Trend Analysis By Market Taxonomy, 2020 to 2024
    • Market Size Value (USD Billion) & Volume (Units) Forecast By Market Taxonomy, 2025 to 2035
      • By Country
        • China
        • Japan
        • South Korea
      • By Type
      • By Material
      • By End-Use Industry
    • Market Attractiveness Analysis
      • By Country
      • By Type
      • By Material
      • By End-Use Industry
    • Key Takeaways
  14. South Asia Market Analysis 2020 to 2024 and Forecast 2025 to 2035, By Country
    • Historical Market Size Value (USD Billion) & Volume (Units) Trend Analysis By Market Taxonomy, 2020 to 2024
    • Market Size Value (USD Billion) & Volume (Units) Forecast By Market Taxonomy, 2025 to 2035
      • By Country
        • India
        • Thailand
        • Malaysia
        • Indonesia
        • Rest of South Asia
      • By Type
      • By Material
      • By End-Use Industry
    • Market Attractiveness Analysis
      • By Country
      • By Type
      • By Material
      • By End-Use Industry
    • Key Takeaways
  15. Oceania Market Analysis 2020 to 2024 and Forecast 2025 to 2035, By Country
    • Historical Market Size Value (USD Billion) & Volume (Units) Trend Analysis By Market Taxonomy, 2020 to 2024
    • Market Size Value (USD Billion) & Volume (Units) Forecast By Market Taxonomy, 2025 to 2035
      • By Country
        • Australia
        • New Zealand
      • By Type
      • By Material
      • By End-Use Industry
    • Market Attractiveness Analysis
      • By Country
      • By Type
      • By Material
      • By End-Use Industry
    • Key Takeaways
  16. MEA Market Analysis 2020 to 2024 and Forecast 2025 to 2035, By Country
    • Historical Market Size Value (USD Billion) & Volume (Units) Trend Analysis By Market Taxonomy, 2020 to 2024
    • Market Size Value (USD Billion) & Volume (Units) Forecast By Market Taxonomy, 2025 to 2035
      • By Country
        • GCC
        • Rest of MEA
      • By Type
      • By Material
      • By End-Use Industry
    • Market Attractiveness Analysis
      • By Country
      • By Type
      • By Material
      • By End-Use Industry
    • Key Takeaways
  17. Key Countries Market Analysis
    • USA
      • Pricing Analysis
      • Market Share Analysis, 2024
        • By Type
        • By Material
        • By End-Use Industry
    • Canada
      • Pricing Analysis
      • Market Share Analysis, 2024
        • By Type
        • By Material
        • By End-Use Industry
    • Brazil
      • Pricing Analysis
      • Market Share Analysis, 2024
        • By Type
        • By Material
        • By End-Use Industry
    • Mexico
      • Pricing Analysis
      • Market Share Analysis, 2024
        • By Type
        • By Material
        • By End-Use Industry
    • Argentina
      • Pricing Analysis
      • Market Share Analysis, 2024
        • By Type
        • By Material
        • By End-Use Industry
  18. Market Structure Analysis
    • Competition Dashboard
    • Competition Benchmarking
    • Market Share Analysis of Top Players
      • By Regional
      • By Type
      • By Material
      • By End-Use Industry
  19. Competition Analysis
    • Competition Deep Dive
      • Industrias Tapla, S.L.
        • Overview
        • Product Portfolio
        • Profitability by Market Segments (Product/Age /Sales Channel/Region)
        • Sales Footprint
        • Strategy Overview
          • Marketing Strategy
          • Product Strategy
          • Channel Strategy
      • Pro Tapes & Specialties, Inc.
        • Overview
        • Product Portfolio
        • Profitability by Market Segments (Product/Age /Sales Channel/Region)
        • Sales Footprint
        • Strategy Overview
          • Marketing Strategy
          • Product Strategy
          • Channel Strategy
      • J.V. Converting Company, Inc.
        • Overview
        • Product Portfolio
        • Profitability by Market Segments (Product/Age /Sales Channel/Region)
        • Sales Footprint
        • Strategy Overview
          • Marketing Strategy
          • Product Strategy
          • Channel Strategy
      • DIMONTONATE FLOCCATI S.p.A.
        • Overview
        • Product Portfolio
        • Profitability by Market Segments (Product/Age /Sales Channel/Region)
        • Sales Footprint
        • Strategy Overview
          • Marketing Strategy
          • Product Strategy
          • Channel Strategy
      • 3M
        • Overview
        • Product Portfolio
        • Profitability by Market Segments (Product/Age /Sales Channel/Region)
        • Sales Footprint
        • Strategy Overview
          • Marketing Strategy
          • Product Strategy
          • Channel Strategy
      • Dorrie International Co
        • Overview
        • Product Portfolio
        • Profitability by Market Segments (Product/Age /Sales Channel/Region)
        • Sales Footprint
        • Strategy Overview
          • Marketing Strategy
          • Product Strategy
          • Channel Strategy
      • Spectro Coating Corp.
        • Overview
        • Product Portfolio
        • Profitability by Market Segments (Product/Age /Sales Channel/Region)
        • Sales Footprint
        • Strategy Overview
          • Marketing Strategy
          • Product Strategy
          • Channel Strategy
      • Aactus
        • Overview
        • Product Portfolio
        • Profitability by Market Segments (Product/Age /Sales Channel/Region)
        • Sales Footprint
        • Strategy Overview
          • Marketing Strategy
          • Product Strategy
          • Channel Strategy
      • SOOGANG CHEMICAL CO., LTD.
        • Overview
        • Product Portfolio
        • Profitability by Market Segments (Product/Age /Sales Channel/Region)
        • Sales Footprint
        • Strategy Overview
          • Marketing Strategy
          • Product Strategy
          • Channel Strategy
      • PTI GLOBAL PRODUCTS CO., LTD.
        • Overview
        • Product Portfolio
        • Profitability by Market Segments (Product/Age /Sales Channel/Region)
        • Sales Footprint
        • Strategy Overview
          • Marketing Strategy
          • Product Strategy
          • Channel Strategy
  20. Assumptions & Acronyms Used
  21. Research Methodology

List of Tables

  • Table 1: Global Market Value (USD Billion) Forecast by Region, 2020-2035
  • Table 2: Global Market Volume (Units) Forecast by Region, 2020-2035
  • Table 3: Global Market Value (USD Billion) Forecast by Type, 2020-2035
  • Table 4: Global Market Volume (Units) Forecast by Type, 2020-2035
  • Table 5: Global Market Value (USD Billion) Forecast by Material, 2020-2035
  • Table 6: Global Market Volume (Units) Forecast by Material, 2020-2035
  • Table 7: Global Market Value (USD Billion) Forecast by End-Use Industry, 2020-2035
  • Table 8: Global Market Volume (Units) Forecast by End-Use Industry, 2020-2035
  • Table 9: North America Market Value (USD Billion) Forecast by Country, 2020-2035
  • Table 10: North America Market Volume (Units) Forecast by Country, 2020-2035
  • Table 11: North America Market Value (USD Billion) Forecast by Type, 2020-2035
  • Table 12: North America Market Volume (Units) Forecast by Type, 2020-2035
  • Table 13: North America Market Value (USD Billion) Forecast by Material, 2020-2035
  • Table 14: North America Market Volume (Units) Forecast by Material, 2020-2035
  • Table 15: North America Market Value (USD Billion) Forecast by End-Use Industry, 2020-2035
  • Table 16: North America Market Volume (Units) Forecast by End-Use Industry, 2020-2035
  • Table 17: Latin America Market Value (USD Billion) Forecast by Country, 2020-2035
  • Table 18: Latin America Market Volume (Units) Forecast by Country, 2020-2035
  • Table 19: Latin America Market Value (USD Billion) Forecast by Type, 2020-2035
  • Table 20: Latin America Market Volume (Units) Forecast by Type, 2020-2035
  • Table 21: Latin America Market Value (USD Billion) Forecast by Material, 2020-2035
  • Table 22: Latin America Market Volume (Units) Forecast by Material, 2020-2035
  • Table 23: Latin America Market Value (USD Billion) Forecast by End-Use Industry, 2020-2035
  • Table 24: Latin America Market Volume (Units) Forecast by End-Use Industry, 2020-2035
  • Table 25: Europe Market Value (USD Billion) Forecast by Country, 2020-2035
  • Table 26: Europe Market Volume (Units) Forecast by Country, 2020-2035
  • Table 27: Europe Market Value (USD Billion) Forecast by Type, 2020-2035
  • Table 28: Europe Market Volume (Units) Forecast by Type, 2020-2035
  • Table 29: Europe Market Value (USD Billion) Forecast by Material, 2020-2035
  • Table 30: Europe Market Volume (Units) Forecast by Material, 2020-2035
  • Table 31: Europe Market Value (USD Billion) Forecast by End-Use Industry, 2020-2035
  • Table 32: Europe Market Volume (Units) Forecast by End-Use Industry, 2020-2035
  • Table 33: East Asia Market Value (USD Billion) Forecast by Country, 2020-2035
  • Table 34: East Asia Market Volume (Units) Forecast by Country, 2020-2035
  • Table 35: East Asia Market Value (USD Billion) Forecast by Type, 2020-2035
  • Table 36: East Asia Market Volume (Units) Forecast by Type, 2020-2035
  • Table 37: East Asia Market Value (USD Billion) Forecast by Material, 2020-2035
  • Table 38: East Asia Market Volume (Units) Forecast by Material, 2020-2035
  • Table 39: East Asia Market Value (USD Billion) Forecast by End-Use Industry, 2020-2035
  • Table 40: East Asia Market Volume (Units) Forecast by End-Use Industry, 2020-2035
  • Table 41: South Asia Market Value (USD Billion) Forecast by Country, 2020-2035
  • Table 42: South Asia Market Volume (Units) Forecast by Country, 2020-2035
  • Table 43: South Asia Market Value (USD Billion) Forecast by Type, 2020-2035
  • Table 44: South Asia Market Volume (Units) Forecast by Type, 2020-2035
  • Table 45: South Asia Market Value (USD Billion) Forecast by Material, 2020-2035
  • Table 46: South Asia Market Volume (Units) Forecast by Material, 2020-2035
  • Table 47: South Asia Market Value (USD Billion) Forecast by End-Use Industry, 2020-2035
  • Table 48: South Asia Market Volume (Units) Forecast by End-Use Industry, 2020-2035
  • Table 49: Oceania Market Value (USD Billion) Forecast by Country, 2020-2035
  • Table 50: Oceania Market Volume (Units) Forecast by Country, 2020-2035
  • Table 51: Oceania Market Value (USD Billion) Forecast by Type, 2020-2035
  • Table 52: Oceania Market Volume (Units) Forecast by Type, 2020-2035
  • Table 53: Oceania Market Value (USD Billion) Forecast by Material, 2020-2035
  • Table 54: Oceania Market Volume (Units) Forecast by Material, 2020-2035
  • Table 55: Oceania Market Value (USD Billion) Forecast by End-Use Industry, 2020-2035
  • Table 56: Oceania Market Volume (Units) Forecast by End-Use Industry, 2020-2035
  • Table 57: MEA Market Value (USD Billion) Forecast by Country, 2020-2035
  • Table 58: MEA Market Volume (Units) Forecast by Country, 2020-2035
  • Table 59: MEA Market Value (USD Billion) Forecast by Type, 2020-2035
  • Table 60: MEA Market Volume (Units) Forecast by Type, 2020-2035
  • Table 61: MEA Market Value (USD Billion) Forecast by Material, 2020-2035
  • Table 62: MEA Market Volume (Units) Forecast by Material, 2020-2035
  • Table 63: MEA Market Value (USD Billion) Forecast by End-Use Industry, 2020-2035
  • Table 64: MEA Market Volume (Units) Forecast by End-Use Industry, 2020-2035

List of Figures

  • Figure 1: Global Market Volume (Units) Forecast 2020-2035
  • Figure 2: Global Market Pricing Analysis
  • Figure 3: Global Market Value (USD Billion) Forecast 2020-2035
  • Figure 4: Global Market Value Share and BPS Analysis by Type, 2025 and 2035
  • Figure 5: Global Market Y-o-Y Growth Comparison by Type, 2025-2035
  • Figure 6: Global Market Attractiveness Analysis by Type
  • Figure 7: Global Market Value Share and BPS Analysis by Material, 2025 and 2035
  • Figure 8: Global Market Y-o-Y Growth Comparison by Material, 2025-2035
  • Figure 9: Global Market Attractiveness Analysis by Material
  • Figure 10: Global Market Value Share and BPS Analysis by End-Use Industry, 2025 and 2035
  • Figure 11: Global Market Y-o-Y Growth Comparison by End-Use Industry, 2025-2035
  • Figure 12: Global Market Attractiveness Analysis by End-Use Industry
  • Figure 13: Global Market Value (USD Billion) Share and BPS Analysis by Region, 2025 and 2035
  • Figure 14: Global Market Y-o-Y Growth Comparison by Region, 2025-2035
  • Figure 15: Global Market Attractiveness Analysis by Region
  • Figure 16: North America Market Incremental $ Opportunity, 2025-2035
  • Figure 17: Latin America Market Incremental $ Opportunity, 2025-2035
  • Figure 18: Europe Market Incremental $ Opportunity, 2025-2035
  • Figure 19: East Asia Market Incremental $ Opportunity, 2025-2035
  • Figure 20: South Asia Market Incremental $ Opportunity, 2025-2035
  • Figure 21: Oceania Market Incremental $ Opportunity, 2025-2035
  • Figure 22: MEA Market Incremental $ Opportunity, 2025-2035
  • Figure 23: North America Market Value Share and BPS Analysis by Country, 2025 and 2035
  • Figure 24: North America Market Value Share and BPS Analysis by Type, 2025 and 2035
  • Figure 25: North America Market Y-o-Y Growth Comparison by Type, 2025-2035
  • Figure 26: North America Market Attractiveness Analysis by Type
  • Figure 27: North America Market Value Share and BPS Analysis by Material, 2025 and 2035
  • Figure 28: North America Market Y-o-Y Growth Comparison by Material, 2025-2035
  • Figure 29: North America Market Attractiveness Analysis by Material
  • Figure 30: North America Market Value Share and BPS Analysis by End-Use Industry, 2025 and 2035
  • Figure 31: North America Market Y-o-Y Growth Comparison by End-Use Industry, 2025-2035
  • Figure 32: North America Market Attractiveness Analysis by End-Use Industry
  • Figure 33: Latin America Market Value Share and BPS Analysis by Country, 2025 and 2035
  • Figure 34: Latin America Market Value Share and BPS Analysis by Type, 2025 and 2035
  • Figure 35: Latin America Market Y-o-Y Growth Comparison by Type, 2025-2035
  • Figure 36: Latin America Market Attractiveness Analysis by Type
  • Figure 37: Latin America Market Value Share and BPS Analysis by Material, 2025 and 2035
  • Figure 38: Latin America Market Y-o-Y Growth Comparison by Material, 2025-2035
  • Figure 39: Latin America Market Attractiveness Analysis by Material
  • Figure 40: Latin America Market Value Share and BPS Analysis by End-Use Industry, 2025 and 2035
  • Figure 41: Latin America Market Y-o-Y Growth Comparison by End-Use Industry, 2025-2035
  • Figure 42: Latin America Market Attractiveness Analysis by End-Use Industry
  • Figure 43: Europe Market Value Share and BPS Analysis by Country, 2025 and 2035
  • Figure 44: Europe Market Value Share and BPS Analysis by Type, 2025 and 2035
  • Figure 45: Europe Market Y-o-Y Growth Comparison by Type, 2025-2035
  • Figure 46: Europe Market Attractiveness Analysis by Type
  • Figure 47: Europe Market Value Share and BPS Analysis by Material, 2025 and 2035
  • Figure 48: Europe Market Y-o-Y Growth Comparison by Material, 2025-2035
  • Figure 49: Europe Market Attractiveness Analysis by Material
  • Figure 50: Europe Market Value Share and BPS Analysis by End-Use Industry, 2025 and 2035
  • Figure 51: Europe Market Y-o-Y Growth Comparison by End-Use Industry, 2025-2035
  • Figure 52: Europe Market Attractiveness Analysis by End-Use Industry
  • Figure 53: East Asia Market Value Share and BPS Analysis by Country, 2025 and 2035
  • Figure 54: East Asia Market Value Share and BPS Analysis by Type, 2025 and 2035
  • Figure 55: East Asia Market Y-o-Y Growth Comparison by Type, 2025-2035
  • Figure 56: East Asia Market Attractiveness Analysis by Type
  • Figure 57: East Asia Market Value Share and BPS Analysis by Material, 2025 and 2035
  • Figure 58: East Asia Market Y-o-Y Growth Comparison by Material, 2025-2035
  • Figure 59: East Asia Market Attractiveness Analysis by Material
  • Figure 60: East Asia Market Value Share and BPS Analysis by End-Use Industry, 2025 and 2035
  • Figure 61: East Asia Market Y-o-Y Growth Comparison by End-Use Industry, 2025-2035
  • Figure 62: East Asia Market Attractiveness Analysis by End-Use Industry
  • Figure 63: South Asia Market Value Share and BPS Analysis by Country, 2025 and 2035
  • Figure 64: South Asia Market Value Share and BPS Analysis by Type, 2025 and 2035
  • Figure 65: South Asia Market Y-o-Y Growth Comparison by Type, 2025-2035
  • Figure 66: South Asia Market Attractiveness Analysis by Type
  • Figure 67: South Asia Market Value Share and BPS Analysis by Material, 2025 and 2035
  • Figure 68: South Asia Market Y-o-Y Growth Comparison by Material, 2025-2035
  • Figure 69: South Asia Market Attractiveness Analysis by Material
  • Figure 70: South Asia Market Value Share and BPS Analysis by End-Use Industry, 2025 and 2035
  • Figure 71: South Asia Market Y-o-Y Growth Comparison by End-Use Industry, 2025-2035
  • Figure 72: South Asia Market Attractiveness Analysis by End-Use Industry
  • Figure 73: Oceania Market Value Share and BPS Analysis by Country, 2025 and 2035
  • Figure 74: Oceania Market Value Share and BPS Analysis by Type, 2025 and 2035
  • Figure 75: Oceania Market Y-o-Y Growth Comparison by Type, 2025-2035
  • Figure 76: Oceania Market Attractiveness Analysis by Type
  • Figure 77: Oceania Market Value Share and BPS Analysis by Material, 2025 and 2035
  • Figure 78: Oceania Market Y-o-Y Growth Comparison by Material, 2025-2035
  • Figure 79: Oceania Market Attractiveness Analysis by Material
  • Figure 80: Oceania Market Value Share and BPS Analysis by End-Use Industry, 2025 and 2035
  • Figure 81: Oceania Market Y-o-Y Growth Comparison by End-Use Industry, 2025-2035
  • Figure 82: Oceania Market Attractiveness Analysis by End-Use Industry
  • Figure 83: MEA Market Value Share and BPS Analysis by Country, 2025 and 2035
  • Figure 84: MEA Market Value Share and BPS Analysis by Type, 2025 and 2035
  • Figure 85: MEA Market Y-o-Y Growth Comparison by Type, 2025-2035
  • Figure 86: MEA Market Attractiveness Analysis by Type
  • Figure 87: MEA Market Value Share and BPS Analysis by Material, 2025 and 2035
  • Figure 88: MEA Market Y-o-Y Growth Comparison by Material, 2025-2035
  • Figure 89: MEA Market Attractiveness Analysis by Material
  • Figure 90: MEA Market Value Share and BPS Analysis by End-Use Industry, 2025 and 2035
  • Figure 91: MEA Market Y-o-Y Growth Comparison by End-Use Industry, 2025-2035
  • Figure 92: MEA Market Attractiveness Analysis by End-Use Industry
  • Figure 93: Global Market - Tier Structure Analysis
  • Figure 94: Global Market - Company Share Analysis

Frequently Asked Questions

What was the overall size of the flocking tape market in 2025?

The overall market size for flocking tape market was USD 3.3 Billion in 2025.

How big the flocking tape market is expected in 2035?

The flocking tape market is expected to reach USD 5.1 Billion in 2035.

What will drive the demand for flocking tape market during the forecast period?

Increasing applications in automotive interiors, rising demand for noise reduction and surface protection, and growing adoption in packaging and textile industries will drive market growth.

List the top 5 countries contributing in flocking tape market?

The top 5 countries which drives the development of flocking tape market are USA, European Union, Japan, South Korea and UK.

Which segment in type is expected to lead flocking tape market?

Cotton flocking tapes growth to command significant share over the assessment period.

Explore Similar Insights

Future Market Insights

Flocking Tape Market