The Flight Data Monitoring and Analysis Market is estimated to be valued at USD 1.6 billion in 2025 and is projected to reach USD 3.7 billion by 2035, registering a compound annual growth rate (CAGR) of 8.5% over the forecast period.
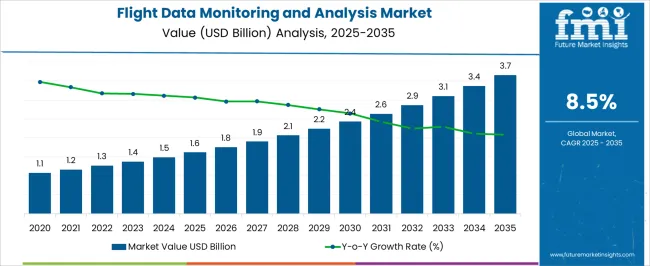
| Metric | Value |
|---|---|
| Flight Data Monitoring and Analysis Market Estimated Value in (2025 E) | USD 1.6 billion |
| Flight Data Monitoring and Analysis Market Forecast Value in (2035 F) | USD 3.7 billion |
| Forecast CAGR (2025 to 2035) | 8.5% |
The flight data monitoring and analysis market is expanding steadily as aviation operators increasingly prioritize safety, compliance, and operational efficiency. Rising air traffic volumes, coupled with stricter regulatory mandates from global aviation authorities, are compelling airlines and fleet operators to adopt advanced monitoring systems.
Continuous improvements in sensor technology, real time data transmission, and analytics platforms are enabling more proactive safety management and predictive maintenance. Airlines are recognizing the cost saving potential of these systems through reduced unscheduled maintenance and improved fuel efficiency.
Civil aviation growth in both passenger and cargo segments is further strengthening market adoption, while digital transformation initiatives in the aviation sector are ensuring the integration of flight data systems with broader operational platforms. The outlook for the market remains positive as the industry continues to emphasize risk reduction, operational reliability, and compliance with evolving safety standards.
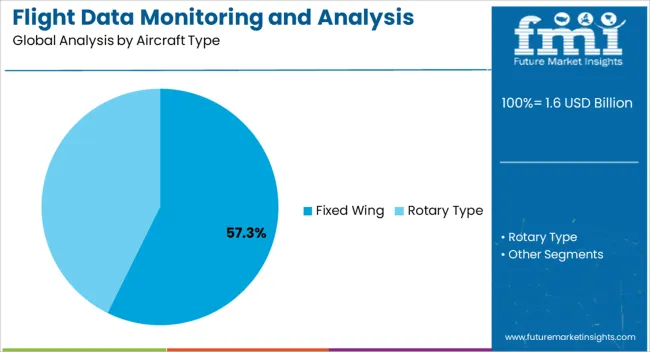
The fixed wing aircraft type segment is projected to account for 57.30% of total market revenue by 2025, making it the leading segment within the aircraft type category. This dominance is driven by the extensive use of fixed wing aircraft in commercial passenger and cargo aviation, where continuous monitoring of performance and safety parameters is essential.
Fixed wing fleets generate large volumes of operational data, creating significant opportunities for analysis to enhance predictive maintenance and reduce operational costs. The growing demand for fuel efficient operations and optimization of flight paths has further encouraged adoption.
Additionally, compliance with stringent aviation safety regulations has accelerated the deployment of monitoring systems across fixed wing fleets. These factors have consolidated the leadership of this segment in the overall market..
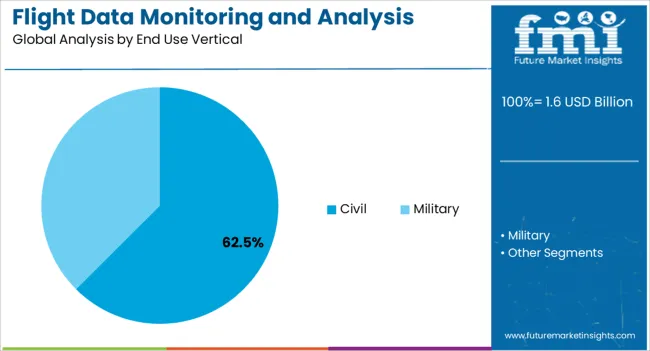
The civil end use vertical segment is expected to represent 62.50% of total market revenue by 2025, positioning it as the dominant category. This growth is supported by the rapid expansion of commercial aviation, increasing passenger traffic, and the rise of global cargo operations.
Civil operators are under constant pressure to improve safety standards, reduce downtime, and ensure regulatory compliance, making flight data monitoring and analysis essential. Investments in digital aviation infrastructure and the adoption of advanced data driven decision making tools are strengthening uptake.
Furthermore, civil airlines are increasingly leveraging these systems to enhance fuel management, reduce operational inefficiencies, and extend aircraft lifespan. These drivers collectively reinforce the civil segment’s leadership within the end use vertical of the flight data monitoring and analysis market.
A rise in the adoption of flight data monitoring and analysis platforms as part of the safety management systems is set to drive the growth of the FDMA market during the forecast period. Increasing regulatory standards by national and international aviation regulators are expected to support the growth of the global flight data monitoring and analysis market.
As aircraft deliveries rise and airlines experience better operational efficiency, the FDM services segment is poised to grow. The increasing need for increased situational awareness in order to ensure the efficient operation of an airline low maintenance costs and the increasing number of aircraft deliveries are factors driving the flight data monitoring market. Commercial helicopters have become more and more in demand for both search and rescue operations and personal transportation, which has further spurred the market for FDMA.
CARGO deliveries have increasingly become a huge factor in the development of FDMA as a market. As air transport continues to ascend in the world, there is a growing need to detect, process, and provide efficient solutions within the industry to combat risks. This is one of the major factors driving the global flight data monitoring and analysis market to expand at a rapid rate. Additionally, the growing demand for data processing systems for aviation also contributes to the growth of the global market.
In recent years, the increasing population and the economic growth of the middle classes in a wide range of countries have further contributed to the market growth of commercial aircraft worldwide. Tourism industries in many countries are growing and so are consumer spending habits, which has resulted in the demand for commercial aircraft growing in the market.
As a result, FDMA has emerged as a popular product on the market. The rising adoption of real-time data analytics and schedule management activities for aircraft flights are also expected to drive the growth of the global flight data monitoring market.
There are some concerns regarding the availability and misuse of the data. It is expected that these concerns may turn out to be a hindrance to the growth of the global market throughout the forecast period. A shortage of expertise in companies is expected to dampen the growth of the flight monitoring and analysis market in the near future.
The increase in air traffic and the lack of team members to track the data have contributed to the decline in the growth of the FDMA market. With the increasing costs of maintenance and the decreasing efficiency of these tracking solutions, the growth of these markets may be further stunted. Continued demand for new route innovations and tracking systems is expected to further decrease the FDMA market.
| Segment | Fixed Wing |
|---|---|
| Market Share (2025) | 67.3% |
| Market Size (2025) | USD 924.29 million |
| Market Size (2035) | USD 2,013.07 million |
The market for fixed-winged flight data monitoring and analysis is growing at a CAGR of 9% during the forecast period. As a general rule, fixed-wing aircraft have larger seating capacities and heavier weights than rotary-wing aircraft. Fixed-wing aircraft have a much higher application number and carry an extensive quantity of cargo compared to rotary-wing aircraft. As a result, the FDMA market is experiencing an increase in demand for fixed-wing aircraft in the market.
According to analysts, the fixed-wing aircraft segment is expected to dominate the FDMA market since the FDMA solutions require certificated take-off masses up to 26,000 kg, contributing to the growth of the fixed-wing segment.
A continuing need for more accurate approaches to landings and takeoffs of flights, particularly in conditions of extremely poor weather and other conditions, has led to a growing demand for fixed-wing health monitors.
| Segment | Civil |
|---|---|
| Market Share (2025) | 55.4% |
| Market Size (2025) | USD 760.86 million |
| Market Size (2035) | USD 1,657.12 million |
Within the civil segment, sales are anticipated to grow at a CAGR of 9% during the forecast period. As a result of the increasing number of aviation activities within the civil sector, it is estimated to lead the market in the coming few years.
With an increase in the number of passengers being transported in the commercial segment and a growth in cargo loads, flight data monitoring and analysis have become more and more popular. An increased number of personal and security concerns of different consumers are contributing to the growing demand for FDMA in the market, as well as medical, agriculture, and search and rescue operations.
The rise in air traffic in developing economies, the proliferation of commercial aircraft, and the growing use of data analytics in-flight operations are pushing civil aviation to become a global leader in in-flight data monitoring and analysis. Furthermore, there are operational challenges and personnel issues that are unique to naval aviation that pose significant challenges that are usually not encountered in civil aviation FOQA programs.
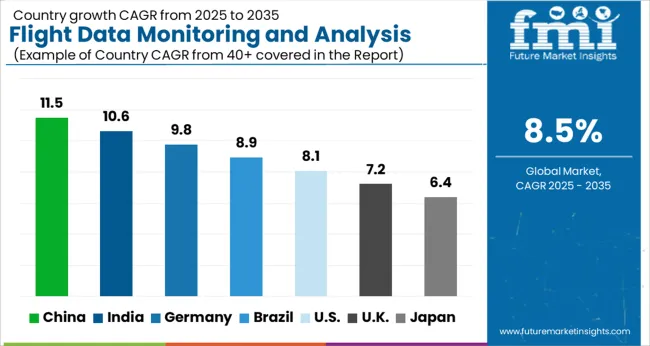
| Country | China |
|---|---|
| CAGR % (2025 to 2035) | 10.1% |
Due to the increasing demand for aircraft and flight data monitoring services from Asia Pacific countries in recent years, the market in China is projected to grow at the significant CAGR of 10.1% during the forecast period. During the forecast period, a growing number of new aircraft are anticipated to be delivered to militaries, commercial airlines, as well as armed forces in major countries such as China, India, Japan, South Korea, and others.
| Region | Japan |
|---|---|
| Market Share % 2025 | 6.1% |
| Market Size (USD million) by 2025 | USD 83.77 million |
| Market Size (USD million) by End of Forecast Period 2035 | USD 182.46 million |
According to FMI, Japan is expected to acquire more than 6.1% market share in 2025. Moreover, Boeing has projected that over the next two decades, the Asia Pacific region is expected to account for about 40% of all new aircraft deliveries in 2039. Hence, flight data monitoring systems will be more in demand over the coming decades. In addition to the escalating fleet of aircraft, the increased demand for flight data monitoring services is being generated in the market.
| Country | The United Kingdom |
|---|---|
| CAGR % (2025 to 2035) | 7.2% |
According to the study, the United Kingdom market is expected to garner a market value of USD 3.7 million in 2035, with a projected CAGR of 7.2%. Both industrial production and consumer spending growth are expected to boost the market value of this area in the near future. As the import and export businesses in this region have grown steadily, there has been an increase in the market demand for flight data monitoring and analysis. The market size for Brazil is projected to reach USD 27.2 million by the end of the forecast period.
Concerns over the safety of airlines and the escalating number of accidents caused by inadequate maintenance have accelerated the market demand for flight data monitoring and analysis.
| Region | North America |
|---|---|
| Market Share % 2025 | 26.3% |
| Market Size (USD million) by 2025 | USD 361.20 million |
| Market Size (USD million) by End of Forecast Period (2035 | USD 786.68 million |
Globally, the flight data monitoring market is expected to be dominated by North America in 2025. The United States is home to a large number of aircraft, and several service providers and component manufacturers are located in the country, which has helped to increase this market presence globally. As a result of the growth of the market for flight data monitoring and analysis during the forecast period, the market is expected to expand at a CAGR of 7.8%.
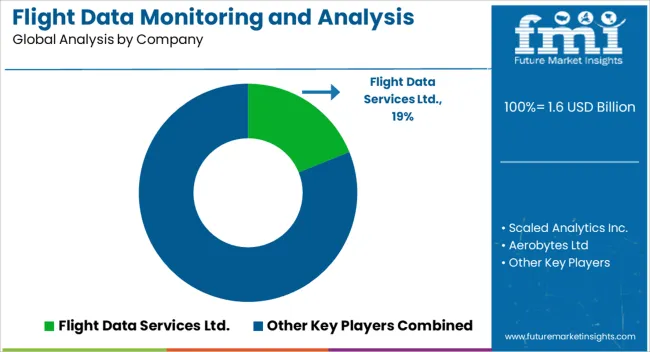
Through strategic partnerships, manufacturers can increase production and meet consumer demand, increasing both their revenues and market share. The introduction of new products and technologies is projected to allow end-users to reap the benefits of new technologies. Increasing the company's production capacity is one of the potential benefits of a strategic partnership.
Recent Developments in the Flight Data Monitoring and Analysis Market
| Attribute | Details |
|---|---|
| Forecast Period | 2025 to 2035 |
| Historical Data Available for | 2020 to 2025 |
| Market Analysis | USD million for Value |
| Key Regions Covered | North America; Latin America; Europe; the Asia Pacific; and the Middle East and Africa (MEA) |
| Key Countries Covered | The United States, Canada, Mexico, Germany, the United Kingdom, France, Italy, China, Japan, South Korea, Australia, Brazil, the Middle East, and Africa |
| Key Segments Covered | Aircraft Type, End Use Vertical, and Region |
| Key Companies Profiled | Flight Data Services Ltd.; Scaled Analytics Inc.; Aerobytes Ltd; Curtiss-Wright Corporation; Teledyne Controls LLC.; Hi-fly Marketing; NeST Aerospace Pvt Ltd; Guardian Mobility Corporation; French Flight Safety; Helinalysis; FlightDataPeople; Safran Electronics & Defense |
| Report Coverage | Market Forecast, Company Share Analysis, Competition Intelligence, Drivers, Restraints, Opportunities and Threats Analysis, Market Dynamics and Challenges, and Strategic Growth Initiatives |
| Customization & Pricing | Available upon Request |
The global flight data monitoring and analysis market is estimated to be valued at USD 1.6 billion in 2025.
The market size for the flight data monitoring and analysis market is projected to reach USD 3.7 billion by 2035.
The flight data monitoring and analysis market is expected to grow at a 8.5% CAGR between 2025 and 2035.
The key product types in flight data monitoring and analysis market are fixed wing and rotary type.
In terms of end use vertical, civil segment to command 62.5% share in the flight data monitoring and analysis market in 2025.


Full Research Suite comprises of:
Market outlook & trends analysis
Interviews & case studies
Strategic recommendations
Vendor profiles & capabilities analysis
5-year forecasts
8 regions and 60+ country-level data splits
Market segment data splits
12 months of continuous data updates
DELIVERED AS:
PDF EXCEL ONLINE
Flight Line Testing Equipment Market Size and Share Forecast Outlook 2025 to 2035
Flight Inspection Market Size and Share Forecast Outlook 2025 to 2035
Flight Tracking System Market Insights - Trends & Forecast 2025 to 2035
Flight Simulator Market Report – Trends & Forecast 2020-2030
Flight Data Recording (FDR) Market Size and Share Forecast Outlook 2025 to 2035
In-flight Internet Market Size and Share Forecast Outlook 2025 to 2035
In-flight Entertainment & Connectivity Market
In-flight Retail and Advertising Market Size and Share Forecast Outlook 2025 to 2035
Time Of Flight Cameras Market Size and Share Forecast Outlook 2025 to 2035
Time of Flight (ToF) Sensor Market Insights - Growth & Forecast 2025 to 2035
Aircraft Flight Recorder Market Size and Share Forecast Outlook 2025 to 2035
Aircraft Flight Control System Market Share, Trend & Forecast 2024-2034
Electronic Flight Bag Market Size and Share Forecast Outlook 2025 to 2035
Datacenter Infrastructure Services Market Size and Share Forecast Outlook 2025 to 2035
Data Acquisition Hardware Market Size and Share Forecast Outlook 2025 to 2035
Data Discovery Market Size and Share Forecast Outlook 2025 to 2035
Data Masking Technology Market Size and Share Forecast Outlook 2025 to 2035
Data Centre Rack Server Market Size and Share Forecast Outlook 2025 to 2035
Data Center Liquid Cooling Market Size and Share Forecast Outlook 2025 to 2035
Data Business in Oil & Gas Market Size and Share Forecast Outlook 2025 to 2035

Thank you!
You will receive an email from our Business Development Manager. Please be sure to check your SPAM/JUNK folder too.
Chat With
MaRIA