The global flavors and fragrances market is estimated to be worth USD 30.5 billion in 2025 and is projected to reach a value of USD 48.9 billion by 2035, expanding at a CAGR of 4.9% over the assessment period of 2025 to 2035.
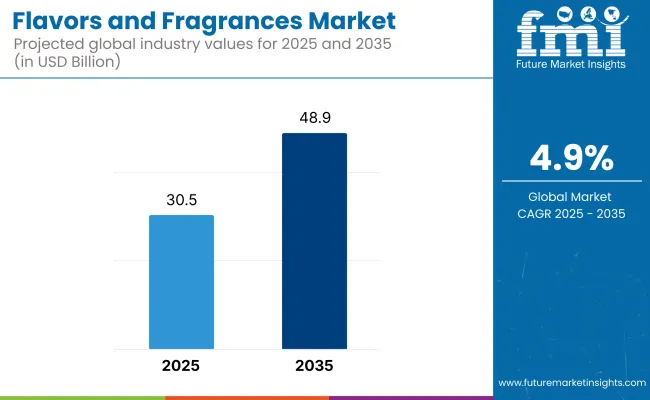
The industry shows a stable growth trend, which is attributed to the higher consumer demand for different kinds of sensory experiences in industries such as food and beverages, personal care, home care, and fine fragrances. The strong regard for natural and organic materials, as well as the furthering of the different extraction and formulation technologies, are the main factors leading to market trends and innovations.
The food and beverage industry stands as the most important factor contributing to the growth, with manufacturers focusing on the selection of the right flavor solutions that will not only increase product appeal but will also meet the requirements of consumers who are interested in clean-label and health-conscious food options.
The focus on plant-based and functional foods has been on the rise due to the desire for more natural flavors like those from fruit, herbs, and botanicals. In addition, the development of sugar-free drinks and confections has brought the idea of flavor modulation to the forefront. The perfume industry is riding the wave of premium and customized scents that are being used in popular products such as perfumes, cosmetics, and home care products.
People have started looking for fragrances that will not only trigger positive emotions but will also help them live better; thus, because of the demand for these products, businesses are turning to aquaculture and naturally sourced ingredients for their formulations. Also, niche and artisanal brands, as well as newer perfumery companies, are bringing new products to the market and pushing consumer participation.
The industry is undergoing a significant transformation with the help of technology such as scent creation powered by AI and biotechnology-based flavor synthesis. This is the result of the activities of many producers who tend to be more sustainable, dynamic, and effective.
Thus, they meet the demands of clients who are changing, as well as the legal and environmental regulations. Moreover, the rise of online platforms and digital marketing initiatives has played a big role in increasing product availability and consumer interaction with the brand. Nevertheless, there are several challenges, including variable raw material costs, the disruption of the supply chain, and the constraints from regulations on the use of synthetic substances.
The industry dynamics are also affected by the need for sustainable sourcing of natural materials such as vanilla, citrus fruit extracts, and sandalwood. Creative solutions to these obstacles can be found through collaboration with companies that have a strong commitment to ethical sourcing, green production, and transparency of ingredient origins.
The flavor and fragrance industry experienced strong growth between 2020 and 2024, driven by increasing consumer demand for natural and organic ingredients, clean-label products, and customized sensory experiences. Growing health awareness and sensitivity to the degradative effects of artificial additives created a trend towards natural and vegetative flavoring ingredients in the guise of essential oils, plant extracts, and fruit concentration.
Consumerism within the fragrance sector also spurred products that are green, sustainable, and hypoallergenic. The food and beverage industry presented functional flavoring that offered health benefits such as stress relief and immunity. The overall health and wellness trend was reflected through this. The toiletries and cosmetics markets focused on long-lasting, naturally fragranced scents to become more consumer-focused.
Enzyme technology and improvements in encapsulation and controlled-release systems improved fragrance and flavor stability and shelf life. Regulatory shifts toward increased transparency and safety impacted product design and label regulation. During the period 2025 to 2035, flavor and fragrance markets will be influenced by biotechnology trends, artificial intelligence product development, and green sourcing.
Fermentation-based production of natural flavoring and fragrances will decrease the environmental footprint and improve consistency. Machine learning and AI will facilitate the quick development of region-specific and custom flavor and fragrance profiles from consumer behavior information. Greater bioengineering expertise will develop new scent compounds and flavor molecules, offering more products.
Sustainability will continue to be a priority arena, with greater application of biodegradable and upcycled ingredients. Emotional and physical health-supportive functional aromas and tastes, like reduced stress and better sleep, will have wider applications. Traceability and transparency will be the norm, with blockchain and digital marking conveying product information to the consumer.
A Comparative Market Shift Analysis (2020 to 2024 vs. 2025 to 2035)
| 2020 to 2024 | 2025 to 2035 |
|---|---|
| Increased demand for natural and organic flavors and fragrances. | Fermentation-based manufacturing for sustainability and homogeneity. |
| Growing applications of essential oils, botanical extracts, and fruit concentrations. | Personalized fragrance and flavor profiles through AI-assisted formulation. |
| Clean-label and healthy-focused flavors and fragrances for foods and beverages. | Bioengineering with the production of new aroma and flavor molecules. |
| Long-lasting and hypoallergenic fragrances with personal care focus. | More functional flavors for emotional and physical well-being. |
| Regulatory push for transparency and product safety. | Blockchain and digital labeling to trace and engender consumer confidence. |
Globally, the industry of flavors and fragrances is growing due to increasing demand for natural, sustainable, and personalized formulations. Customers are more attracted to plant-based, organic, and allergen-free ingredients, prompting innovation in essential oils, botanical extracts, and synthetic-free chemicals.
In the food and beverage segment, flavors are of prime importance in enriching taste profiles, with the demand for clean-label and functional flavors increasing. The personal care industry is more focused on sustainable and skin-compatible fragrances, with a transition to biodegradable and hypoallergenic ingredients. Fine fragrances are all about exclusivity and high-end sourcing, while household products such as detergents and air fresheners concentrate on lasting and economical fragrances.
Regulatory compliance continues to be essential, providing safe formulations across industries. Moreover, developments in scent technology, AI formulation, and encapsulation methods are transforming the industry, addressing the increasing demand for customized sensory experiences.
The increase in consumer demand for natural and ecological ingredients have impacted the global market. However, stringent regulatory requirements on food additives, cosmetic formulations, and labeling pose compliance challenges. Companies need to deal with shifting safety standards, ensure the administration of all required approvals, and maintain product transparency to maintain consumer trust and approval in the market.
Freight gaps, including defects in material availability, changes in oil prices, and transportation bottlenecks, affect production. As the industry straddles its reliance on nature, which is mostly a solid vegetation supply, some production is heavily dependent on climate variables and political challenges.
The turning of consumers toward clean-label, organic, and allergen-free products has been boosting synthetic fragrance and flavor makers. The increase in observed dangers to public health attributable to artificial chemicals propels the demand for plant-based and sustainably sourced substitutes. The firms have to come up with methods of innovating, extracting from nature, and using a transparency-focused route of marketing in order to match the expectations of the consumers.
Frictional completions from other substances and tightening of the industry tree upstream the profit margin. Big companies and young customization enterprises hold the standing point of the market and fight for their share by emphasizing different kinds of product offerings. The firms are investing a lot to progress and gain a large revenue.
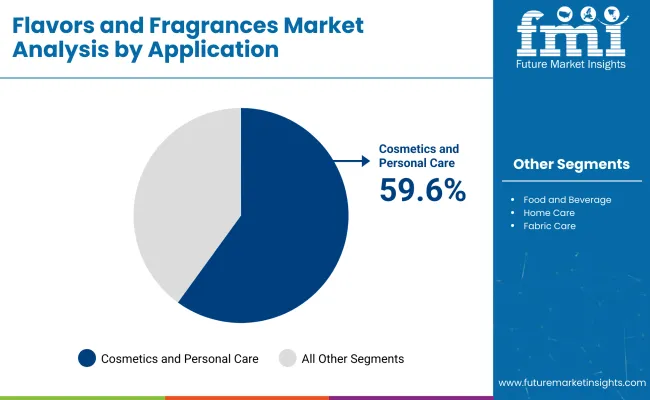
Cosmetics and Personal Care Driving the Largest Market Share in Flavors and Fragrances
| Segment | Value Share (2025) |
|---|---|
| Cosmetics and Personal Care (Application) | 59.6% |
In terms of application, the flavors and fragrances industry is segmented into the following types, of which the largest market share in 2025, 59.6%, belongs to the cosmetics and personal care sector. This popularity is due to the increased consumer need for high-end skincare, haircare, and personal hygiene products that are embedded with unique and long-lasting fragrances.
Natural and sustainable fragrance materials such as essential oils and plant extracts are also gaining ground as brands lean even more into clean beauty and eco-conscious formulations. Synthetic-free and hypoallergenic personal care product influencers such as Givaudan, Firmenich, and Symrise have partnered to develop biotechnology-based fragrance compounds.
The food and beverages segment captains a market share of 20.0%, which is supported by the increasing utilization of natural and exotic flavors in processed foods and confectionery and the growth of the beverage industry.
Consumers are craving clean-label products with real and regionally inspired flavors, resulting in an increased use of botanical extracts, fruit-based flavors, and fermentation-derived taste enhancers. Key companies such as International Flavors & Fragrances (IFF) and Takasago are focusing on natural and innovative flavor solutions for the functional beverage and plant-based food sectors.
As consumer habits transform in favor of greater health and sensorial experiences, the flavors and fragrances sector is evolving with sustainable sourcing, AI-driven formulation methods, and personalized scent/flavor experiences poised for continuous market expansion across diverse applications.
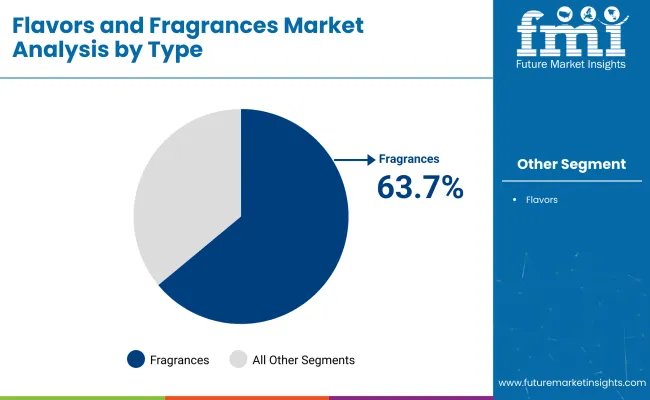
Niche and Luxury Fragrances Gaining Dominance in Global Consumer Preferences
| Segment | Value Share (2025) |
|---|---|
| Fragrances (Type) | 63.7% |
The fragrances segment is projected to dominate the industry, with 63.7% of the market share during the forecast period of 2025. Luxury perfumes, personal care products, and home fragrances are in high demand and are driving growth in this segment. Consumers are looking for long-lasting, natural, and sustainable scents, which is why brands are now infusing their products with essential oils, botanical extracts, and biodegradable fragrance compounds.
Companies leading the biotech fragrance revolution include Givaudan, Firmenich, and Symrise, which have developed synthetic-free and hypoallergenic perfumes. The home fragrance category, which includes scented candles and room sprays, is also growing quickly as people increasingly invest in self-care and ambient scenting.
Based on flavor, the segmentation is into flavors which hold 36.3% of the overall revenue due to its increasing demand for natural and clean-label flavoring products in food and beverages. As plant-based diets, functional foods , and organic products gain popularity, companies are looking to use botanicals, fermentation-derived flavors, and regional taste profiles to engage health-conscious consumers.
The demand for unique flavors has motivated companies to invest in sophisticated technologies such as artificial intelligence solutions offered by the leading key players, including International Flavors & Fragrances (IFF), Takasago, and others.
With the changing consumer demands of authenticity, sustainability, and wellness, the flavors and fragrances industry is undergoing a fast evolution, with new paradigms in natural extraction, sensory science, and bioengineered scent/flavor solutions defining future trends.
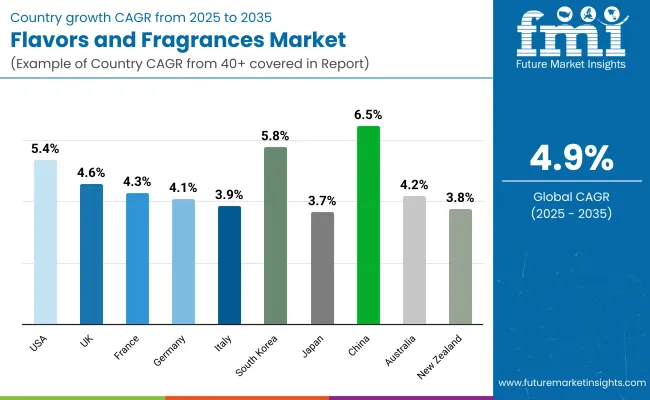
| Countries | Estimated CAGR |
|---|---|
| The USA | 5.4% |
| The UK | 4.6% |
| France | 4.3% |
| Germany | 4.1% |
| Italy | 3.9% |
| South Korea | 5.8% |
| Japan | 3.7% |
| China | 6.5% |
| Australia | 4.2% |
| New Zealand | 3.8% |
The USA will expand at a CAGR of 5.4% during 2025 to 2035 due to rising demand for natural, clean-label ingredients and functional fragrances. The demand for organic, plant-based, and lower-sugar foods influences the USD 8+ billion industry for flavors in 2024.
Leaders such as International Flavors & Fragrances (IFF) and Sensient Technologies are concentrating on biotechnology to create sustainable flavor solutions. Soaring demand for plant-based proteins has also generated flavor masking demand, which improves the palatability of alternative meat alternatives.
The USD 6 billion USA fragrance industry is moving towards well-being and mood products. Customers are looking for non-toxic and bio-based fragrances, with niche and refillable players like Le Labo and Byredo leading the way. Major players are rethinking green extraction methods and using reusable packaging to minimize the eco-footprint.
The UK is expected to record a CAGR of 4.6% due to a preference for local and heritage ingredients. The flavors market is valued at approximately USD 2.5 billion and has seen increasing demand for heritage British flavors like elderflower, blackcurrant, and rhubarb, particularly in confectionery and beverages. Firmenich UK and Treatt are focusing on natural extracts to develop premium flavors.
The perfumery industry, which is valued at over USD 2 billion annually, is witnessing a resurgence of niche and artisan perfumeries like Penhaligon's and Jo Malone London. British shoppers are demanding luxury Earl Grey, bergamot, and chamomile-scented perfumes. Green consumers are opting for environmentally friendly formulations, fragrance-free alcohol, and refillable containers.
France, the capital of world perfumery, is likely to grow at 4.3% CAGR with luxury brand and fragrance layering innovation. The USD 3.5 billion French flavor industry is on the rise, with increasing demand for gourmet and natural flavor profiles. Luxury food companies are incorporating truffle, lavender, and saffron in products to place them at a premium position in the value chain.
Players such as Mane and Robertet are at the forefront of employing natural methods of extracting fragrances. USD 10 billion in French perfumery is witnessing increased oil-based perfumes with high content levels. Brands such as Guerlain and Maison Francis Kurkdjian are responding to customers' desire for long-lasting scents.
Germany will expand at 4.1% CAGR through scientific development in the guise of clean-label and functional ingredients. Valued at USD 3 billion, the industry is shifting towards functional beverages with immune-boosting and gut health-boosting flavors. Symrise and Döhler are spearheading this shift through botanical extracts and natural sweeteners.
Germany's perfume industry is more than USD 4 billion, and it is going toward hypoallergenic and dermatologically tested perfumes. Perfumes with functional fragrances that deliver skin benefits are gaining traction, with players such as 4711 introducing anti-inflammatory ingredients. Sustainability is one of the reasons behind this, with consumers demanding more and more cruelty-free and green perfumes.
Italy's flavor and aroma market will grow at a CAGR of 3.9% due to demand for artisanal and Mediterranean-style ingredients. The flavors industry, about USD 2.8 billion, is seeing growth in herbal infusion and citrus-flavored foods like blood orange, rosemary, and basil. Companies like FlavourArt and Molinari are taking advantage of regional farming traditions to produce distinctive flavors.
Italian 3.5 billion USD perfume business is famous for luxurious, hand-filled perfumes. Bulgari and Acqua di Parma, among many others, are adding bergamot, iris, and amber to their creations. The wave of customized and limited perfumes is being driven, and these are attracting upmarket consumers.
South Korea's fragrance and flavor industry will expand with a CAGR of 5.8% amidst the pull of K-food and K-beauty trends. Flavors, accounting for an estimated value of around USD 1.5 billion, are seeing growing demand for gochujang, makgeolli, and kimchi seasoning flavors. Companies like CJ CheilJedang are designing functional flavors to ensure gastrointestinal wellness.
USD 1 billion worth of the beauty business is adopting light, alcohol-free perfumes. Light, long-lasting fragrance molecules are being launched in Korean beauty firms' skin care and personal care products. AI-based perfume design apps are emerging to allow customers to create customized perfumes.
Japan will expand at a CAGR of 3.7% during the demand phase for sophisticated, refined fragrances. The flavor business, at USD 2.8 billion, is experiencing growing demand for green tea and umami-smelling flavors. Companies like Takasago and Ajinomoto are key leaders in innovative, high-quality flavors.
The USD 2.5 billion Japanese perfume market is drawn towards plain, nature-based perfumes. Shiseido and Kao focus on floral and aqua fragrances as their perfume composition. Alcohol-free and eco-friendly packaging are the themes in the high-end segment.
The Chinese flavor ingredients and fragrance industry is growing at a CAGR of 6.5%, driven by Guochao (China-chic) trends. The demand for flavors, valued at over USD 5 billion, is seeing a rise in Chinese heritage ingredients like osmanthus, Sichuan pepper, and goji berries. Huabao International and others are working on new-generation natural extracts.
Valued at USD 3 billion, the fragrance industry is expanding on the strength of middle-class growth and premium fragrance consumption. The customers are fond of long-lasting, high-end fragrances, and local players use peony, sandalwood, and white tea in the formulations.
Australia is expected to grow at a CAGR of 4.2% by propelling demand for native botanical ingredients. The flavor sector, valued at USD 1.8 billion, is expanding in the lemon myrtle, Tasmania pepper berry, and eucalyptus flavors.
The USD 1.5 billion Australian perfume industry is witnessing an increase in demand for natural and vegan perfumes. Companies such as Goldfield & Banks are integrating Australian native botanicals while developing unique scents.
New Zealand is expected to grow at a CAGR of 3.8%, focusing on natural and sustainable ingredients. The flavor industry, worth USD 900 million, is dominated by Manuka honey and kawakawa leaf extracts. The perfume industry, worth USD 700 million, is going green and local, with the growing demand for minimalist nature-inspired perfumes.
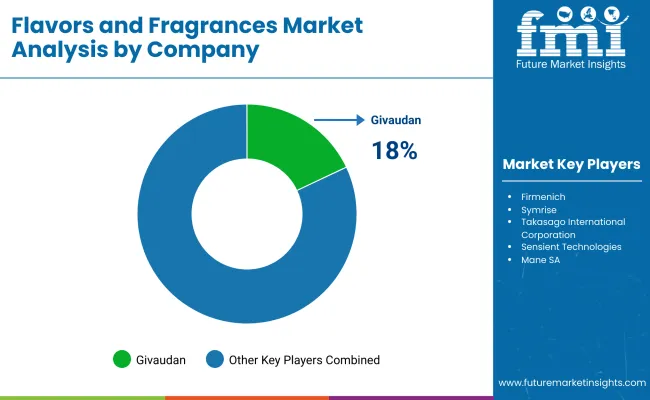
The flavors and fragrances industry is highly competitive, driven by consumer demand for natural, clean-label, and sustainable products. Innovation in biotechnology-based scent development, AI-driven formulation techniques, and advanced extraction methods are shaping the industry, with a growing focus on plant-based and biodegradable ingredients.
Key players, including Givaudan, Firmenich, International Flavors & Fragrances (IFF), Symrise, and Takasago, dominate the industry, offering diverse solutions for food & beverages, personal care, and luxury perfumery. These companies are investing in sustainable ingredient sourcing, synthetic biology, and AI-driven sensory analysis to enhance product performance.
A shift towards functional flavors and fragrances, such as mood-enhancing scents and health-focused flavoring agents, marks industry evolution. For instance, Givaudan has developed biotech-based vanilla extracts, while Symrise is focusing on upcycled raw materials for fragrance innovation.
Additionally, IFF’s investment in AI-driven flavor prediction technology enhances precision in taste development. Strategic factors influencing competition include sustainability initiatives, regulatory compliance, and expansion in emerging industries. Companies are partnering with local suppliers, investing in green chemistry, and integrating digital tools for consumer-driven scent personalization to strengthen their global presence.
Market Share Analysis by Company
| Company Name | Estimated Market Share (%) |
|---|---|
| Givaudan | 18-22% |
| International Flavors & Fragrances (IFF) | 14-18% |
| Firmenich | 12-16% |
| Symrise | 10-14% |
| Takasago International Corporation | 6-10% |
| Other Players (Combined) | 25-35% |
| Company Name | Key Offerings & Focus |
|---|---|
| Givaudan | A global leader in fragrances and flavors, investing in biotechnology, AI-powered scent creation, and sustainable ingredient sourcing. |
| IFF (International Flavors & Fragrances) | Focuses on natural flavors, functional fragrances, and plant-based aroma solutions with AI-driven formulation technology. |
| Firmenich | Pioneers clean-label and biodegradable scent solutions with a strong emphasis on sustainable and ethical sourcing. |
| Symrise | Innovates in bio-based fragrance molecules, sensory-driven flavor enhancers, and regionalized taste solutions. |
| Takasago International Corporation | Specializes in Asian-inspired flavors and unique perfumery blends, leveraging green chemistry for sustainable production. |
Key Company Insights
Givaudan (18-22%)
This key leader is growing in AI-driven fragrance creation and biotech-inspired flavor development, having just purchased DDW, The Color House, to bolster natural color offerings.
IFF (14-18%)
A global leader in functional and natural flavors, combining health-oriented ingredients and botanically derived extracts to respond to clean-label requirements.
Firmenich (12-16%)
Solid in biodegradable and sustainable fragrance solutions, having just merged with DSM to drive nutrition and wellness innovation.
Symrise (10-14%)
Hires extensively in bio-based molecules and sustainable flavor extraction, with a concentration on local tastes.
Takasago (6-10%)
Asian flavor palette strength and historic perfumery expertise, plus increasing emphasis on green chemistry approach to fragrance assembly.
Other Key Players
This segment is further categorized into Flavors and fragrances.
This segment is further categorized into Natural and synthetic.
This segment is further categorized into food and beverage, cosmetics and personal care, home care, and fabric care.
Industry analysis has been carried out in key countries such as North America, Latin America, Eastern Europe, Western Europe, East Asia, South Asia & Pacific, Central Asia, Balkan and Baltic Countries, Russia & Belarus, and the Middle East & Africa.
The global Flavors and Fragrances industry is estimated to be valued at USD 30.5 billion in 2025.
Sales of Flavors and Fragrances increased at a CAGR of 4.9% between 2025 and 2035.
According to forecasts, the industry is expected to be worth USD 48.9 billion by 2035, growing at an estimated CAGR of 4.9% during the forecast period (2025 to 2035).
Some of the leading players in this industry include Givaudan, International Flavors & Fragrances (IFF), Firmenich, Symrise, Takasago International Corporation, Sensient Technologies, Mane SA, Robertet Group, Bell Flavors & Fragrances, and Ungerer & Company.
The Asia-Pacific region is projected to hold a revenue share of 37% over the forecast period.
North America holds a 29% share of the global demand space for Flavors and Fragrances.


Full Research Suite comprises of:
Market outlook & trends analysis
Interviews & case studies
Strategic recommendations
Vendor profiles & capabilities analysis
5-year forecasts
8 regions and 60+ country-level data splits
Market segment data splits
12 months of continuous data updates
DELIVERED AS:
PDF EXCEL ONLINE
Encapsulated Flavors and Fragrances Market Analysis by Product Type, Technology, Wall Material, End-use, Encapsulated Form, Process, and Region through 2035
Flavors for Pharmaceutical & Healthcare Applications Market Size and Share Forecast Outlook 2025 to 2035
Feed Flavors Market Size and Share Forecast Outlook 2025 to 2035
Food Flavors Market Insights – Taste Innovation & Industry Expansion 2025 to 2035
Pork Flavors Market Analysis by Form, Packaging and Distribution Channel Through 2035
Beef Flavors Market Insights - Trends & Forecast 2025 to 2035
Bacon Flavors Market Size, Growth, and Forecast for 2025 to 2035
Dairy Flavors Market Trends - Growth & Industry Forecast 2025 to 2035
Global Umami Flavors Market Insights – Growth, Demand & Forecast 2025–2035
Turkey Flavors Market Trends Size & Forecast 2025 to 2035
Citrus Flavors Market Report – Trends & Innovations 2025 to 2035
Liquid Flavors Market Analysis – Demand, Growth & Forecast 2025-2035
Analysis and Growth Projections for Natural Flavors Business
Seafood Flavors Market Growth - Innovations & Industry Demand 2025 to 2035
Chicken Flavors Market
Cat Food Flavors Market
Botanical Flavors Market Size and Share Forecast Outlook 2025 to 2035
Alcoholic Flavors Market Size, Growth, and Forecast for 2025 to 2035
Chocolate Flavors Market Analysis by Product Type, and Application Through 2035
Clean Label Flavors Market Analysis by Liquid Systems, Spray-Dried Powders, Encapsulated Flavors, Emulsion-Based Delivery Systems Through 2035

Thank you!
You will receive an email from our Business Development Manager. Please be sure to check your SPAM/JUNK folder too.
Chat With
MaRIA