Fiber Optic Collimating Lens Market Outlook (2023 to 2033)

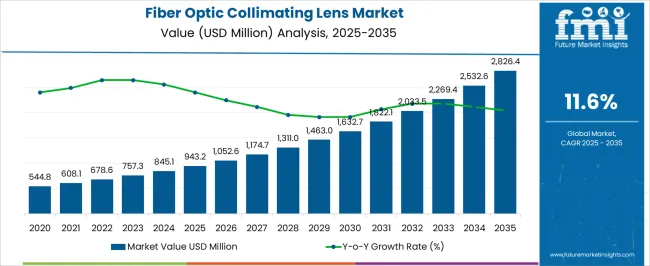
The global fiber optic collimating lens market size is anticipated to gain substantial growth from 2023 to 2033. According to the research report published by Future Market Insights, the global market is poised to cross a valuation of US$ 757.3 million in 2023. It is anticipated to reach a valuation of US$ 2,394.5 million by 2033. The market is predicted to showcase a striking CAGR of 11.6% from 2023 to 2033.

Increasing demand for high-speed internet is likely to act as a catalyst for internet connection demand. It is expected to bolster the demand for an advanced internet ecosystem, which comprises cables, connectors, fiber optics collimating lenses, and other components.

Don't pay for what you don't need

Customize your report by selecting specific countries or regions and save 30%!

What are the Prominent Factors Boosting the Fiber Optic Collimating Lens Market?

Increasing Awareness about the Benefits Offered by Aspheric Lenses over Conventional Lenses to Escalate the Market Growth

The advantages of using aspheric lenses over conventional spherical lenses in optic systems are the key factors driving the market during the forecast period. Aspheric lenses are used to eliminate spherical aberrations in a wide sphere of applications. These lenses are uniquely shaped which allows them to deliver enhanced optical performance against the traditional spherical lenses.

The surging investment in fiber optics is expected to boost the demand for fiber components, including fiber collimating lenses. For instance, broadband providers in North America are expected to invest more than US$ 60 billion in fiber-to-the-home (FTTH) projects in the coming five years. Sectors such as healthcare, BFSI, and telecommunications are likely to grow in demand for fiber optic collimating lenses.

The advent of 5G networks is anticipated to offer new revenue avenues for players offering fiber-optic collimating lenses. Various players are slow to cash in on market opportunities for 5G networks. AT&T Intellectual Property has rolled out a 400-gigabit network connection between Dallas and Atlanta to cater to the AR, gaming, and other 5G needs of consumers. In another instance, Verizon Communications introduced a long-haul data session by offering 800 Gbps across the long-distance fiber.

What are the Limitations to the Fiber Optic Collimating Lens Market?

The manufacturing processes of aspheric lenses have gone through various developments over the past few years. The manufacturing cost of aspheric lenses is high than that of traditional spherical lenses. In the aspheric lenses case, the lenses are not defined by a single radius curvature. That is why smack sub-apertures are used with varying radii of curvature at different points along with the surface. It creates a need for different manufacturing techniques to address these sub-apertures in various ways, as the usage of a single large tool is not suitable.

Magnetorheological finishing (MRF) and computer numerical control (CNC), grinding, and polishing are mostly used to offer control over the surface during manufacturing. CNC techniques are expensive since these techniques are developed for metal production applications. That is why, high material and manufacturing costs are impeding the market growth of the aspheric lens market, which is expected to affect the growth of the fiber optics collimating lens market.

Sudip Saha
Sudip Saha

Principal Consultant

Talk to Analyst

Find your sweet spots for generating winning opportunities in this market.

What is the Prevailing Opportunity in the Fiber Optic Collimating Lens Market?

The logistics and manufacturing sectors are likely to be benefitted from fiber optics owing to their operations and services, which are dependent on high-speed bandwidth. The sector demands heavy data for purposes such as several products manufactured, and raw materials received, among others.

Fibers offer scalability, therefore, during rapid expansion, the organization can access the near-unlimited bandwidth easily, without incurring additional monthly fees. Besides, reliability, network latency, and long-term costs are other benefits. Fibers are a highly secured network and it is privately owned and operated by the lease owners. Therefore, it is not easy for an external entity to track or record the data and information being transmitted through the fiber.

What are the Challenges Faced by the Fiber Optic Collimating Lens Market?

The usage of traditional internet wires is projected to be a significant challenge to the market. Traditional internet wires are made up of copper, which is a cheap and widely used component for network devices’ connections. Owing to the high initial cost of deploying fiber optics in regions such as Latin America and Africa, these regions are yet not completely fiber-based and demand aggressive investments to transform the internet ecosystem. However, with the rising advancements in networking infrastructure, the deployment of fiber cables is expected to grow in the coming time.

Attributes Details
Fiber Optic Collimating Lens Market Share (2022) US$ 677.4 million
Fiber Optic Collimating Lens Market Share (2023) US$ 757.3 million
Fiber Optic Collimating Lens Market Share (2033) US$ 2,394.5 million
Fiber Optic Collimating Lens Market Share (2023 to 2033) 11.6%
Fiber Optic Collimating Lens Market Attraction Increasing global demand for computer networking propels the need for free-space communication, thereby, bolstering the fiber optics collimating lenses market.

Get the data you need at a Fraction of the cost

Personalize your report by choosing insights you need
and save 40%!

The Fiber Optic Collimating Lens Market Historical Analysis (2018 to 2022) Vs. Forecast Outlook (2023 to 2033)

The global fiber optic collimating lens market size expanded at a CAGR of 9.9% from 2018 to 2022. In 2018, the global market size stood at US$ 357.8 million. In the following years, the market experienced significant growth, accounting for US$ 677.4 million in 2022.

Internet users have significantly increased in recent years, widening the demand for high-speed internet. To address the rising demand for high-speed internet access in the residential, business, and industrial sectors, fiber optic networks are being widely implemented. For these networks to provide the best data transmission over long distances, collimating lenses are necessary to accurately regulate and shape the light beams within the optical fibers.

Beyond telecommunications, a wide number of industries, including the medical, aerospace, defense, sensing, and industrial sectors, are discovering uses for fiber optic technology. For accurate measurements, laser-based therapies, remote sensing, and other uses, collimating lenses are frequently needed in these applications. The growing demand from increasing end-use industries is likely to bolster market growth in the coming years.

Category-wise Insights

What is the Segmentation Outlook for the Fiber Optic Collimating Lens Market?

The global fiber optic collimating lens market can be segmented into type, mode, wavelength, application, and lens type.

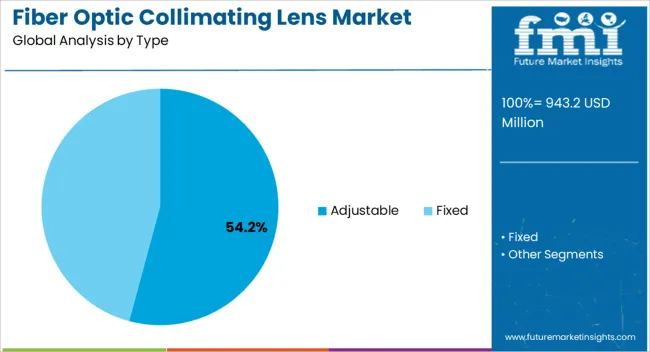
Based on type, the global fiber optic collimating lens market can be segmented into fixed and adjustable. According to the analysis, the fixed segment is anticipated to drive the market during the forecast period. The segment is likely to witness a 10.7% growth rate during the forecast period. In 2022, the fixed type segment captured 62.4% of the share in the global market.

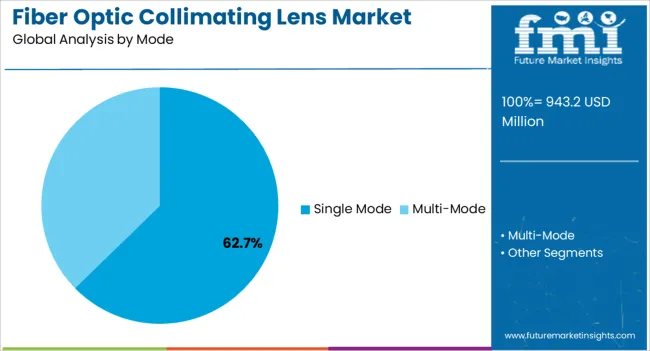
Based on mode, the global fiber optic collimating lens market can be segmented into single-mode and multi-mode. According to the estimations, the single-mode segment is anticipated to expand at a CAGR of 11.3% during the forecast period.

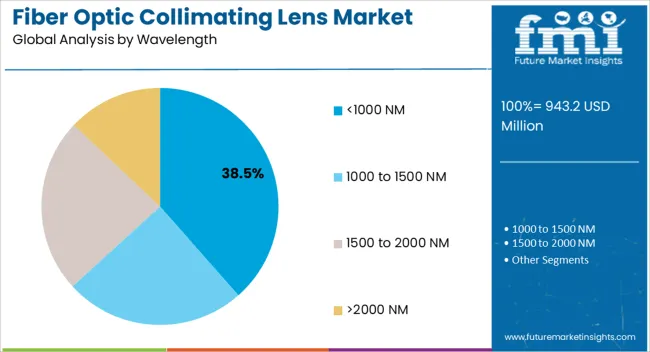
Based on wavelength, the global fiber optic collimating lens market can be segmented into <1000 NM, 1000-1500 NM, 1500-2000 NM, and>2000 NM. As per the analysis, the 1000-1500 NM wavelength is anticipated to dominate the market during the forecast period.

The expansion of the market can be attributed to its growing demand in various end-use applications such as light & display and spectroscopy, among others. The <1000 NM wavelength segment is predicted to gain swift growth during the forecast period. In 2022, the <1000 NM segment garnered a 46.2% share of the global market.

Based on application, the global fiber optic collimating lens market can be segmented into communication, medical diagnostic & imaging, lasers and detectors, metrology, spectroscopy and microscopy, and others. Among all, the communication segment is projected to garner growth in the market. The growth of the segment can be attributed to the increasing demand for digitalization and the rising need for being connected.

Based on lens type, the global fiber optic collimating lens market can be segmented into GRIN Lenses, Aspheric lenses, and others. Between the two, the aspheric lenses segment is expected to lead the market during the forecast period. The expansion of the segment can be attributed to the benefits offered by aspheric lenses as compared to the other lenses.
Country-wise Insights

What is the Regional Demand Analysis in the Global Fiber Optic Collimating Lens Market?

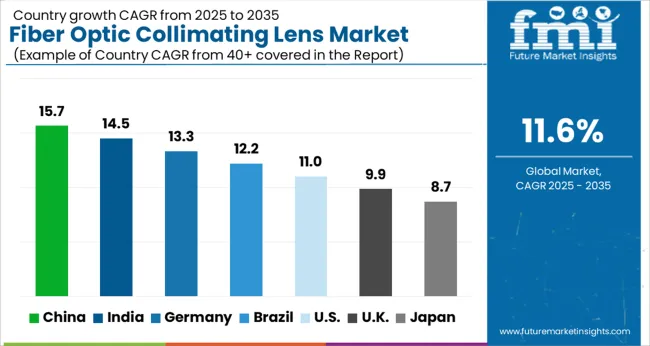
The market in North America is expected to secure a lion’s share during the forecast period. According to FMI’s analysis, the market in the United States is expected to secure US$ 660.1 million while recording a CAGR of 11.3% from 2023 to 2033. In 2022, the United States captured a 15.6% share of the global market.

The demand for a high-capacity network has motivated organizations to adopt optical fiber networks for mobile and fixed telephony systems. According to the Fiber Broadband Association and RVA, in 2018, fiber was deployed in nearly 41 million homes in the United States and has witnessed a 17% growth in fiber deployment since 2017.

The market in the United Kingdom is expected to secure US$ 90.9 million while expanding at a CAGR of 10.7% during the forecast period. In 2022, the United Kingdom captured a 10.2% share of the global market. The growth of the market can be credited to the increasing demand for high bandwidth for communication and data services. The FTTH Council Europe is taking efforts to accelerate the availability of fiber-based high-speed networks to businesses and consumers.

The market in Asia Pacific is expected to gain swift growth during the forecast period. China is anticipated to account for the dominant market share. The analysis reveals that China is expected to garner US$ 151.9 million and witness a CAGR of 11.1% during the forecast period. In 2022, China captured an 11.3% share of the global market.

The telecom operators in China have installed fiber in almost every telecom application from intra-city to mobile cellular systems. Besides, the advent of 5G is anticipated to increase the demand for fiber in the coming time in China. China’s large-scale industrialization and the expanding populace along with rising per capita income are projected to play a salient role in the assessment period.

Other notable Asia Pacific markets include Japan and South Korea. Japan is likely to secure US$ 127.7 million and a 10.9% growth rate, while South Korea is estimated at US$ 81.2 million, recording a 10.3% expansion rate. In 2022, Japan occupied a 7.8% share of the global market.

Countries CAGR Share in the Global Market (2022)
The United States 15.6%
The United Kingdom 10.2%
China 11.3%
Japan 7.8%

Competitive Landscape

What is the Competition Status in the Global Fiber Optic Collimating Lens Market?

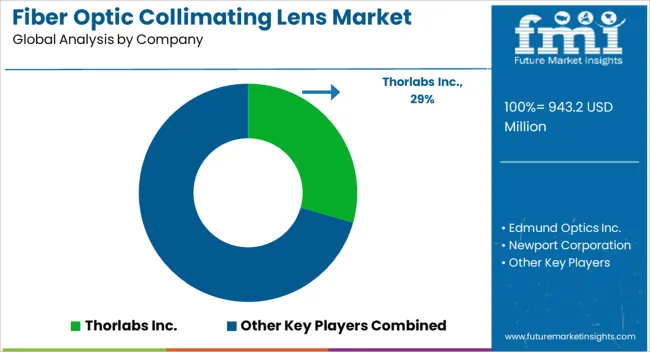
Players in the market adopt various strategies to secure a forefront position in the market. Key players in the global fiber optic collimating lens market include IPG Photonics Corporation, AMS Technologies, Fabrinet, Coherent, Thorlabs, and others. The key players emphasize technological developments, new product launches, mergers, acquisitions, and other strategies to maximize their growth in the global market.

Recent Developments Observed by FMI:

  • In August 2021, SABIC launched a new PEI resin that is suited for optical transceiver collimator lenses and ensures alignment with single-mode fibers. SABIC is promoting the use of single-mode fiber optic, a developing data center infrastructure technology enabling swift transmission of substantial amounts of data across great distances.
  • In April 2021, Thorlabs released a new passively Q-Switched laser producing 500 PS pulses centered at 1030 nm. The microjoule-level pulse energies produced at kHz repetition rates enable multiple applications, LIDAR, laser-induced breakdown spectroscope, and material processing.

Key Players Operating in the Global Market

  • IPG Photonics Corporation
  • AMS Technologies
  • Fabrinet
  • Coherent
  • Thorlabs

Scope of the Report

Attribute Details
Forecast Period 2023 to 2033
Historical Data Available for 2018 to 2022
Market Analysis US$ million for Value
Key Regions Covered North America; Latin America; Europe; East Asia; South Asia; Oceania; The Middle East & Africa (MEA)
Key Countries Covered The United States, Canada, Germany, The United Kingdom, Nordic, Russia, BENELUX, Poland, France, Spain, Italy, Czech Republic, Hungary, Rest of EMEAI, Brazil, Peru, Argentina, Mexico, South Africa, Northern Africa, GCC Countries, China, Japan, South Korea, India, ASIAN, Thailand, Malaysia, Indonesia, Australia, New Zealand, Others
Key Segments Covered Type, Mode, Wavelength, Application, Lens Type, Region
Report Coverage Market Forecast, Company Share Analysis, Competition Intelligence, Trend Analysis, Market Dynamics and Challenges, and Strategic Growth Initiatives

Fiber Optic Collimating Lens Market Segmentation

By Type:

  • Adjustable
  • Fixed

By Mode:

  • Single Mode
  • Multi-mode

By Wavelength:

  • <1000 NM
  • 1000 to 1500 NM
  • 1500 to 2000 NM
  • >2000 NM

By Application:

  • Communication
  • Medical Diagnostic & Imaging
  • Lasers and Detectors
  • Metrology
  • Spectroscopy and Microscopy
  • Other Applications

By Lens Type:

  • Aspheric
  • GRIN
  • Other

By Region:

  • North America
  • Latin America
  • Europe
  • East Asia
  • South Asia
  • Oceania
  • The Middle East & Africa (MEA)

Frequently Asked Questions

What was the Global Fiber Optic Collimating Lens Market Size in 2022?

The market was valued at US$ 677.4 million.

What Drives Sales of the Market?

Growing demand for stable, high-speed scalable communication drives sales.

What is the Challenging Factor of the Market?

The usage of traditional internet wires poses a significant challenge to the market.

Who are the Key Players in the Fiber Optic Collimating Lens Market?

Fabrinet, Coherent, and Thorlabs are the key players.

What is the Growth Outlook for the United States?

The United States market flourished at a CAGR of 11.3% from 2023 to 2033.

Table of Content

1. Executive Summary

    1.1. Global Market Outlook

    1.2. Demand-side Trends

    1.3. Supply-side Trends

    1.4. Technology Roadmap Analysis

    1.5. Analysis and Recommendations

2. Market Overview

    2.1. Market Coverage / Taxonomy

    2.2. Market Definition / Scope / Limitations

3. Market Background

    3.1. Market Dynamics

        3.1.1. Drivers

        3.1.2. Restraints

        3.1.3. Opportunity

        3.1.4. Trends

    3.2. Scenario Forecast

        3.2.1. Demand in Optimistic Scenario

        3.2.2. Demand in Likely Scenario

        3.2.3. Demand in Conservative Scenario

    3.3. Opportunity Map Analysis

    3.4. Product Life Cycle Analysis

    3.5. Supply Chain Analysis

        3.5.1. Supply Side Participants and their Roles

            3.5.1.1. Producers

            3.5.1.2. Mid-Level Participants (Traders/ Agents/ Brokers)

            3.5.1.3. Wholesalers and Distributors

        3.5.2. Value Added and Value Created at Node in the Supply Chain

        3.5.3. List of Raw Material Suppliers

        3.5.4. List of Existing and Potential Buyer’s

    3.6. Investment Feasibility Matrix

    3.7. Value Chain Analysis

        3.7.1. Profit Margin Analysis

        3.7.2. Wholesalers and Distributors

        3.7.3. Retailers

    3.8. PESTLE and Porter’s Analysis

    3.9. Regulatory Landscape

        3.9.1. By Key Regions

        3.9.2. By Key Countries

    3.10. Regional Parent Market Outlook

    3.11. Production and Consumption Statistics

    3.12. Import and Export Statistics

4. Global Market Analysis 2018 to 2022 and Forecast, 2023 to 2033

    4.1. Historical Market Size Value (US$ Million) & Volume (Units) Analysis, 2018 to 2022

    4.2. Current and Future Market Size Value (US$ Million) & Volume (Units) Projections, 2023 to 2033

        4.2.1. Y-o-Y Growth Trend Analysis

        4.2.2. Absolute $ Opportunity Analysis

5. Global Market Analysis 2018 to 2022 and Forecast 2023 to 2033, By Type

    5.1. Introduction / Key Findings

    5.2. Historical Market Size Value (US$ Million) & Volume (Units) Analysis By Type, 2018 to 2022

    5.3. Current and Future Market Size Value (US$ Million) & Volume (Units) Analysis and Forecast By Type, 2023 to 2033

        5.3.1. Adjustable

        5.3.2. Fixed

    5.4. Y-o-Y Growth Trend Analysis By Type, 2018 to 2022

    5.5. Absolute $ Opportunity Analysis By Type, 2023 to 2033

6. Global Market Analysis 2018 to 2022 and Forecast 2023 to 2033, By Mode

    6.1. Introduction / Key Findings

    6.2. Historical Market Size Value (US$ Million) & Volume (Units) Analysis By Mode, 2018 to 2022

    6.3. Current and Future Market Size Value (US$ Million) & Volume (Units) Analysis and Forecast By Mode, 2023 to 2033

        6.3.1. Single Mode

        6.3.2. Multi-Mode

    6.4. Y-o-Y Growth Trend Analysis By Mode, 2018 to 2022

    6.5. Absolute $ Opportunity Analysis By Mode, 2023 to 2033

7. Global Market Analysis 2018 to 2022 and Forecast 2023 to 2033, By Wavelength

    7.1. Introduction / Key Findings

    7.2. Historical Market Size Value (US$ Million) & Volume (Units) Analysis By Wavelength, 2018 to 2022

    7.3. Current and Future Market Size Value (US$ Million) & Volume (Units) Analysis and Forecast By Wavelength, 2023 to 2033

        7.3.1. <1000 NM

        7.3.2. 1000-1500 NM

        7.3.3. 1500-2000 NM

        7.3.4. >2000 NM

    7.4. Y-o-Y Growth Trend Analysis By Wavelength, 2018 to 2022

    7.5. Absolute $ Opportunity Analysis By Wavelength, 2023 to 2033

8. Global Market Analysis 2018 to 2022 and Forecast 2023 to 2033, By Application

    8.1. Introduction / Key Findings

    8.2. Historical Market Size Value (US$ Million) & Volume (Units) Analysis By Application, 2018 to 2022

    8.3. Current and Future Market Size Value (US$ Million) & Volume (Units) Analysis and Forecast By Application, 2023 to 2033

        8.3.1. Communication

        8.3.2. Medical Diagnostic & Imaging

        8.3.3. Lasers and Detectors

        8.3.4. Metrology

        8.3.5. Spectroscopy and Microscopy

        8.3.6. Others

    8.4. Y-o-Y Growth Trend Analysis By Application, 2018 to 2022

    8.5. Absolute $ Opportunity Analysis By Application, 2023 to 2033

9. Global Market Analysis 2018 to 2022 and Forecast 2023 to 2033, By Lens Type

    9.1. Introduction / Key Findings

    9.2. Historical Market Size Value (US$ Million) & Volume (Units) Analysis By Lens Type, 2018 to 2022

    9.3. Current and Future Market Size Value (US$ Million) & Volume (Units) Analysis and Forecast By Lens Type, 2023 to 2033

        9.3.1. Aspheric

        9.3.2. GRIN

        9.3.3. Others

    9.4. Y-o-Y Growth Trend Analysis By Lens Type, 2018 to 2022

    9.5. Absolute $ Opportunity Analysis By Lens Type, 2023 to 2033

10. Global Market Analysis 2018 to 2022 and Forecast 2023 to 2033, By Region

    10.1. Introduction

    10.2. Historical Market Size Value (US$ Million) & Volume (Units) Analysis By Region, 2018 to 2022

    10.3. Current Market Size Value (US$ Million) & Volume (Units) Analysis and Forecast By Region, 2023 to 2033

        10.3.1. North America

        10.3.2. Latin America

        10.3.3. Europe

        10.3.4. Asia Pacific

        10.3.5. MEA

    10.4. Market Attractiveness Analysis By Region

11. North America Market Analysis 2018 to 2022 and Forecast 2023 to 2033, By Country

    11.1. Historical Market Size Value (US$ Million) & Volume (Units) Trend Analysis By Market Taxonomy, 2018 to 2022

    11.2. Market Size Value (US$ Million) & Volume (Units) Forecast By Market Taxonomy, 2023 to 2033

        11.2.1. By Country

            11.2.1.1. U.S.

            11.2.1.2. Canada

        11.2.2. By Type

        11.2.3. By Mode

        11.2.4. By Wavelength

        11.2.5. By Application

        11.2.6. By Lens Type

    11.3. Market Attractiveness Analysis

        11.3.1. By Country

        11.3.2. By Type

        11.3.3. By Mode

        11.3.4. By Wavelength

        11.3.5. By Application

        11.3.6. By Lens Type

    11.4. Key Takeaways

12. Latin America Market Analysis 2018 to 2022 and Forecast 2023 to 2033, By Country

    12.1. Historical Market Size Value (US$ Million) & Volume (Units) Trend Analysis By Market Taxonomy, 2018 to 2022

    12.2. Market Size Value (US$ Million) & Volume (Units) Forecast By Market Taxonomy, 2023 to 2033

        12.2.1. By Country

            12.2.1.1. Brazil

            12.2.1.2. Mexico

            12.2.1.3. Rest of Latin America

        12.2.2. By Type

        12.2.3. By Mode

        12.2.4. By Wavelength

        12.2.5. By Application

        12.2.6. By Lens Type

    12.3. Market Attractiveness Analysis

        12.3.1. By Country

        12.3.2. By Type

        12.3.3. By Mode

        12.3.4. By Wavelength

        12.3.5. By Application

        12.3.6. By Lens Type

    12.4. Key Takeaways

13. Europe Market Analysis 2018 to 2022 and Forecast 2023 to 2033, By Country

    13.1. Historical Market Size Value (US$ Million) & Volume (Units) Trend Analysis By Market Taxonomy, 2018 to 2022

    13.2. Market Size Value (US$ Million) & Volume (Units) Forecast By Market Taxonomy, 2023 to 2033

        13.2.1. By Country

            13.2.1.1. Germany

            13.2.1.2. U.K.

            13.2.1.3. France

            13.2.1.4. Spain

            13.2.1.5. Italy

            13.2.1.6. Rest of Europe

        13.2.2. By Type

        13.2.3. By Mode

        13.2.4. By Wavelength

        13.2.5. By Application

        13.2.6. By Lens Type

    13.3. Market Attractiveness Analysis

        13.3.1. By Country

        13.3.2. By Type

        13.3.3. By Mode

        13.3.4. By Wavelength

        13.3.5. By Application

        13.3.6. By Lens Type

    13.4. Key Takeaways

14. Asia Pacific Market Analysis 2018 to 2022 and Forecast 2023 to 2033, By Country

    14.1. Historical Market Size Value (US$ Million) & Volume (Units) Trend Analysis By Market Taxonomy, 2018 to 2022

    14.2. Market Size Value (US$ Million) & Volume (Units) Forecast By Market Taxonomy, 2023 to 2033

        14.2.1. By Country

            14.2.1.1. China

            14.2.1.2. Japan

            14.2.1.3. South Korea

            14.2.1.4. Singapore

            14.2.1.5. Thailand

            14.2.1.6. Indonesia

            14.2.1.7. Australia

            14.2.1.8. New Zealand

            14.2.1.9. Rest of Asia Pacific

        14.2.2. By Type

        14.2.3. By Mode

        14.2.4. By Wavelength

        14.2.5. By Application

        14.2.6. By Lens Type

    14.3. Market Attractiveness Analysis

        14.3.1. By Country

        14.3.2. By Type

        14.3.3. By Mode

        14.3.4. By Wavelength

        14.3.5. By Application

        14.3.6. By Lens Type

    14.4. Key Takeaways

15. MEA Market Analysis 2018 to 2022 and Forecast 2023 to 2033, By Country

    15.1. Historical Market Size Value (US$ Million) & Volume (Units) Trend Analysis By Market Taxonomy, 2018 to 2022

    15.2. Market Size Value (US$ Million) & Volume (Units) Forecast By Market Taxonomy, 2023 to 2033

        15.2.1. By Country

            15.2.1.1. GCC Countries

            15.2.1.2. South Africa

            15.2.1.3. Israel

            15.2.1.4. Rest of MEA

        15.2.2. By Type

        15.2.3. By Mode

        15.2.4. By Wavelength

        15.2.5. By Application

        15.2.6. By Lens Type

    15.3. Market Attractiveness Analysis

        15.3.1. By Country

        15.3.2. By Type

        15.3.3. By Mode

        15.3.4. By Wavelength

        15.3.5. By Application

        15.3.6. By Lens Type

    15.4. Key Takeaways

16. Key Countries Market Analysis

    16.1. U.S.

        16.1.1. Pricing Analysis

        16.1.2. Market Share Analysis, 2022

            16.1.2.1. By Type

            16.1.2.2. By Mode

            16.1.2.3. By Wavelength

            16.1.2.4. By Application

            16.1.2.5. By Lens Type

    16.2. Canada

        16.2.1. Pricing Analysis

        16.2.2. Market Share Analysis, 2022

            16.2.2.1. By Type

            16.2.2.2. By Mode

            16.2.2.3. By Wavelength

            16.2.2.4. By Application

            16.2.2.5. By Lens Type

    16.3. Brazil

        16.3.1. Pricing Analysis

        16.3.2. Market Share Analysis, 2022

            16.3.2.1. By Type

            16.3.2.2. By Mode

            16.3.2.3. By Wavelength

            16.3.2.4. By Application

            16.3.2.5. By Lens Type

    16.4. Mexico

        16.4.1. Pricing Analysis

        16.4.2. Market Share Analysis, 2022

            16.4.2.1. By Type

            16.4.2.2. By Mode

            16.4.2.3. By Wavelength

            16.4.2.4. By Application

            16.4.2.5. By Lens Type

    16.5. Germany

        16.5.1. Pricing Analysis

        16.5.2. Market Share Analysis, 2022

            16.5.2.1. By Type

            16.5.2.2. By Mode

            16.5.2.3. By Wavelength

            16.5.2.4. By Application

            16.5.2.5. By Lens Type

    16.6. U.K.

        16.6.1. Pricing Analysis

        16.6.2. Market Share Analysis, 2022

            16.6.2.1. By Type

            16.6.2.2. By Mode

            16.6.2.3. By Wavelength

            16.6.2.4. By Application

            16.6.2.5. By Lens Type

    16.7. France

        16.7.1. Pricing Analysis

        16.7.2. Market Share Analysis, 2022

            16.7.2.1. By Type

            16.7.2.2. By Mode

            16.7.2.3. By Wavelength

            16.7.2.4. By Application

            16.7.2.5. By Lens Type

    16.8. Spain

        16.8.1. Pricing Analysis

        16.8.2. Market Share Analysis, 2022

            16.8.2.1. By Type

            16.8.2.2. By Mode

            16.8.2.3. By Wavelength

            16.8.2.4. By Application

            16.8.2.5. By Lens Type

    16.9. Italy

        16.9.1. Pricing Analysis

        16.9.2. Market Share Analysis, 2022

            16.9.2.1. By Type

            16.9.2.2. By Mode

            16.9.2.3. By Wavelength

            16.9.2.4. By Application

            16.9.2.5. By Lens Type

    16.10. China

        16.10.1. Pricing Analysis

        16.10.2. Market Share Analysis, 2022

            16.10.2.1. By Type

            16.10.2.2. By Mode

            16.10.2.3. By Wavelength

            16.10.2.4. By Application

            16.10.2.5. By Lens Type

    16.11. Japan

        16.11.1. Pricing Analysis

        16.11.2. Market Share Analysis, 2022

            16.11.2.1. By Type

            16.11.2.2. By Mode

            16.11.2.3. By Wavelength

            16.11.2.4. By Application

            16.11.2.5. By Lens Type

    16.12. South Korea

        16.12.1. Pricing Analysis

        16.12.2. Market Share Analysis, 2022

            16.12.2.1. By Type

            16.12.2.2. By Mode

            16.12.2.3. By Wavelength

            16.12.2.4. By Application

            16.12.2.5. By Lens Type

    16.13. Singapore

        16.13.1. Pricing Analysis

        16.13.2. Market Share Analysis, 2022

            16.13.2.1. By Type

            16.13.2.2. By Mode

            16.13.2.3. By Wavelength

            16.13.2.4. By Application

            16.13.2.5. By Lens Type

    16.14. Thailand

        16.14.1. Pricing Analysis

        16.14.2. Market Share Analysis, 2022

            16.14.2.1. By Type

            16.14.2.2. By Mode

            16.14.2.3. By Wavelength

            16.14.2.4. By Application

            16.14.2.5. By Lens Type

    16.15. Indonesia

        16.15.1. Pricing Analysis

        16.15.2. Market Share Analysis, 2022

            16.15.2.1. By Type

            16.15.2.2. By Mode

            16.15.2.3. By Wavelength

            16.15.2.4. By Application

            16.15.2.5. By Lens Type

    16.16. Australia

        16.16.1. Pricing Analysis

        16.16.2. Market Share Analysis, 2022

            16.16.2.1. By Type

            16.16.2.2. By Mode

            16.16.2.3. By Wavelength

            16.16.2.4. By Application

            16.16.2.5. By Lens Type

    16.17. New Zealand

        16.17.1. Pricing Analysis

        16.17.2. Market Share Analysis, 2022

            16.17.2.1. By Type

            16.17.2.2. By Mode

            16.17.2.3. By Wavelength

            16.17.2.4. By Application

            16.17.2.5. By Lens Type

    16.18. GCC Countries

        16.18.1. Pricing Analysis

        16.18.2. Market Share Analysis, 2022

            16.18.2.1. By Type

            16.18.2.2. By Mode

            16.18.2.3. By Wavelength

            16.18.2.4. By Application

            16.18.2.5. By Lens Type

    16.19. South Africa

        16.19.1. Pricing Analysis

        16.19.2. Market Share Analysis, 2022

            16.19.2.1. By Type

            16.19.2.2. By Mode

            16.19.2.3. By Wavelength

            16.19.2.4. By Application

            16.19.2.5. By Lens Type

    16.20. Israel

        16.20.1. Pricing Analysis

        16.20.2. Market Share Analysis, 2022

            16.20.2.1. By Type

            16.20.2.2. By Mode

            16.20.2.3. By Wavelength

            16.20.2.4. By Application

            16.20.2.5. By Lens Type

17. Market Structure Analysis

    17.1. Competition Dashboard

    17.2. Competition Benchmarking

    17.3. Market Share Analysis of Top Players

        17.3.1. By Regional

        17.3.2. By Type

        17.3.3. By Mode

        17.3.4. By Wavelength

        17.3.5. By Application

        17.3.6. By Lens Type

18. Competition Analysis

    18.1. Competition Deep Dive

        18.1.1. Thorlabs Inc.

            18.1.1.1. Overview

            18.1.1.2. Product Portfolio

            18.1.1.3. Profitability by Market Segments

            18.1.1.4. Sales Footprint

            18.1.1.5. Strategy Overview

                18.1.1.5.1. Marketing Strategy

                18.1.1.5.2. Product Strategy

                18.1.1.5.3. Channel Strategy

        18.1.2. Edmund Optics Inc.

            18.1.2.1. Overview

            18.1.2.2. Product Portfolio

            18.1.2.3. Profitability by Market Segments

            18.1.2.4. Sales Footprint

            18.1.2.5. Strategy Overview

                18.1.2.5.1. Marketing Strategy

                18.1.2.5.2. Product Strategy

                18.1.2.5.3. Channel Strategy

        18.1.3. Newport Corporation

            18.1.3.1. Overview

            18.1.3.2. Product Portfolio

            18.1.3.3. Profitability by Market Segments

            18.1.3.4. Sales Footprint

            18.1.3.5. Strategy Overview

                18.1.3.5.1. Marketing Strategy

                18.1.3.5.2. Product Strategy

                18.1.3.5.3. Channel Strategy

        18.1.4. OZ Optics Ltd.

            18.1.4.1. Overview

            18.1.4.2. Product Portfolio

            18.1.4.3. Profitability by Market Segments

            18.1.4.4. Sales Footprint

            18.1.4.5. Strategy Overview

                18.1.4.5.1. Marketing Strategy

                18.1.4.5.2. Product Strategy

                18.1.4.5.3. Channel Strategy

        18.1.5. Altechna Co. Ltd.

            18.1.5.1. Overview

            18.1.5.2. Product Portfolio

            18.1.5.3. Profitability by Market Segments

            18.1.5.4. Sales Footprint

            18.1.5.5. Strategy Overview

                18.1.5.5.1. Marketing Strategy

                18.1.5.5.2. Product Strategy

                18.1.5.5.3. Channel Strategy

        18.1.6. Micro Laser Systems Inc.

            18.1.6.1. Overview

            18.1.6.2. Product Portfolio

            18.1.6.3. Profitability by Market Segments

            18.1.6.4. Sales Footprint

            18.1.6.5. Strategy Overview

                18.1.6.5.1. Marketing Strategy

                18.1.6.5.2. Product Strategy

                18.1.6.5.3. Channel Strategy

        18.1.7. LightPath Technologies Inc.

            18.1.7.1. Overview

            18.1.7.2. Product Portfolio

            18.1.7.3. Profitability by Market Segments

            18.1.7.4. Sales Footprint

            18.1.7.5. Strategy Overview

                18.1.7.5.1. Marketing Strategy

                18.1.7.5.2. Product Strategy

                18.1.7.5.3. Channel Strategy

        18.1.8. Sill Optics GmbH & Co. KG

            18.1.8.1. Overview

            18.1.8.2. Product Portfolio

            18.1.8.3. Profitability by Market Segments

            18.1.8.4. Sales Footprint

            18.1.8.5. Strategy Overview

                18.1.8.5.1. Marketing Strategy

                18.1.8.5.2. Product Strategy

                18.1.8.5.3. Channel Strategy

        18.1.9. A·P·E Angewandte Physik & Elektronik GmbH

            18.1.9.1. Overview

            18.1.9.2. Product Portfolio

            18.1.9.3. Profitability by Market Segments

            18.1.9.4. Sales Footprint

            18.1.9.5. Strategy Overview

                18.1.9.5.1. Marketing Strategy

                18.1.9.5.2. Product Strategy

                18.1.9.5.3. Channel Strategy

        18.1.10. OptoSigma Corporation

            18.1.10.1. Overview

            18.1.10.2. Product Portfolio

            18.1.10.3. Profitability by Market Segments

            18.1.10.4. Sales Footprint

            18.1.10.5. Strategy Overview

                18.1.10.5.1. Marketing Strategy

                18.1.10.5.2. Product Strategy

                18.1.10.5.3. Channel Strategy

19. Assumptions & Acronyms Used

20. Research Methodology

Recommendations

Technology

Fiber Optic Connectors Market

October 2024

REP-GB-5019

312 pages

Technology

Distributed Fiber Optic Sensor Market

August 2023

REP-GB-623

315 pages

Explore Technology Insights

View Reports
Future Market Insights

Fiber Optic Collimating Lens Market

Schedule a Call