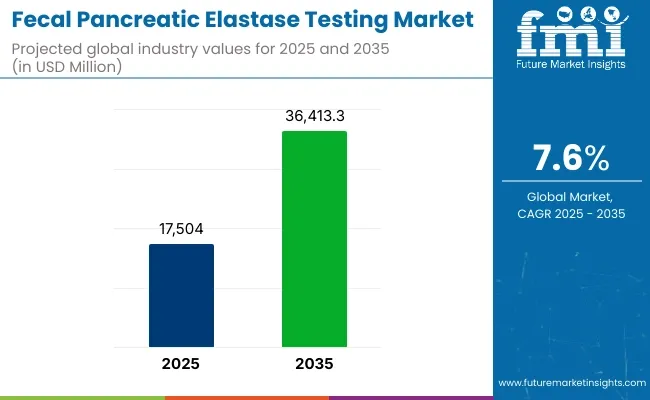
The global fecal pancreatic elastase testing market was valued at USD 17,504.0 million in 2025 and is projected to be elevated to USD 36,413.3 million by 2035, registering a CAGR of 7.6% over the forecast period. Growth has been driven by the increasing incidence of exocrine pancreatic insufficiency and the rising preference for non-invasive stool-based diagnostics.
Enhanced accessibility to outpatient diagnostic services has been facilitated, and greater clinical focus has been placed on early-stage pancreatic screening. Regulatory advancements, including stricter adherence to the EU IVDR, have been enforced, improving diagnostic accuracy and clinical reliability. Market expansion has been supported by continuous product innovation and strategic collaborations, which have been initiated by leading diagnostic manufacturers to address evolving clinical demands and improve global testing capacity.

| Metric | Value |
|---|---|
| Market Size in 2025 | USD 17,504.0 million |
| Projected Market Size in 2035 | USD 36,413.3 million |
| CAGR (2025 to 2035) | 7.6% |
In 2025, the Fecal Pancreatic Elastase Testing Market has been significantly influenced by innovation-driven strategies adopted by leading manufacturers such as DiaSorin, ScheBo Biotech AG, DRG Instruments GmbH, BÜHLMANN Laboratories AG, Immundiagnostik AG, and others.
In May 2025, the Pancreatic Elastase Turbilatex® Combo assay was validated by CerTest Biotec S.L. for use on the Cobas c501 (Roche) analyzer, enabling high-precision quantitative detection of pancreatic elastase in stool samples through a turbidimetric method. Market growth has been driven by rising global cases of exocrine pancreatic insufficiency, improved reimbursement structures, and increased awareness of early-stage pancreatic function screening. The dual momentum of technological advancement and supply chain optimization has positioned the market for sustained growth.
The fecal pancreatic elastase testing market has been shaped by distinct regional dynamics across North America and Europe. In North America, increased test volumes have been driven by the integration of ELISA-based assays into gastroenterology workflows, while the expansion of decentralized diagnostic services has been supported by digital logistics solutions.
Adoption in rural and integrated care settings has been accelerated through investments in outpatient diagnostic infrastructure and the inclusion of GI panels under payer-supported programs. In Europe, market growth has been reinforced by the enforcement of IVDR regulations, through which test validations and clinical transparency have been enhanced.
The use of home-based stool collection kits and regional screening initiatives has been promoted by national health systems, with further adoption enabled by reimbursement schemes and community-based digestive health programs.
In 2025, a revenue share of 99.6% was held by the Fecal Pancreatic Elastase ELISA Kits segment. This dominance was attributed to the high diagnostic precision and reproducibility offered by ELISA-based assays.
Greater reliability in detecting exocrine pancreatic insufficiency (EPI) was achieved through quantitative measurement of fecal elastase levels. The kits were widely integrated into laboratory workflows due to their compatibility with automated platforms and batch processing. Regulatory approvals and clinical validations had been secured, reinforcing their widespread use
Adoption was further supported by growing demand for non-invasive diagnostics. The segment’s growth was accelerated by increased access to advanced laboratories in developed regions and rising awareness among clinicians regarding early pancreatic dysfunction screening.
A leading revenue share of 38.5% in 2025 was captured by the Hospitals segment. The segment’s expansion was driven by the centralization of diagnostic services and reliance on specialized laboratories for fecal elastase testing.
High test volumes were efficiently managed due to the availability of automation and skilled personnel. Infrastructure investments in private diagnostic chains had been made to meet growing demand from chronic disease cases.

Improved reimbursement policies in developed healthcare systems also contributed to increased testing throughput. Additionally, partnerships between laboratories and care providers had been formed to facilitate access to advanced, accurate, and timely diagnostics.
Challenge
High Cost and Limited Accessibility of Testing
High cost of diagnostic tests restricts access to low-income regions are some of the challenges in the fecal pancreatic elastase testing market. Testing requires specialized laboratory equipment and trained individuals, all of which ramp up testing costs and make it less accessible for patients. In addition, the availability of these tests also varies by region based on healthcare infrastructure.
Therefore, to recover from such a pandemic it is important for companies to invest into affordable testing solutions, point-of-care diagnostics and ramping up cost effectiveness in collaborations with healthcare and insurance providers.
Variability in Test Accuracy and Standardization
Although fecal pancreatic elastase testing is a critical tool for the evaluation of exocrine pancreatic insufficiency (EPI) and other disorders, the assay can vary in performance based on sample collection, sample processing, and sample interpretation differences. Without clear standards between labs, results can be inconsistent, leading to doubt in diagnosis.
To solve for this issue, flow a rile the compalines will need to use for better assay technologies, OECD testing protocols, and AI diagnostic tools to increase the accuracy and reproducibility of these tests.
Opportunity
Growing Prevalence of Pancreatic Disorders and Gastrointestinal Diseases
Chronic pancreatitis, cystic fibrosis, diabetes-related pancreatic dysfunction, and other gastrointestinal disorders are becoming more prevalent, boosting demand for fecal pancreatic elastase testing. The diagnosis should be done early and accurate to manage the disease for planning treatment.
With the growing prevalence of awareness on pancreatic health, the companies looking forward to offer novel diagnosis solutions, rapid test development, and patient-centric testing methods will be positively impacted by the rising demand of the market.
Advancements in Non-Invasive and At-Home Testing Technologies
As non-invasive diagnostic methods become more widespread, the future is bright for fecal pancreatic elastase testing. At-home stool collection kits, diagnostics integrated with telemedicine, and AI-driven interpretation of results are making testing far more accessible and patient-friendly. Next-generation diagnostics are driven by user-friendly, automated, and remote testing solutions that give companies a competitive advantage.
The global fecal pancreatic elastase testing market has seen growth in the past four years (2020 to 2024) owing to the increasing burden of chronic diseases such as chronic pancreatitis and cystic fibrosis, as well as rising awareness regarding pancreatic health and advancements in tests for diagnosing gastrointestinal diseases.
But the high cost of tests and relative lack of access in rural health-care settings and variability in the accuracy of tests continued to be barriers. In turn, companies responded by enhancing test sensitivity, creating automated assay systems and increasing access to diagnostics via digital health platforms.
By 2025 to 2035, the market is predicted to experience AI-driven diagnostics, next-generation biomarker development, and real-time digital testing interpretation advancements. Highlighting concepts such as Test result security with block chaintech, AI predictive analytics, and test kits in smart homes will disrupt the future of this industry.
Moreover, advances in point-of-care diagnostics, telemedicine integration, and personalized medicine approaches will further improve patient outcomes. The next evolution of the fecal pancreatic elastase testing market includes companies which emphasize on automation, digitization, and affordability.

The fecal pancreatic elastase testing market in the United States is driven by etiology, indications, and regional distribution trends, the growing awareness around pancreatic disorders, increasing prevalence of exocrine pancreatic insufficiency (EPI), and the presence of advanced diagnostic laboratories in the region. The rising prevalence of metric stool-based pancreatic function tests are catalyzing growth in the sector.
Increased investments in biomarker profiling and development of innovative enzyme-linked immunoassay (ELISA) platforms and automated testing platforms further enhance market growth. Furthermore, the use of AI-driven diagnostic aids, advanced sample collection methods, and real-time data analysis are making diagnostic tests more accurate.
Less sensitive laboratory procedures are being deployed at industrial scale, and rapid diagnostic solutions with greater sensitivity and specificity are under development in companies. Growing use of fecal pancreatic elastase testing in hospitals, gastroenterology clinics, and research laboratories is fueling demand in the USA market.
| Country | CAGR (2025 to 2035) |
|---|---|
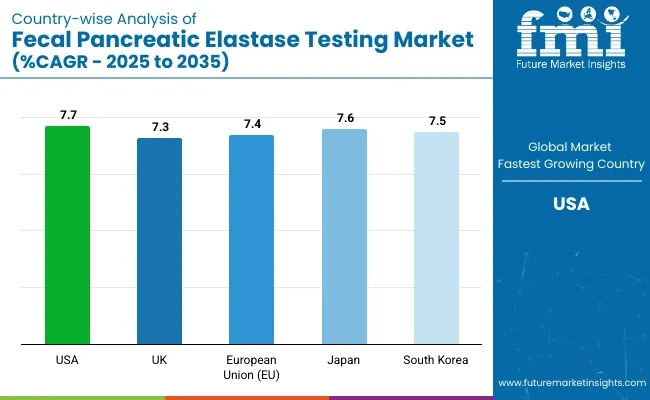
| USA | 7.7% |
Fuelling the growth of the fecal pancreatic elastase market in the UK are the increasing focus on early diagnosis of pancreatic diseases and various gastrointestinal disorders, rising budget allocations for public healthcare expenditure, and growing awareness regarding the impact of lifestyle-related change on gastrointestinal health. Market growth is also aided by the increasing focus on non-invasive methods of diagnosis.
The market growth is encouraged by government programs addressing digestive health screening, as well as progress in laboratory automation and precise biomarker detection Innovations in high-throughput diagnostic platforms, home-based sample collection kits, and AI-driven test interpretation are also making inroads.
To improve the accuracy of diagnostics, organizations are investing in portable fecal elastase testing devices and advanced laboratory workflows. Growing market adoption of pancreatic insufficiency testing in the UK is significantly driven by the demand from diagnostic centers, specialty hospitals and primary care. This has also boosted demand from the integration of digital health technologies with diagnostic testing platforms.
| Country | CAGR (2025 to 2035) |
|---|---|
| UK | 7.3% |
Germany, France and Italy dominate the market for fecal pancreatic elastase tests in Europe, driven by strong healthcare infrastructure, increasing diagnostic research investments, and growing demand for precision medicine in gastrointestinal health.
Rapid market growth is driven by the European Union's emphasis on early disease detection, as well as spending on the research and development of enzyme biomarkers and advanced laboratory automation. Furthermore, the increasing availability of high-sensitivity fecal elastase assays and improved stool sample preservation techniques are continuing to enhance diagnostic efficiency.
The increasing demand for standardized pancreatic function tests in the clinical sector and the growing awareness regarding deficiencies of digestive enzymes are also contributing to the expansion of this market. Rising adoption across the EU is also attributed to increasing insurance coverage for pancreatic insufficiency diagnostics and use of AI for result interpretation. Moreover, partnerships between academic institutions and diagnostic companies are driving innovation in fecal pancreatic elastase testing.
| Region | CAGR (2025 to 2035) |
|---|---|
| European Union (EU) | 7.4% |
The expansion of the Japan fecal pancreatic elastase testing market can be attributed to increasing focus on precision diagnostics in the country, growing prevalence of pancreatic diseases, and rising investments in advanced gastrointestinal screening technologies. Market dynamics: The increasing demand for early diagnosis of pancreatic insufficiency among elderly pulsation is a major factor driving the market growth.
Innovation is being driven by the country’s focus on AI based diagnostic solutions in conjunction with fully automated enzyme immunoassay systems for diagnostic laboratories. Additionally, stringent government regulations controlling the accuracy of clinical laboratory results, along with rising investments in personalized medicine are also driving the players to develop high-precision fecal pancreatic elastase testing kits.
In addition, the growing need for efficient, affordable, and non-invasive pancreatic function tests for use by hospitals, specialty diagnostic centers, and research institutions in Japan is further driving market growth in the country's healthcare industry. In addition, Japan’s investment in smart diagnostics and telemedicine-integrated gastrointestinal testing is paving the way for the non-invasive assessment of the pancreas in the future.
| Country | CAGR (2025 to 2035) |
|---|---|
| Japan | 7.6% |
Fueled by a growing awareness of digestive disorders, increasing adoption of non-invasive diagnostic tools, and strong government initiatives enhancing early detection of gastrointestinal diseases, South Korea is becoming an important fecal pancreatic elastase testing market.
Stricter regulations regarding diagnostic test accuracy and rising investments in molecular diagnostic research act as the key drivers of the market. The government’s emphasis on improving accuracy with enzyme biomarker profiling, automated processing of fecal samples and cloud test result management is also helping improve competitiveness. Rising adoption in gastroenterology clinics, hospitals, and academic research laboratories is expected to drive the demand for high-sensitivity fecal elastase tests, which is anticipated to propel the growth of the market.
In silicon-bimetallic networks for pancreas function in vivo detection, AI diagnostics, and home testing for AI services offered by digital pathology companies are improving pancreas function screening. Additionally, the increasing adoption of personalized medicine and preventive healthcare programs utilized within South Korea is also impelling the demand for advanced fecal pancreatic elastase testing solutions.
| Country | CAGR (2025 to 2035) |
|---|---|
| South Korea | 7.5% |
The fecal pancreatic elastase testing market is driven by the rising prevalence of pancreatic disorders, growing awareness about gastrointestinal health, and technological advancements in diagnostic methods. To improve accuracy and efficiency, companies are concentrating on high-sensitivity test kits, automated diagnostic platforms, and enhanced sample processing.
There are some key trends, which include: AI-driven diagnostic support; point-of-care testing; and the packing of fecal elastase tests within other comprehensive gastrointestinal panels.

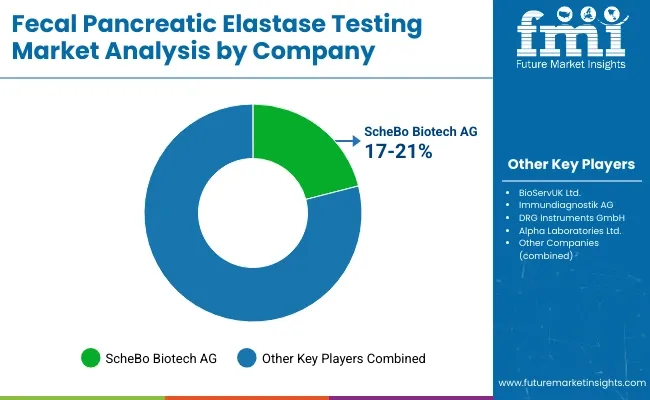
ScheBo Biotech AG (17-21%)
Market Overview and Scope: High Sensitivity, High Specificity, and Reliable Diagnostic Kits for Pancreatic Function Evaluation - ScheBo Biotech AG - ScheBo® Pankreas elastase test systems. Innovation in enzyme immunoassay technologies to improve diagnostic performance. Its global footprint and partnership with health service providers further reinforce its leadership position in the market.
BioServUK Ltd. (13-17%)
BioServUK offers ELISA-based test kits for gastrointestinal and pancreatic function diagnostics. Our mission is to improve the reliability and reproducibility for pancreatic elastase testing. Its growing market presence is supported by BioServUK's prolific network of clinical laboratories.
Immundiagnostik AG (10-14%)
Immundiagnostik AG provides a comprehensive selection of immunoassays, featuring next-level fecal pancreatic elastase assays. The company has combined biomarker research with leading-edge diagnostic solutions to inspire earlier detection of pancreatic disorders. Immundiagnostik at a Glance Immundiagnostik was founded in 1986 and has been continually dedicated to scientific progress in the life science area.
DRG Instruments GmbH (7-11%)
DRG Instruments GmbH a comprehensive range of highly automated diagnostic solutions for fecal pancreatic elastase testing, ensuring improved process efficiency in the clinical laboratory. Integrating elastase tests within larger gastrointestinal panels will streamline diagnostic workflows, and more seamlessly identify patients requiring elastase testing. This has made DRG be a preferred choice for hospitals and research institutions with its focus on laboratory automation.
Alpha Laboratories Ltd. (5-9%)
Alpha Laboratories produces high-quality, high-precision diagnostic kits for fecal pancreatic elastase testing. The company specializes in creating affordable, accessible solutions for everyday clinical testing. Alpha Laboratories have a strong foothold on the European market which is benefitting it very well in being competitive.
Other Key Players (35-45% Combined)
A number of global and regional diagnostic firms focus on fecal pancreatic elastase testing, with a focus on accuracy, automation, and cost-effective solutions. Key players include:
The overall market size for fecal pancreatic elastase testing market was USD 17,504.0 million in 2025.
The fecal pancreatic elastase testing market expected to reach USD 36,413.3 million in 2035.
The demand for the fecal pancreatic elastase testing market will be driven by the rising prevalence of pancreatic disorders, increasing awareness of early disease diagnosis, growing adoption of non-invasive diagnostic methods, advancements in testing technologies, and expanding healthcare infrastructure with improved access to gastrointestinal diagnostics.
The top 5 countries which drives the development of fecal pancreatic elastase testing market are USA, UK, Europe Union, Japan and South Korea.
ELISA kits and rapid testing kits lead the market growth to command significant share over the assessment period.


Full Research Suite comprises of:
Market outlook & trends analysis
Interviews & case studies
Strategic recommendations
Vendor profiles & capabilities analysis
5-year forecasts
8 regions and 60+ country-level data splits
Market segment data splits
12 months of continuous data updates
DELIVERED AS:
PDF EXCEL ONLINE
Pancreatic Cancer Market Size and Share Forecast Outlook 2025 to 2035
Pancreatic Cyst Diagnostics Market
Pancreatic Stone Protein Testing Market Growth - Trends & Forecast 2024 to 2034
Pancreatic Elastase Testing Market Analysis – Growth & Trends 2025 to 2035
Testing, Inspection & Certification Market Growth – Trends & Forecast 2025 to 2035
5G Testing Market Size and Share Forecast Outlook 2025 to 2035
AB Testing Software Market Size and Share Forecast Outlook 2025 to 2035
5G Testing Equipment Market Analysis - Size, Growth, and Forecast 2025 to 2035
Eye Testing Equipment Market Size and Share Forecast Outlook 2025 to 2035
HSV Testing Market Size and Share Forecast Outlook 2025 to 2035
IoT Testing Equipment Market Size and Share Forecast Outlook 2025 to 2035
HPV Testing and Pap Test Market Size and Share Forecast Outlook 2025 to 2035
GMO Testing Services Market Insights – Food Safety & Regulatory Compliance 2024 to 2034
GMP Testing Services Market
LTE Testing Equipment Market Growth – Trends & Forecast 2019-2027
Drug Testing Systems Market Size and Share Forecast Outlook 2025 to 2035
Sand Testing Equipments Market Size and Share Forecast Outlook 2025 to 2035
Tire Testing Machine Market Size and Share Forecast Outlook 2025 to 2035
Self-Testing Market Analysis - Size, Share, and Forecast 2025 to 2035
Food Testing Services Market Size, Growth, and Forecast for 2025–2035

Thank you!
You will receive an email from our Business Development Manager. Please be sure to check your SPAM/JUNK folder too.
Chat With
MaRIA