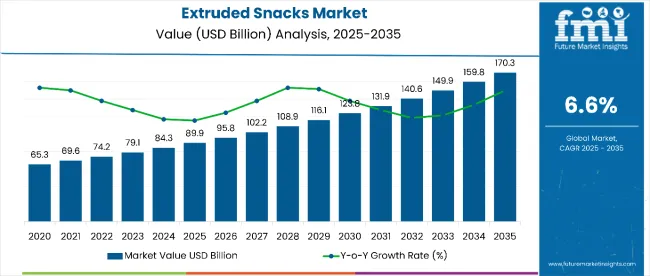
The extruded snacks market is estimated to be valued at USD 89.9 billion in 2025 and is projected to reach USD 170.3 billion by 2035, registering a CAGR of 6.6% over the forecast period. The market is expected to add an absolute dollar opportunity of USD 80.4 billion during this period. Growth is expected to be shaped by increasing demand for convenient, shelf-stable snacks across retail and e-commerce channels, particularly where innovative flavors and enhanced nutritional profiles are preferred.
| Market Size | Value |
|---|---|
| Market Size (2025) | USD 89.9 billion |
| Market Size (2035) | USD 170.3 billion |
| CAGR (2025 to 2035) | 6.6% |
By 2030, the market is likely to reach approximately USD 123.6 billion, generating USD 33.7 billion in incremental value during the first half of the forecast period. The remaining USD 46.7 billion is projected for the second half, suggesting a moderately back-loaded growth pattern as emerging markets expand distribution networks and modern retail penetration accelerates. Product substitution for traditional fried chips and baked snacks is gaining momentum due to extruded snacks’ favorable crispness-to-calorie ratio and extended shelf life.
Companies such as Frito-Lay (PepsiCo) and Calbee are strengthening their competitive positions through investments in advanced extrusion technologies, flavor-infusion systems, and multi-grain formulations at scale. Partnership-based innovation models are enabling expansion into private-label products and online-exclusive offerings. Kellogg’s and Mondelez continue to build market presence through targeted acquisitions and localized product launches, enhancing distribution reach and product variety.
The extruded snacks market is estimated to account for approximately 40% of the global savory snacks segment, supported by its crisp texture, flavor versatility, and strong appeal for at-home and on-the-go consumption. It represents nearly 30% of the healthy snacks category, aided by the growing use of whole grains, multigrain formulations, and high-fiber profiles. The market contributes about 22% to the convenience foods segment, primarily in single-serve and portion-controlled formats. Its share in the on-the-go snack consumption segment is close to 18%, driven by portability and long shelf life. Within the e-commerce snack channel, extruded snacks hold around 25% market share, reflecting strong penetration of direct-to-consumer subscription models and online retail.
Structural changes in the extruded snacks market have been driven by technological advances in twin-screw extrusion systems, enabling precise ingredient blending and better product consistency. Flavor-infusion techniques have enhanced taste without increasing fat content, while reformulations using plant-protein isolates, whole grains, and pulse flours have improved nutritional value.
Packaging innovations, such as modular multipacks and resealable formats, have supported extended usage occasions across retail and foodservice channels. Strategic partnerships with digital retailers have accelerated direct-to-consumer access, compelling traditional snack brands to adopt advanced extrusion systems and agile co-packing solutions.
The growing demand for convenient, shelf-stable, and nutritionally enhanced snack products has been driving the expansion of the extruded snacks market. Consumer preferences have shifted toward healthier alternatives, including high-protein, low-fat, and whole-grain variants, which has accelerated product reformulation and innovation.
Heightened awareness of health-conscious eating patterns and the rising adoption of portion-controlled, on-the-go snack options have strengthened category performance. Additionally, the deployment of advanced extrusion systems and flavor enhancement techniques has improved texture, taste, and ingredient diversity. These improvements have increased consumer acceptance across both developed and emerging markets.
As demand for ready-to-eat snacks continues to grow globally, extruded snacks have been positioned as a competitive alternative to conventional fried and baked products. The outlook remains favorable as manufacturers introduce multi-grain and plant-based options to align with evolving dietary trends, while leveraging digital retail platforms for wider accessibility.
The market is segmented by product type, type, distribution channel, and region. By product type, the market includes potato, corn, wheat, rice, oats, multigrains, and others (millet, quinoa, and pulses). Based on type, it is classified into simply extruded, expanded, and co-extruded.
Distribution channels include hypermarkets & supermarkets, convenience stores, e-commerce platforms, specialty stores, retail stores, and others (direct-to-consumer subscriptions, vending machines, and institutional sales). Regionally, the market spans North America, Latin America, Europe, East Asia, South Asia, Oceania, and the Middle East & Africa.
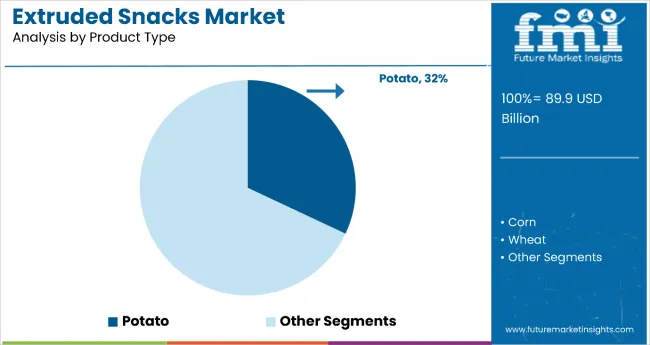
Potato-based extruded snacks are projected to dominate the category with a 32% share in 2025. This dominance is supported by their widespread consumer appeal, versatile taste profile, and established retail presence. Growing demand for low-fat and reduced-calorie potato snacks has influenced manufacturers to innovate with healthier processing techniques and advanced flavor systems. These products are available in multiple formats such as crisps, curls, and puffs, addressing both traditional snacking and health-conscious preferences. Expansion in retail shelf space and e-commerce availability further enhances segment performance.
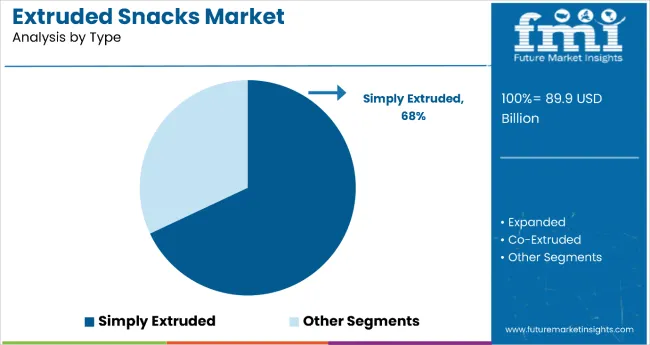
Simply extruded snacks are expected to hold the largest processing type share at 68% in 2025. The popularity of this method is attributed to its ability to deliver desirable texture and retain flavor without complex co-extrusion processes. This segment also benefits from production efficiency and cost-effectiveness, which makes it favorable for large-scale manufacturing. Advancements in extrusion technology have improved product uniformity and nutritional fortification, contributing to rising consumer demand for classic, easily recognizable snack formats.
Hypermarkets and supermarkets are forecasted to maintain their dominance in distribution with a 44% share in 2025. Their strength lies in the ability to provide product variety, bulk purchasing options, and promotional pricing strategies. Strong consumer footfall in organized retail outlets and extended shelf visibility have made this channel a preferred choice for leading brands. The rise of in-store activations and category-specific displays targeting health-conscious consumers has further reinforced segment growth. Retailers are also increasing shelf space for multi-grain, low-fat, and plant-based extruded snacks to cater to evolving consumer preferences.
The global extruded snacks market experienced double-digit year-on-year growth in recent years, with North America accounting for a major share in 2024. Primary applications include convenience snacks, functional snacks with added protein or fiber, and healthier on-the-go formats. Manufacturers have been prioritizing multi-grain and plant-protein-based formulations to improve nutrition and taste profiles. Advanced extrusion systems are enabling innovative shapes and textures, while clean-label positioning and ingredient transparency continue to influence purchasing decisions.
Health-Conscious Trends and Product Innovation Support Market Uptake
The rising demand for nutritious, convenient snacks has been identified as the leading growth driver. Multi-grain formulations provide up to 20% more fiber than conventional potato-based snacks, while snacks fortified with plant proteins such as pea and lentil deliver an estimated 18% higher protein content. Functional inclusions like probiotics and omega-3 fatty acids are also gaining traction, positioning extruded snacks as part of the functional food category. These enhancements align with consumer priorities for health benefits beyond basic nutrition, creating new product development opportunities across global markets.
Ingredient Supply Constraints, Packaging, and Production Limitations
Market growth is challenged by raw material price volatility, packaging shortages, and production capacity constraints. Fluctuations in key inputs such as pulses and cereals have impacted cost structures and pricing strategies. Packaging material shortages have delayed product launches, leading to extended lead times and higher operational expenses. Furthermore, limited facility capacities in major markets like North America and Europe have created bottlenecks, particularly as demand in emerging economies accelerates, requiring significant investments in processing infrastructure to meet global supply requirements.
Key Trends Reshaping the Extruded Snacks Market
Nutritional fortification and flavor diversification are redefining category growth. Manufacturers are incorporating multi-grain blends, clean-label claims, and functional ingredients to capture evolving consumer demand for better-for-you snacks. Inclusion of bioactive components like probiotics and omega-3s has increased product differentiation, while premiumization through unique textures, seasoning innovations, and packaging enhancements has boosted brand engagement. Digital commerce and direct-to-consumer subscription models are further strengthening distribution, enabling broader market penetration in both mature and developing regions.
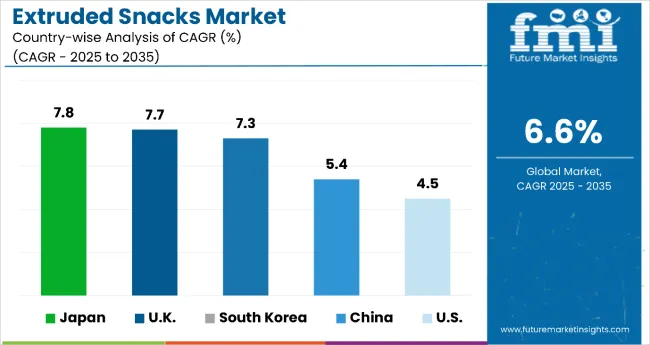
The USA extruded snacks market is projected to grow at a CAGR of 4.5% from 2025 to 2035, supported by strong demand for healthier and plant-based snack alternatives. The UK is expected to register a 7.7% CAGR, driven by increasing consumption of multi-grain and organic snack products. Japan is anticipated to lead with a CAGR of 7.8%, influenced by the rising adoption of low-sodium and low-fat snack options. China is forecasted to grow at 6.6% CAGR as consumer preferences shift toward high-fiber, plant-based snacks despite slowing demand for traditional varieties. Germany is projected to expand at a CAGR of 4.2%, supported by strong interest in functional and high-protein snack solutions.
The extruded snacks market in USA is forecasted to grow at 4.5% CAGR between 2025 and 2035. Expansion is supported by investments in extrusion technology and new processing plants located in key regions such as California, Texas, and Illinois. Health-focused consumers are driving demand for protein-fortified and gluten-free extruded snacks, prompting manufacturers to scale up capacity. By 2025, annual production is expected to exceed 2.5 million tons.
The UK extruded snacks market is projected to grow at a CAGR of 7.7% through 2035. Advanced manufacturing clusters in Yorkshire, Lancashire, and the West Midlands support this expansion. Rising demand for low-calorie, gluten-free, and multi-grain variants has led to increased production capacity. By 2025, output is anticipated to surpass 1.8 million tons annually.
The Germany extruded snacks market is forecasted to grow at a CAGR of 4.2% between 2025 and 2035. Production centers in Bavaria and North Rhine-Westphalia have been modernized to handle demand for high-protein and functional snacks. By 2025, annual output is expected to reach 1.6 million tons.
Revenue from extruded snacks in Japan is set to record the highest CAGR of 7.8% among leading countries. Expansion is driven by demand for premium, low-sodium, and low-fat snacks, supported by the country’s aging population and health-oriented consumption trends. Production hubs in Osaka, Tokyo, and Aichi are expected to produce 1.3 million tons annually by 2025.
Demand of extruded snacks in China is forecasted to grow at a CAGR of 6.6% between 2025 and 2035. Investments in Guangdong, Jiangsu, and Shandong have strengthened production capacity, meeting demand for high-fiber, plant-based snacks in domestic and export markets. Annual output is projected to exceed 3.5 million tons by 2025.
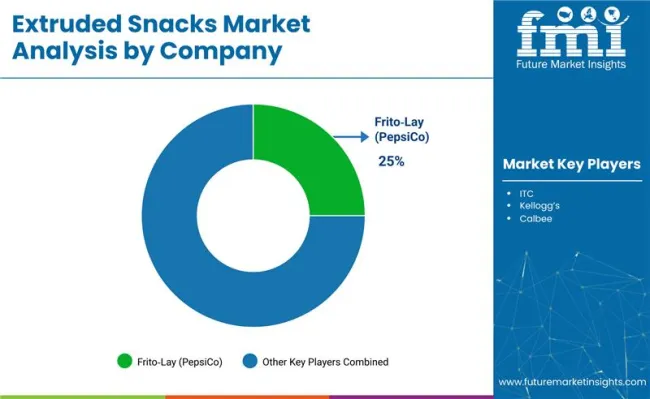
The extruded snacks market remains highly competitive and moderately fragmented, with global players and regional manufacturers vying for market share. Industry leaders such as Frito-Lay (PepsiCo), Calbee, and Kellogg’s continue to dominate through strong brand portfolios, wide distribution networks, and sustained investments in advanced extrusion technologies. These companies are leveraging flavor innovation, plant-based ingredient integration, and sustainable packaging solutions to reinforce their market leadership.
Regional manufacturers, including Haldiram’s (India), Peckish (Australia), and Ideal Snacks (Germany), maintain their positions by addressing local taste preferences and price-sensitive segments. These players often target niche categories like organic, gluten-free, and allergen-friendly snacks to capture health-conscious consumer groups. Strategic initiatives include co-branding, e-commerce collaborations, and small-format packaging for urban consumers.
Entry barriers in this market remain moderate to high due to capital-intensive manufacturing requirements, regulatory compliance, and competitive pricing dynamics. Additionally, the industry is witnessing intensified competition in nutritional positioning and sustainability, compelling companies to adopt cost-efficient production techniques and rapid product innovation cycles.
| Item | Value |
|---|---|
| Quantitative Units | USD 89.9 Billion |
| Product Type | Potato, Corn, Rice, Multigrains, Oats, Wheat, Others (Barley, Quinoa, Sorghum) |
| Type | Simply Extruded, Expanded, and Co-Extruded |
| Distribution Channel | Hypermarkets & Supermarkets, Convenience Stores, E-Commerce Platform, Specialty Stores, Retail Stores, Others (Direct Sales, Vending Machines, Wholesalers) |
| Regions Covered | North America, Latin America, Europe, East Asia, South Asia, Oceania, and Middle East and Africa |
| Country Covered | United States, Canada, United Kingdom, Germany, France, China, Japan, South Korea, Brazil, Australia, and 40+ countries |
| Key Companies Profiled | Frito Lay Inc., PepsiCo, Inc., ITC, Kellogg’s, Calbee, Old Dutch Foods, Mondelez International Inc., Robina Corporation, JFC International, General Mills Inc. |
| Additional Attributes | Dollar sales by product type and end-use sector, increasing demand for healthy snacks, rise in e-commerce sales, innovations in plant-based and high-protein snacks, sustainable packaging solutions, and clean-label ingredients meeting consumer preference for transparency. |
The global extruded snacks market is estimated to be valued at USD 89.9 billion in 2025.
The market size for the extruded snacks market is projected to reach USD 170.3 billion by 2035.
The extruded snacks market is expected to grow at a 6.6% CAGR between 2025 and 2035.
The key product types in extruded snacks market are potato, corn, wheat, rice, oats, multi-grains and others.
In terms of type, simply extruded segment to command 54.2% share in the extruded snacks market in 2025.


Our Research Products

The "Full Research Suite" delivers actionable market intel, deep dives on markets or technologies, so clients act faster, cut risk, and unlock growth.

The Leaderboard benchmarks and ranks top vendors, classifying them as Established Leaders, Leading Challengers, or Disruptors & Challengers.

Locates where complements amplify value and substitutes erode it, forecasting net impact by horizon

We deliver granular, decision-grade intel: market sizing, 5-year forecasts, pricing, adoption, usage, revenue, and operational KPIs—plus competitor tracking, regulation, and value chains—across 60 countries broadly.

Spot the shifts before they hit your P&L. We track inflection points, adoption curves, pricing moves, and ecosystem plays to show where demand is heading, why it is changing, and what to do next across high-growth markets and disruptive tech

Real-time reads of user behavior. We track shifting priorities, perceptions of today’s and next-gen services, and provider experience, then pace how fast tech moves from trial to adoption, blending buyer, consumer, and channel inputs with social signals (#WhySwitch, #UX).

Partner with our analyst team to build a custom report designed around your business priorities. From analysing market trends to assessing competitors or crafting bespoke datasets, we tailor insights to your needs.
Supplier Intelligence
Discovery & Profiling
Capacity & Footprint
Performance & Risk
Compliance & Governance
Commercial Readiness
Who Supplies Whom
Scorecards & Shortlists
Playbooks & Docs
Category Intelligence
Definition & Scope
Demand & Use Cases
Cost Drivers
Market Structure
Supply Chain Map
Trade & Policy
Operating Norms
Deliverables
Buyer Intelligence
Account Basics
Spend & Scope
Procurement Model
Vendor Requirements
Terms & Policies
Entry Strategy
Pain Points & Triggers
Outputs
Pricing Analysis
Benchmarks
Trends
Should-Cost
Indexation
Landed Cost
Commercial Terms
Deliverables
Brand Analysis
Positioning & Value Prop
Share & Presence
Customer Evidence
Go-to-Market
Digital & Reputation
Compliance & Trust
KPIs & Gaps
Outputs
Full Research Suite comprises of:
Market outlook & trends analysis
Interviews & case studies
Strategic recommendations
Vendor profiles & capabilities analysis
5-year forecasts
8 regions and 60+ country-level data splits
Market segment data splits
12 months of continuous data updates
DELIVERED AS:
PDF EXCEL ONLINE
Extruded Polystyrene Market Size and Share Forecast Outlook 2025 to 2035
Extruded Plastics Market Size and Share Forecast Outlook 2025 to 2035
Extruded Cereals Market
Extruded Soy Products Market
Co Extruded Films Market Size and Share Forecast Outlook 2025 to 2035
Rolled Or Extruded Aluminum Rods Bars And Wires Market Size and Share Forecast Outlook 2025 to 2035
Functional Multi-Layer Coextruded Film Market Size and Share Forecast Outlook 2025 to 2035
CBD Snacks Market Size and Share Forecast Outlook 2025 to 2035
Kid Snacks Market Analysis by Source, Type, and Distribution Channel Through 2035
Pet Snacks and Treats Market Analysis by Product, Pet Type, Distribution Channel, and Region Through 2035
Meat Snacks Market Size and Share Forecast Outlook 2025 to 2035
Baby Snacks Market Analysis - Size, Share, & Forecast Outlook 2025 to 2035
Dairy Snacks Market Growth - Consumer Preferences & Industry Trends 2025 to 2035
Competitive Breakdown of Fruit Snacks Suppliers
Fruit Snacks Market Analysis by Product Type, Nature, Flavour Type, Distribution Channel Type, and Processing Type Through 2035
Frozen Snacks Market Analysis - Size, Share, and Forecast Outlook for 2025 to 2035
Healthy Snacks Market Size and Share Forecast Outlook 2025 to 2035
Protein Snacks Market Growth - Demand, Trends & Industry Forecast 2025 to 2035
Oat-based Snacks Market Size and Share Forecast Outlook 2025 to 2035
Pregnancy Snacks Market Analysis by Product Type, Nutritional Content, Distribution Channel, Packaging Format and Stage of Pregnancy Flavors Through 2035

Thank you!
You will receive an email from our Business Development Manager. Please be sure to check your SPAM/JUNK folder too.
Chat With
MaRIA