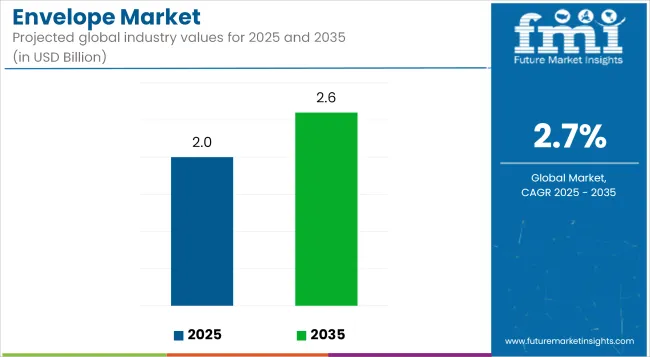
The envelope market is projected to grow from USD 2.0 billion in 2025 to USD 2.6 billion by 2035, registering a CAGR of 2.7% during the forecast period. Sales in 2024 reached USD 1.9 billion, indicating a steady demand trajectory.

| Metric | Value |
|---|---|
| Market Size in 2025 | USD 2.0 billion |
| Projected Market Size in 2035 | USD 2.6 billion |
| CAGR (2025 to 2035) | 2.7% |
This growth has been attributed to the increasing demand for secure and sustainable packaging solutions across various sectors, including e-commerce, postal services, and corporate communications. The rise in direct mail marketing and the need for tamper-evident packaging have further propelled the adoption of innovative envelope solutions.
Supremex Inc., a leading North American manufacturer and marketer of envelopes and a growing provider of paper-based packaging solutions, announced today the acquisition of substantially all of the assets of Royal Envelope Corporation, an envelope manufacturer and lithography company located in Chicago.
“We are very excited with this acquisition that expands our reach in the fragmented USA envelope market and gives us a significant manufacturing presence in the USA Midwest,” said Stewart Emerson, President and CEO of Supremex.
“Royal has established itself as one of the preeminent direct mail envelope manufacturers in North America, utilizing a modern fleet of envelope converting equipment, in-house lithographic printing and embellishing, targeting the financial services sector. We expect this acquisition will generate significant synergies and additional operating efficiencies throughout our network. We are pleased that John, Matt and Mike Pusatera will remain with the Supremex team.”
Product advancements in the envelope market have been closely tied to circular economy principles and regulatory compliance. Several players have replaced traditional plastic window films with cellulose-based transparent substitutes to improve recyclability.
Recycled kraft paper usage, soy-based inks, and water-soluble adhesives have gained traction across eco-conscious consumer bases. Customization options now include biodegradable labels, QR code print zones, and paper-sourced security tints.
Production systems are being upgraded to reduce paper waste via precise sheet calibration and waste collection enhancements. Global suppliers have aligned with ISO 14001 and FSC certification protocols to validate material sourcing integrity.
The envelope market is expected to experience moderate growth despite digitalization challenges, supported by government communication, branded merchandise, and document security applications. Firms are shifting toward hybrid envelopes compatible with both digital inserts and manual handling.
Regulations encouraging paper-based packaging and a return to physical direct mail in marketing campaigns are likely to support segment growth. Supply chain efficiency and localized print-and-distribute models are expected to reduce lead times and material waste. Increased automation, along with standardized dimensions and fold styles, is expected to reduce production costs while ensuring performance consistency.
The market is segmented based on product type, closure type, material, end use, and region. By product type, the market includes cushioned envelopes-such as bubble and padded envelopes-and non-cushioned envelopes. In terms of closure type, the market is categorized into self-seal, peel and seal, and gummed closure. By material, the market comprises plastic (including polypropylene (PP), polyethylene (PE), polystyrene (PS), polyvinyl chloride (PVC), and recycled/sustainable materials) and paper (white kraft and brown kraft).
In terms of end use, the market includes pharmaceuticals, electronics & electricals, automotive & allied industries, food & beverage, cosmetics & personal care, e-commerce, and shipping & logistics. Regionally, the market is analyzed across North America, Latin America, East Asia, South Asia & Pacific, Eastern Europe, Western Europe, Oceania, and the Middle East & Africa.

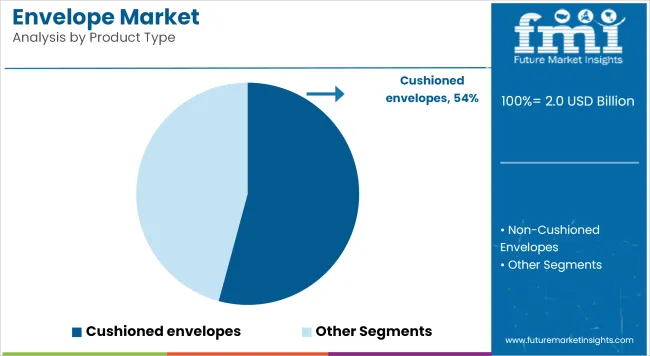
Cushioned envelopes have been projected to hold 54.2% of the envelope market in 2025, driven by the rising need for impact protection during shipment of delicate and high-value items. These envelopes have been manufactured with integrated bubble wrap or padded linings to shield contents from shock and vibration. Materials such as polyethylene bubbles, kraft outer layers, and recycled paper have been widely adopted for durability. Lightweight formats have been selected to reduce shipping costs while maintaining protective capabilities.
Bubble envelopes and padded mailers have been deployed extensively across e-commerce, healthcare, and electronics fulfillment networks. Standardized sizes, peel-and-seal closures, and tamper-evident designs have been incorporated to simplify order fulfillment processes.
Custom printing and branding options have been applied to support marketing and enhance brand recall. Increased demand for sustainable alternatives has resulted in cushioned mailers made from recycled and biodegradable materials.
High-volume users have automated their packing lines to accommodate cushioned envelopes, enhancing speed and reducing manual labor. Anti-static liners and foil layers have been used for electronic and pharmaceutical shipments requiring additional shielding. Hybrid designs combining paper exteriors with cushioning interiors have emerged to align with regulatory recycling requirements.
Custom-sized cushioned mailers have been adopted to minimize material use and dimensional shipping fees. Cushioned envelope designs have been continually optimized to balance strength, recyclability, and cost efficiency. As demand for secure packaging grows, the segment is expected to maintain its lead due to evolving needs in global commerce and temperature-sensitive product delivery.
Digital print capabilities have been employed to add QR codes and tracking labels directly to the envelope surface. These features have enhanced traceability, branding, and product authentication across B2B and B2C channels.

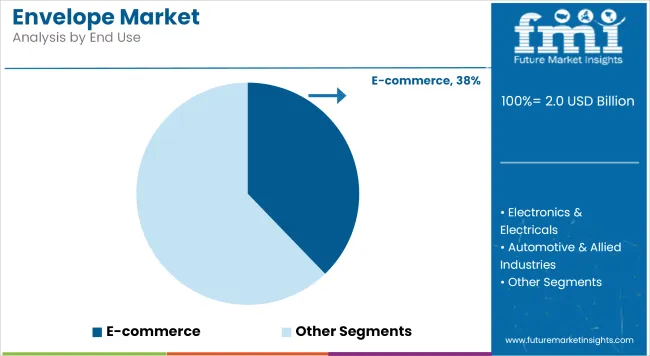
The e-commerce sector has been estimated to account for 37.8% of total envelope market demand in 2025, spurred by online retail expansion, contactless delivery, and cross-border fulfillment. E-commerce platforms have increasingly relied on envelopes for non-fragile and small goods due to their light weight and mailing efficiency.
Protective cushioned mailers have been utilized for books, electronics, cosmetics, and apparel to reduce breakage and maintain presentation. Non-cushioned paper envelopes have been employed for documents, soft items, and product literature.
Fulfillment centers have standardized envelope dimensions to streamline packaging workflows and align with postal guidelines. Custom-branded envelopes have been implemented to reinforce brand identity and improve customer unboxing experiences.
Tamper-evident adhesives, tracking labels, and security barcodes have been integrated to ensure delivery verification and prevent package interference. E-commerce brands have demanded recyclable and compostable envelopes to align with sustainability mandates and customer expectations.
Envelope suppliers have responded with eco-friendly alternatives such as FSC-certified kraft, recycled liners, and plastic-free cushioning materials. Partnerships with logistics providers have enabled development of fit-for-purpose envelopes that reduce void space and optimize parcel delivery costs.
Digital marketplaces have favored self-sealing envelopes for rapid fulfillment and secure closure without tape or staples. White-label and subscription box models have adopted printed envelopes to differentiate offerings and drive retention. Returns processing has also influenced envelope innovation, with resalable closures and reusable mailers gaining popularity in reverse logistics.
Packaging-as-a-service models have promoted the use of smart envelopes with embedded RFID or QR for tracking and automation. Regional e-commerce growth in Asia-Pacific and Latin America has boosted demand for cost-effective, protective envelopes tailored to diverse product categories. As digital commerce scales further, envelopes will continue to play a central role in last-mile delivery performance.
Digitalization Impact, Raw Material Price Fluctuations, and Sustainability Concerns
The envelope market is facing mainly a decrease in demand for the envelope due to the transition towards e-billing and paperless transactions. The envelope is being all but replaced in technology emails, electronic statements and online invitations and as more businesses go paperless or print statement on-demand, population growth does not translate into higher envelope sales.
Other major challenges include the price volatility of raw materials, especially paper, adhesives and printing inks, the latter of which are impacted by disruptions to the global supply chain and environmental regulations. In addition, sustainability is another factor driving manufacturers towards eco-friendly biodegradable and recycled paper envelopes, which negatively impact production ability and lowers profit margins.
Growth in E-Commerce Packaging, Sustainable Envelopes, and Smart Mail Solutions
Despite these challenges, the envelope market is poised for substantial growth, bolstered by increasing demand for sustainable packaging options, secure mail envelopes, and specialty envelopes designed for branding and marketing purposes. The rise of e-commerce and direct mail advertising has driven demand for durable, tamper-proof, and bubble-padded envelopes.
Moreover, eco-friendly envelope materials - like recycled paper, compostable adhesives, and water-soluble printing inks - are increasingly popular as businesses switch to environmentally responsible packaging solutions. Developments in RFID-tagging, document smart tracking and security finely enveloping will also create new markets globally in financial services, legal documentation and secure mailing.

The United States envelope market is moderately growing due to continued demand from the corporate, legal, and government sectors. Although digitalization allows most of the paper-based communication to drop, the requirement of banking, direct mail marketing high-security envelopes, and official documentation keeps the market demand supportive.
The trend of personalized and sustainable envelopes such as biodegradable and recycled paper envelopes is contributing to market growth. In addition, demand for specialty envelopes in luxury invitations and premium packaging is fueling market growth.
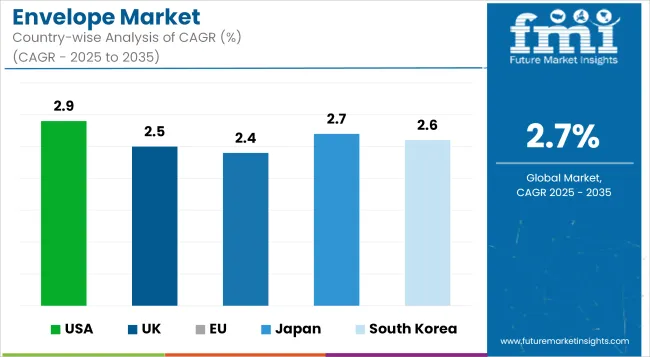
| Country | CAGR (2025 to 2035) |
|---|---|
| USA | 2.9% |
Based on the report, the UK envelope market is growing at a constant rate owing to the demand for corporate stationery, legal documentation, and direct mail campaigns. As the digitalization is suppressing the usage of envelopes in traditional communication, the demand for premium and personalized envelopes is on the rise as they are used in event invitations, gifting, and branding which is a driving factor for the growth of the market.
Moreover, the rising demand for sustainable and recyclable paper products is also influencing the envelope market, with businesses focusing on eco-friendly materials to comply with various environmental norms.
| Country | CAGR (2025 to 2035) |
|---|---|
| UK | 2.5% |
The European Union (EU) envelope market has been experiencing an upsurge in demand owing to the financial services, government correspondence and mailing industry. The ASTM and APM are two organizations currently working to standardize impact on manufacturer relationships in an increasingly electronic world, but the shift to electronic communications and payment has not hurt overall envelope consumption as much as you might think!
There is great demand for customized and eco-friendly envelopes in the packaging and e-Commerce industries, where Germany, France, and Italy are a few key markets in which the market is expected to grow. Moreover, regulations in Europe that favour sustainable paper products are driving the growth of biodegradable and recycled envelopes.
| Country | CAGR (2025 to 2035) |
|---|---|
| EU | 2.4% |
The Japanese envelope market is advancing slowly but steadily, fueled by the strong corporate culture of the country, as well as the continued use of traditional paper for the sake of formal communication. The growth of the market is being propelled by the demand for premium quality and distinctively designed envelopes used for gifting, business emailing or ceremonial mailing.
Innovation and sustainability in envelope designs, such as tamper-proof or high-security envelopes, are also stimulating market growth. And use in Japan’s luxury packaging sector also preserves the relevance of premium envelopes.
| Country | CAGR (2025 to 2035) |
|---|---|
| Japan | 2.7% |
The South Korea envelope market is expected to grow at a steady pace owing to corporate sectors, government institutions, and specialized envelope applications in events and branding. Digital transformation cuts down some standard envelope consumption, but e-commerce and high-end packaging consumption is supporting the market.
The growth of sustainable and high-end envelope styles is driving the market's growth in terms of businesses looking for eco-conscious and attractive envelope solutions. Steady growth in the security envelope market is also driven by demand from the banking and legal sectors.
| Country | CAGR (2025 to 2035) |
|---|---|
| South Korea | 2.6% |
The envelope market is driven by increasing demand for secure mailing solutions, advancements in eco-friendly packaging, and the continued use of envelopes in business and direct mail applications. With the rise of sustainable materials and customization trends, the market is experiencing steady growth. Key trends shaping the industry include biodegradable envelopes, tamper-proof security designs, and digital tracking integration.
Other Key Players
The overall market size for the envelope market was USD 2.0 billion in 2025.
The envelope market is expected to reach USD 2.6 billion in 2035.
The demand for envelope solutions is expected to rise due to increasing demand for secure document mailing, rising adoption of eco-friendly and biodegradable envelopes, and continued use in corporate and legal communication.
The top five countries driving the development of the envelope market are the USA, Germany, China, Japan, and the UK.
Kraft paper envelopes and security envelopes are expected to command a significant share over the assessment period.


Full Research Suite comprises of:
Market outlook & trends analysis
Interviews & case studies
Strategic recommendations
Vendor profiles & capabilities analysis
5-year forecasts
8 regions and 60+ country-level data splits
Market segment data splits
12 months of continuous data updates
DELIVERED AS:
PDF EXCEL ONLINE
Envelope Tracking Chip Market Size and Share Forecast Outlook 2025 to 2035
Envelope Sealing Machines Market Trends - Growth & Forecast 2025 to 2035
Envelope Paper Market from 2024 to 2034
Kraft Envelopes Market Size and Share Forecast Outlook 2025 to 2035
Market Positioning & Share in the Kraft Envelopes Industry
Clear Envelopes and Mailing Supplies Market
Teabag Envelope Market Analysis based on Material Type, End Use, and Region through 2025 to 2035
Building Envelope Market Size and Share Forecast Outlook 2025 to 2035
Security Envelopes Market
Recycled Envelopes Market
Recycled Plastic Envelope Market

Thank you!
You will receive an email from our Business Development Manager. Please be sure to check your SPAM/JUNK folder too.
Chat With
MaRIA