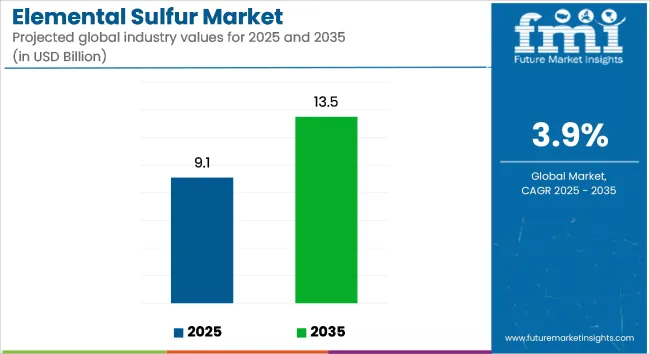
The global elemental sulfur market is valued at USD 9.1 billion in 2025 and is projected to reach USD 13.5 billion by 2035, registering a CAGR of 3.9% over the forecast period. Market growth is being supported by continued demand across phosphate fertilizer production, petroleum refining, and chemical manufacturing, along with emerging applications in battery technologies and elastomer processing.
| Metrics | Values |
|---|---|
| Industry Size (2025E) | USD 9.1 billion |
| Industry Value (2035F) | USD 13.5 billion |
| CAGR (2025 to 2035) | 3.9% |
Elemental sulfur is primarily obtained as a byproduct of hydrocarbon processing through sulfur recovery units (SRUs). Its conversion to sulfuric acid accounts for nearly 60% of global consumption, with fertilizers representing the dominant downstream sector. According to the International Fertilizer Association (IFA), sulfuric acid demand for phosphate fertilizers is forecast to increase by 3.2% annually through 2035, particularly in regions such as Asia-Pacific and Latin America where agricultural intensification is underway.
Environmental compliance is also driving market volumes. In the oil and gas sector, sulfur recovery has been mandated under stringent emission control programs. The USA Environmental Protection Agency and equivalent bodies in Europe and China have established tighter limits on sulfur dioxide emissions, prompting refineries to enhance SRU capacity and optimize recovery efficiency.
In the chemical sector, sulfur is being consumed in the production of phosphoric acid, detergents, and vulcanizing agents used in rubber processing. Automotive and tire manufacturers continue to rely on sulfur-based crosslinking compounds to improve tensile strength and thermal resistance in elastomers.
Interest in next-generation energy storage is contributing to new sulfur use cases. Lithium-sulfur (Li-S) batteries are being developed as high-capacity alternatives to conventional lithium-ion chemistries. In a 2024 report published by Nature Energy, Sion Power demonstrated Li-S cells with energy densities exceeding 500 Wh/kg, highlighting the role of sulfur in advancing battery energy density and weight reduction.
The elemental sulfur market is expected to grow steadily through 2035, with production closely tied to upstream refining volumes. Diversification of applications, expansion in fertilizer manufacturing, and advancements in sulfur-based energy technologies are being viewed as critical drivers shaping long-term demand. Increased integration of sulfur value chains in fertilizer and battery production is likely to support supply stability and downstream market development.
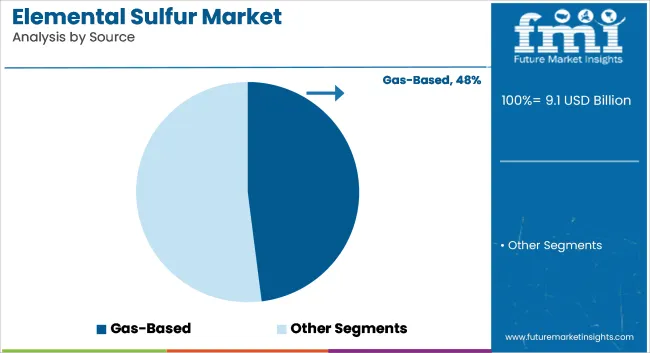
Gas-based sources are estimated to account for approximately 48% of the global elemental sulfur market share in 2025 and are projected to grow at a CAGR of 4.0% through 2035. These sources are primarily derived from hydrogen sulfide (H₂S) recovery during natural gas treatment and refining processes.
Regions with large natural gas reserves such as North America, the Middle East, and Central Asia contribute significantly to sulfur recovery through Claus process units. Gas-derived sulfur offers high purity and consistent supply, supporting its dominant use in fertilizer production and chemical synthesis. With increased investments in gas monetization and sour gas field development, gas-based sulfur continues to play a foundational role in the global supply chain.
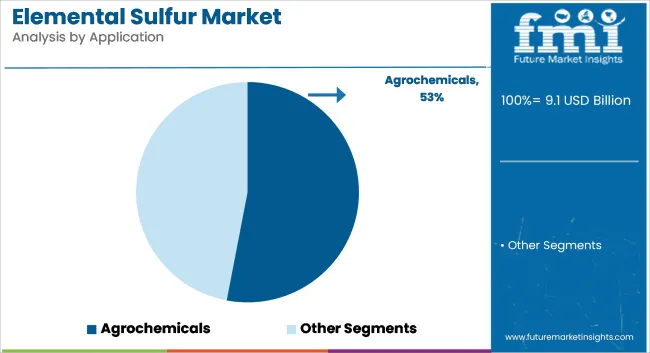
The agrochemical segment is projected to hold approximately 53% of the global elemental sulfur market share in 2025 and is expected to grow at a CAGR of 4.1% through 2035. Elemental sulfur is widely used in the production of sulfuric acid, which serves as a precursor for phosphate fertilizers and is also directly applied in micronutrient blends for sulfur-deficient soils.
Global food security concerns, coupled with rising agricultural productivity targets, are driving increased fertilizer consumption across Asia-Pacific, Africa, and Latin America. As farming practices shift toward balanced nutrient application, sulfur’s role in crop yield optimization continues to reinforce demand in the agrochemical sector. Additionally, the move toward sulfur-enhanced urea and controlled-release formulations supports ongoing volume growth.
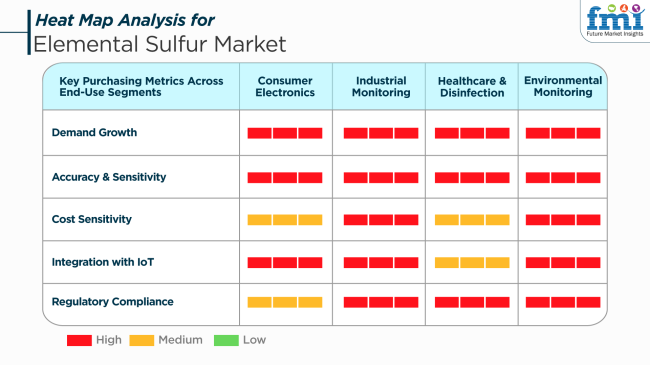
Technical needs, economics, and environmental legislation necessitate the demand for elemental sulfur in many end-use applications. Industrial market watching and environmental watching continue to experience very high demand, particularly fueled by rising investment in emissions regulation, resource conservation, and industrial sustainability initiatives.
Consumer electronics and medical applications, although fewer in amount, require high-purity, sensitive, and regulation-compliant sulfur derivatives. Sulfur finds application in the semiconductor industry in electronics, whereas in the field of medicine, it is applied for sterilization systems and compound production where reliability of performance takes precedence.
Environmental monitoring benefits from the application of sulfur in pollution technologies, especially in the detection and neutralization of airborne pollutants. In this connection, pairing with IoT sensors is gaining momentum for real-time analysis and compliance monitoring. As nations are leading greener economies, the flexibility of sulfur in regulatory-approved and technology-compatible uses is consolidating its place in long-term purchasing plans.
The industry provides several interconnected risks that stakeholders must deal with in the forecast period. One of the key issues is dependence on the oil and gas sector for sulfur extraction, making supply chains susceptible to variations in refinery production globally, geopolitical tensions, and movement towards renewable energy.
Environmental and regulatory risk is also a significant challenge. Though sulfur plays an important role in many ecological and industrial uses, production, transportation, and application of sulfur have environmental burdens. Governments across the globe are enforcing stricter emission and handling requirements for hazardous substances, which could add to operating costs and compliance obligations for manufacturers and users alike.
Economic uncertainty adds another layer of complexity. The industry is sensitive to farm cycles, industrial investment patterns, and macroeconomic influences on construction, manufacturing, and infrastructure projects. Volatile freight rates and local infrastructure bottlenecks may also restrict effective sulfur distribution, making scalability and profitability in global industries difficult.
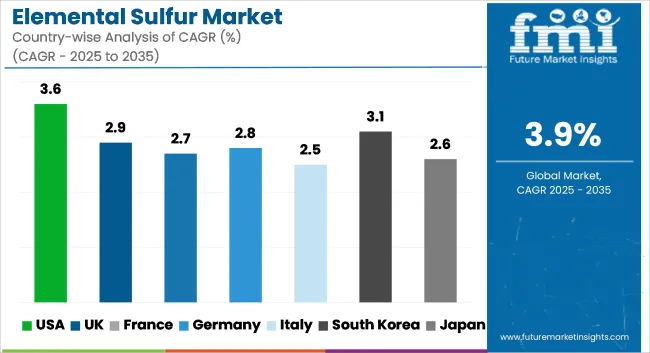
| Countries | CAGR (2025 to 2035) |
|---|---|
| USA | 3.6% |
| UK | 2.9% |
| France | 2.7% |
| Germany | 2.8% |
| Italy | 2.5% |
| South Korea | 3.1% |
| Japan | 2.6% |
| China | 4.2% |
| Australia | 2.4% |
| New Zealand | 2.1% |
The USA industry is forecast to register a CAGR of 3.6% from 2025 to 2035, spurred by robust demand from the chemical processing and agricultural sectors. Most of the elemental sulfur goes into the production of sulfuric acid, a key component in fertilizers, petroleum refining, and industrial chemicals. Higher production of shale gas and stringent environmental regulations have also resulted in a better recovery of sulfur from natural gas processing facilities.
Some of the most prominent players in the USAindustry are Phillips 66, ExxonMobil Corporation, and The Mosaic Company, each of whom has a notable interest in the downstream sulfur chain. Constant investment in sulfur recovery units (SRUs) and refining industry sustainability activities further substantiate the industry's outlook. On top of this, advances in sulfur-based soil amendment technology and precision farming are expected to further fuel industry growth over the forecast period.
The UK industry is anticipated to expand at a CAGR of 2.9% over the forecast period, driven primarily by stable demand in the agrochemicals industry and higher demand for soil fertility. Despite the very small indigenous production of sulfur, the UK enjoys a stable pipeline of imports to meet the requirements of fertilizer manufacturing, particularly in the southeastern agricultural hubs.
Key industry operators such as INEOS Group, Essar Oil UK, and CF Fertilisers are crucial to supply chain stability. In addition, the requirement for environmental regulations and sustainable improvement in the yield of crops has facilitated interest in high-purity sulfur products. Investment in port infrastructure facilitating bulk handling and storage of sulfur will also contribute to improving import capacity and industry resilience.
France is expected to have a CAGR of 2.7% in the industry during 2025 to 2035. The industry is sustained by strong industrial applications, particularly in the chemicals and fertilizers sectors. A majority of the sulfur in France is derived from petroleum refining and natural gas processing, which aligns with the national resource efficiency strategy.
Major industry participants include TotalEnergies, Borealis Group, and Arkema. These participants have dominated the development of sulfur recovery systems that form part of existing refinery processes. Besides this, increasing use of sulfur-based fertilizers in the agricultural sector due to nutrient-depleted soils has boosted long-term industry prospects. Stringent progressive environmental policies also promote sulfur recovery from industrial effluent.
Germany is expected to record a CAGR of 2.8% in the industry from 2025 to 2035. Germany, as a chemical production base, has stable sulfur demand for the manufacture of sulfuric acid, a precursor to numerous industrial and agricultural uses. Strategic investments by Germany in circular economy practices improve sulfur recovery from refining and smelting operations.
Large industry players such as BASF SE, Evonik Industries, and Linde plc facilitate the integration of sulfur technology into greater chemical production systems. Additionally, emphasis on precision farming and cleaner production facilitates the sustainable utilization of sulfur. Regulatory measures under the EU Green Deal also determine sulfur industry dynamics by mandating reduced emission levels as well as increased recovery of resources.
The Italian industry is expected to grow at a CAGR of 2.5% from 2025 to 2035. Sulfur consumption in Italy is directly linked with fertilizer manufacturing and some chemical production operations. Limited local extraction forces Italy to import sulfur, generating reliance on port and logistics facilities for material shipping and handling.
Leading players in the industry are Saras S.p.A., Eni S.p.A., and Gruppo Mossi Ghisolfi. The said companies produce sulfur through refinery processes and have upgrading facilities for high recovery in compliance with environmental laws. The soaring demand for fertilizers that have micronutrient content in south Italy and relentless efforts at agrarian reforms can be expected to drive demand during the forthcoming couple of years.
South Korea is predicted to attain a CAGR of 3.1% for the industry between 2025 and 2035. The industry has stable sulfur consumption in petrochemical refining, electronics, and agriculture. The robust refining capacities allow for high by-product sulfur recovery to maintain domestic demand as well as exportability.
Key players such as SK Innovation, GS Caltex, and Lotte Chemical Corporation spearhead sulfur processing and selling activities. Integration of sulfur management in optimized refining units enhanced efficiency in yields and compliance with area emissions requirements. Furthermore, broader spread practices in precision farming, as well as producing agrochemicals, provide stabilized industry performance.
The Japanese industry will expand at a CAGR of 2.6% between the years 2025 and 2035. Being an industrialized economy, Japan has a stable demand for sulfur in fertilizer, drugs, and sulfur compound production. Domestic refining processes are the primary source of sulfur, supplemented by regulated imports.
Industry majors such as JX Nippon Oil & Energy, Idemitsu Kosan, and Sumitomo Chemical operate active sulfur recovery, purification, and application research. Emphasis on sustainable agricultural cultivation and reduction practices promotes sulfur recycling and reutilization development. More investment in research towards new applications for sulfur, i.e., components of batteries, will generate fresh industry opportunities.
China is anticipated to register the highest CAGR in the industry throughout the forecast period of 4.2%. It is spurred by rapid industrial growth, particularly for chemicals and agriculture, as the foundation of strong demand for sulfur. China's reliance on sulfur for the production of sulfuric acid-bundled in fertilizer output-drives high levels from both domestic recovery and world imports.
Key industry players such as Sinopec, China National Petroleum Corporation (CNPC), and Sinochem International dominate sulfur production and consumption. The Belt and Road Initiative has also cemented sulfur trade and logistics routes. Moreover, shifting environmental policies and refinery and gas plant facility upgrades are improving sulfur recovery levels and propelling industry growth.
Australia's industry is expected to expand at a CAGR of 2.4% from 2025 to 2035. Agricultural use, particularly in deficient sulfur soils of South and Western Australia, is the largest demand component. The country also facilitates the application of sulfur in mining and metallurgical operations, mainly in the gold and copper extraction process.
These firms are large industry players and are mostly engaged in supplying a steady supply of sulfur products in the domestic industry in the form of imports and domestic processing. More emphasis on plant operation and environmental conservation should be driving steady but incremental growth in the marketplace.
New Zealand is expected to record a CAGR of 2.1% in the industry for elemental sulfur during 2025 to 2035. Farm needs, especially for pasture development and animal productivity, are the major drivers of sulfur demand. With negligible domestic production of sulfur, the industry is dependent on imports, dominated by Australia and Asia-Pacific allies.
Firms such as Ballance Agri-Nutrients and Ravensdown establish industry trends using sulfur-enriched fertilizers and tailored blends of nutrients. Ongoing innovation in sustainable land use and environmental protection fuels long-term demand. Emphasis on organic and regenerative agriculture also opens doors for bio-based sulfur solutions, further diversifying industry potential.
The elemental sulfur market is moderately consolidated, with top players controlling 55% of production. Companies are focusing on vertical integration, sustainability, and R&D to maintain dominance.
By source, the industry is segmented into gas-based, oil-based, and mining sources.
By application, the industry caters to multiple industries, including agrochemicals, chemical & petroleum refining, rubber & plastics, mining & metallurgy, and paper & pulp.
By region, the industry spans North America, Latin America, Western Europe, Eastern Europe, South Asia & Pacific, East Asia, and the Middle East & Africa, showcasing its global footprint across both developed and emerging economies.
The global industry size is projected to reach USD 9.1 billion by 2025.
Sales are expected to grow significantly, reaching USD 13.5 billion by 2035.
The oil sulfur segment is playing a key role, given the significant use of sulfur in oil refining processes.
China is expected to see strong growth with a CAGR of 4.2%
Key companies in the market include The Saudi Arabian Oil Company, Marathon Petroleum Corporation, ExxonMobil Corporation, Tengizchevroil, Valero Energy Corporation, Sinopec Corp., Royal Dutch Shell Plc., Pemex, OAO Gazprom, Abu Dhabi National Oil Company, Motiva Enterprises LLC, ConocoPhillips Company, Oxbow Corporation, PotashCorp, Suncor Energy Inc., Flint Hills Resources, Montana Sulphur & Chemical Co., Jordan Sulphur, and the National Est. for Agricultural & Industrial Sulphur.


Full Research Suite comprises of:
Market outlook & trends analysis
Interviews & case studies
Strategic recommendations
Vendor profiles & capabilities analysis
5-year forecasts
8 regions and 60+ country-level data splits
Market segment data splits
12 months of continuous data updates
DELIVERED AS:
PDF EXCEL ONLINE
Elemental Analyzer Market Growth – Trends & Forecast 2019 to 2027
Sulfur-Based Micronutrients Market Size and Share Forecast Outlook 2025 to 2035
Sulfuric Acid Market Outlook & Demand 2024 to 2034
Sulfur Palletized Plant And Granulator Market
Sodium Sulfur Batteries Market Size and Share Forecast Outlook 2025 to 2035
Lithium-sulfur Solid-state Batteries Market Size and Share Forecast Outlook 2025 to 2035
Flue Gas Desulfurization System Market Analysis - Size, Share & Forecast 2025 to 2035

Thank you!
You will receive an email from our Business Development Manager. Please be sure to check your SPAM/JUNK folder too.
Chat With
MaRIA