The global electronics adhesives market is valued at USD 6.1 billion in 2025 and is slated to reach USD 13.8 billion by 2035, recording an absolute increase of USD 7.7 billion over the forecast period. This translates into a total growth of 126.2%, with the market forecast to expand at a CAGR of 8.5% between 2025 and 2035. The overall market size is expected to grow by nearly 2.26X during the same period, supported by increasing electrification of vehicles, rapid adoption of advanced semiconductor packaging technologies, and rising demand for miniaturized electronic devices across automotive, consumer electronics, and industrial applications.
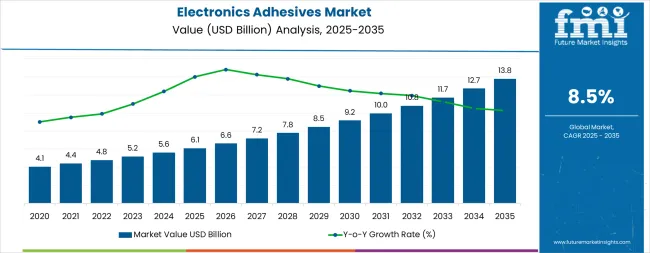
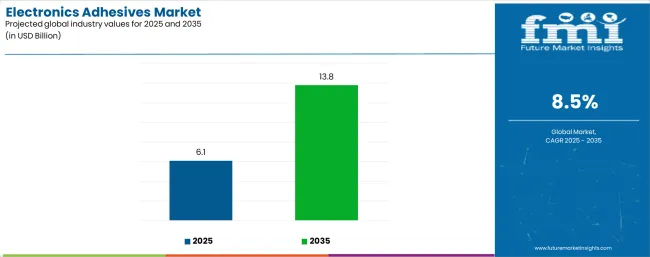
Between 2025 and 2030, the market is projected to expand from USD 6.1 billion to USD 9.2 billion, resulting in a value increase of USD 3.1 billion, which represents 40.3% of the total forecast growth for the decade. This phase of development will be shaped by accelerating electric vehicle production, expansion of 5G infrastructure and data center capacity, and growing adoption of advanced packaging solutions for AI and high-performance computing applications. Electronics manufacturers are expanding their adhesive sourcing capabilities to address the growing demand for thermally conductive materials, high-reliability bonding solutions, and environmentally compliant formulations for next-generation electronic assemblies.
| Metric | Value |
|---|---|
| Estimated Value in (2025E) | USD 6.1 billion |
| Forecast Value in (2035F) | USD 13.8 billion |
| Forecast CAGR (2025 to 2035) | 8.5% |
From 2030 to 2035, the market is forecast to grow from USD 9.2 billion to USD 13.8 billion, adding another USD 4.6 billion, which constitutes 59.7% of the overall ten-year expansion. This period is expected to be characterized by the expansion of advanced underfill technologies for chiplet architectures, the integration of high-thermal-conductivity materials for power electronics, and the development of ultra-fast curing adhesive systems for high-throughput manufacturing. The growing adoption of solid-state batteries in electric vehicles and the proliferation of flexible and wearable electronics will drive demand for specialized adhesive formulations with enhanced thermal management capabilities, superior flexibility, and minimal processing requirements.
Between 2020 and 2025, the market experienced robust growth, driven by increasing automotive electrification and growing recognition of advanced adhesive systems as critical enablers for miniaturization, thermal management, and reliability in modern electronic devices. The market developed as electronics manufacturers recognized the potential for specialized adhesives to enhance product performance while enabling new form factors and improving assembly efficiency. Technological advancement in curing mechanisms and thermal interface materials began focusing the critical importance of maintaining electrical insulation properties and mechanical integrity in harsh operating environments.
Market expansion is being supported by the accelerating electrification of automotive platforms and the corresponding need for high-performance adhesive solutions that can withstand extreme thermal cycling, provide electrical insulation, and ensure long-term reliability in power electronics and battery management systems. Modern electronics manufacturers are increasingly focused on implementing adhesive solutions that can enable miniaturization, enhance thermal dissipation, minimize assembly time, and provide consistent quality in complex electronic assemblies. Electronics adhesives' proven ability to deliver superior bonding performance, thermal management capabilities, and versatile application compatibility make them essential materials for contemporary electronics manufacturing and advanced packaging solutions.
The growing focus on eco-friendly electronics production and supply chain resilience is driving demand for environmentally compliant adhesive formulations that can support zero-defect manufacturing, reduce processing temperatures, and enable efficient rework and repair operations. Electronics manufacturers' preference for materials that combine technical performance with operational efficiency and regulatory compliance is creating opportunities for innovative adhesive implementations. The rising influence of artificial intelligence, high-performance computing, and 5G infrastructure development is also contributing to increased adoption of advanced underfills, die-attach materials, and encapsulation compounds that can provide superior protection and performance in demanding electronic applications.
The electronics adhesives market is poised for rapid growth and transformation. As manufacturers across automotive, consumer electronics, telecommunications, and industrial sectors seek materials that deliver superior thermal management, long-term reliability, miniaturization enablement, and environmental compliance, electronics adhesives are gaining prominence not just as bonding agents but as strategic performance enablers in advanced packaging, power electronics, and next-generation device architectures.
Rising electric vehicle production, semiconductor capacity expansion driven by government incentives, and accelerating AI infrastructure deployment amplify demand, while materials suppliers are advancing innovations in thermal conductivity, fast-cure technologies, and eco-friendly formulations.
Pathways like advanced thermal management materials, next-generation packaging solutions, and sustainability-led differentiation promise strong margin uplift, especially in automotive and high-performance computing segments. Geographic expansion and localization will capture volume, particularly in emerging electronics manufacturing hubs across Asia. Regulatory pressures around automotive qualification, environmental compliance, conflict minerals, and electronics waste reduction give structural support.
The market is segmented by chemistry, application, end use, and region. By chemistry, the market is divided into epoxy (one-part epoxies, two-part epoxies, conductive epoxies), silicone, polyurethane, acrylic, and others. By application, it covers encapsulation (potting/encapsulants, underfills, glob-top/COB, LED encapsulants), surface mounting, wire tacking, conformal coating, and others. Based on end use, the market is categorized into automotive electronics (power electronics/inverters, EV battery/BMS, ADAS & sensors, infotainment/telematics), consumer electronics, industrial electronics, telecommunications, aerospace & defense, and medical devices. Regionally, the market is divided into North America, Europe, East Asia, South Asia & Pacific, Latin America, and the Middle East & Africa.
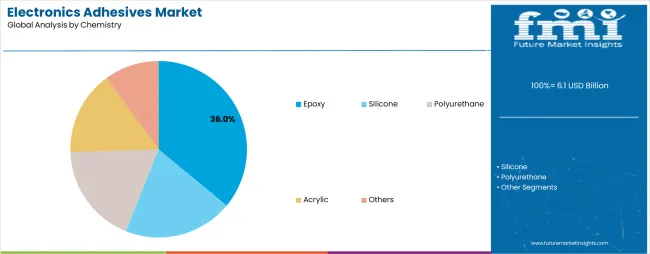
The epoxy segment is projected to account for 36.0% of the electronics adhesives market in 2025, reaffirming its position as the leading chemistry category. Electronics manufacturers increasingly utilize epoxy adhesives for their exceptional bonding strength, superior chemical resistance, excellent electrical insulation properties, and outstanding thermal stability across semiconductor packaging, circuit board assembly, and component encapsulation applications. Epoxy adhesive technology's advanced formulation capabilities and consistent performance output directly address the industrial requirements for reliable protection and operational durability in high-stress electronic environments.
Within the epoxy segment, one-part epoxies command 19.0% of the chemistry market, offering simplified processing and extended shelf life for high-volume manufacturing operations. Two-part epoxies represent 12.0% of the segment, providing superior mechanical properties and chemical resistance for demanding applications requiring customized cure profiles. Conductive epoxies account for 5.0% of the chemistry market, serving specialized applications in electromagnetic shielding, thermal management, and electrical interconnection where both adhesion and conductivity are essential.
This chemistry segment forms the foundation of modern electronics assembly operations, as it represents the adhesive family with the greatest versatility and established performance history across multiple electronic device categories and manufacturing processes. Manufacturer investments in enhanced formulation technologies and application-specific systems continue to strengthen adoption among electronics producers. With electronics companies prioritizing thermal management and long-term reliability, epoxy adhesives align with both technical performance objectives and manufacturing efficiency requirements, making them the central component of comprehensive materials strategies.
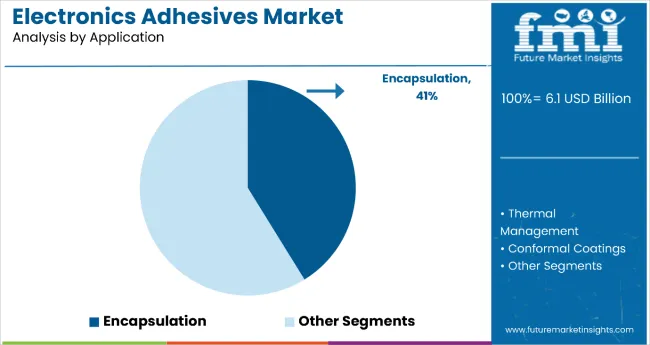
Encapsulation applications are projected to represent 41.2% of electronics adhesives demand in 2025, underscoring their critical role as the primary application category for protecting sensitive electronic components from environmental stress, mechanical shock, and electrical interference. Electronics manufacturers prefer encapsulation adhesives for their ability to provide comprehensive protection while maintaining thermal dissipation capabilities and enabling compact device architectures through efficient material distribution and controlled flow characteristics.
Within the encapsulation segment, potting and encapsulants represent 23.0% of application demand, serving power supplies, automotive control modules, and industrial electronics requiring robust environmental protection. Underfills account for 9.5% of the application market, providing critical stress relief and reliability enhancement for flip-chip assemblies and advanced packaging architectures. Glob-top and chip-on-board applications represent 5.0% of the segment, offering cost-effective protection for consumer electronics and display modules. LED encapsulants command 3.7% of application demand, enabling optical performance and long-term stability for solid-state lighting systems.
The segment is supported by continuous innovation in material formulations and the growing availability of specialized curing technologies that enable premium encapsulation solutions with enhanced thermal conductivity and reduced internal stress. Electronics manufacturers are investing in automated dispensing systems to support precise material placement and quality assurance. As miniaturization trends become more prevalent and reliability requirements increase, encapsulation applications will continue to dominate the application market while supporting advanced protection strategies and performance optimization.
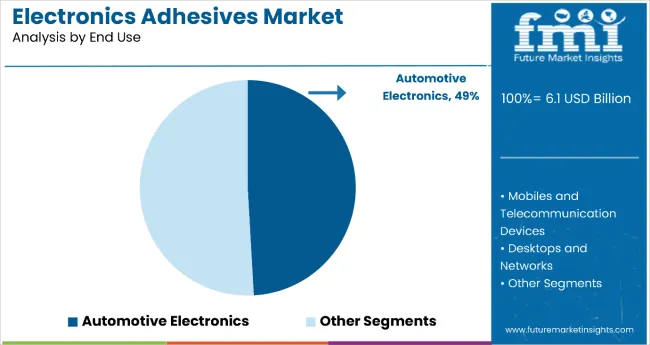
Automotive electronics are projected to represent 49.1% of electronics adhesives demand in 2025, highlighting their critical role as the dominant end-use sector driving adhesive consumption for electrified powertrains, advanced driver assistance systems, and connected vehicle technologies. Automotive manufacturers prefer specialized electronics adhesives for their ability to withstand severe operating conditions, provide long-term reliability under thermal cycling stress, and meet stringent automotive qualification requirements while enabling weight reduction and design flexibility.
Within the automotive electronics segment, power electronics and inverters command 18.0% of end-use demand, serving the critical thermal management and insulation requirements of electric vehicle drivetrains and charging systems. EV battery and battery management systems represent 15.0% of automotive electronics demand, requiring specialized adhesive solutions for cell assembly, thermal interface management, and module encapsulation. ADAS and sensors account for 10.0% of the segment, providing bonding and protection for radar modules, camera systems, and lidar units. Infotainment and telematics systems represent 6.1% of automotive electronics adhesive consumption, enabling display assembly and electronic control unit production.
The segment is supported by accelerating electric vehicle adoption and the growing integration of electronic content per vehicle across all automotive segments. Automotive tier-one suppliers and OEMs are investing in comprehensive adhesive qualification programs to support next-generation vehicle platforms. As automotive electrification becomes more prevalent and autonomous driving capabilities expand, automotive electronics will continue to dominate the end-user market while supporting advanced assembly techniques and reliability enhancement strategies.
The market is advancing rapidly due to accelerating automotive electrification and growing adoption of advanced semiconductor packaging technologies that require specialized bonding solutions with superior thermal management capabilities and long-term reliability performance. The market faces challenges, including stringent qualification requirements for automotive and aerospace applications, price pressure from commoditization in consumer electronics segments, and the need for continuous investment in application engineering support and technical service infrastructure. Innovation in fast-curing UV/visible light systems and nano-enhanced thermal interface materials continues to influence product development and market expansion patterns.
The growing adoption of chiplet architectures, 2.5D and 3D packaging configurations, and heterogeneous integration approaches is enabling semiconductor manufacturers to achieve unprecedented performance levels while requiring sophisticated underfill and die-attach adhesive systems with minimal voiding, exceptional thermal conductivity, and ultra-low coefficient of thermal expansion. Advanced packaging implementations provide improved electrical performance while allowing more efficient heat dissipation and enabling continued miniaturization across data center, artificial intelligence, and edge computing applications. Manufacturers are increasingly recognizing the competitive advantages of advanced adhesive capabilities for enabling next-generation processor architectures and memory-logic integration schemes.
Modern electric vehicle manufacturers are incorporating high-thermal-conductivity adhesive materials and advanced potting compounds to manage the heat generation challenges associated with silicon carbide and gallium nitride power devices operating at elevated temperatures and high switching frequencies. These materials enable improved inverter efficiency while ensuring reliable operation throughout the vehicle lifetime and protecting sensitive electronics from vibration, moisture, and chemical exposure. Advanced thermal management integration also allows automotive engineers to achieve more compact power module designs and enhanced vehicle range through improved thermal dissipation pathways and reduced cooling system requirements.
Electronics manufacturers are demanding adhesive systems that meet increasingly stringent environmental regulations including RoHS, REACH, and conflict minerals compliance while providing halogen-free compositions, low volatile organic compound emissions, and recyclability considerations for end-of-life product recovery. Industry leaders are investing in bio-based raw materials, solvent-free formulations, and energy-efficient curing mechanisms that reduce manufacturing carbon footprint while maintaining or exceeding the technical performance standards required for demanding electronic applications. This eco-friendly focus is creating differentiation opportunities for adhesive suppliers while supporting electronics manufacturers' corporate environmental goals and circular economy initiatives.
| Country | CAGR (2025-2035) |
|---|---|
| India | 10.2% |
| China | 9.4% |
| South Korea | 9.0% |
| Taiwan | 8.7% |
| USA | 8.1% |
| Germany | 6.2% |
| Japan | 5.9% |
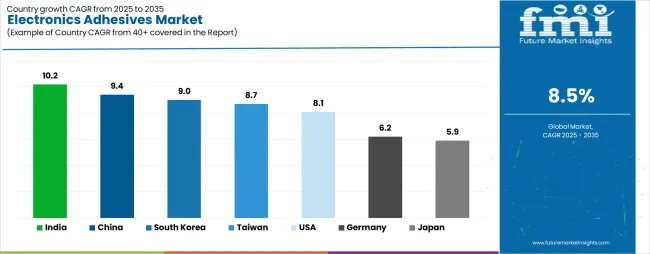
The market is experiencing strong growth globally, with India leading at a 10.2% CAGR through 2035, driven by the expanding electronics manufacturing services sector, growing electric vehicle and battery production, and significant investment in mobile device assembly infrastructure development. China follows at 9.4%, supported by large-scale printed circuit board manufacturing, advanced semiconductor packaging facilities, and growing domestic demand for consumer electronics and 5G infrastructure. The USA shows growth at 8.1%, focusing technological innovation driven by the CHIPS Act and strong demand for automotive electronics, aerospace systems, and medical devices. South Korea records 9.0%, focusing on OLED and micro-LED display leadership combined with advanced memory packaging and EV battery module production. Taiwan demonstrates 8.7% growth, prioritizing outsourced semiconductor assembly and test operations with innovation in underfills and die-attach materials for AI and high-performance computing. Germany exhibits 6.2% growth, focusing power electronics for e-mobility and industrial automation with strict reliability standards. Japan shows 5.9% growth, supported by miniaturization expertise in sensors and robotics combined with materials innovation for high-temperature applications.
The report covers an in-depth analysis of 40+ countries, top-performing countries are highlighted below.
India is projected to exhibit exceptional growth with a CAGR of 10.2% through 2035, driven by expanding electronics manufacturing services infrastructure and rapidly growing production capabilities supported by government Production Linked Incentive schemes for mobile devices, automotive electronics, and battery manufacturing. The country's increasing integration into global electronics supply chains and substantial investment in semiconductor packaging facilities are creating significant demand for advanced adhesive solutions. Major electronics manufacturers and automotive suppliers are establishing comprehensive assembly capabilities to serve both domestic and international markets.
Government support for electronics sector development and Make in India initiatives is driving demand for high-performance adhesives throughout major manufacturing clusters in Bangalore, Chennai, Pune, and Delhi NCR regions. Strong electric vehicle adoption targets and an expanding network of electronics assembly facilities are supporting the rapid uptake of thermal management materials, underfills, and encapsulation compounds among manufacturers seeking enhanced product reliability and export competitiveness.
China is expanding at a CAGR of 9.4%, supported by the country's dominant position in printed circuit board manufacturing, comprehensive semiconductor packaging capabilities, and increasing domestic demand for advanced consumer electronics and automotive applications. The country's integrated electronics supply chain and massive production scale are driving demand for sophisticated adhesive solutions across display manufacturing, smartphone assembly, and power electronics production. International adhesive suppliers and domestic materials companies are establishing extensive technical service capabilities to address the growing demand for application-specific formulations.
Rising 5G infrastructure deployment and expanding artificial intelligence server production are creating opportunities for electronics adhesive adoption across telecommunications equipment manufacturers, data center operators, and cloud computing providers in major technology hubs. Growing government focus on semiconductor self-sufficiency and new energy vehicle development is driving adoption of advanced packaging materials among electronics enterprises seeking enhanced technical capabilities and reduced supply chain dependencies.
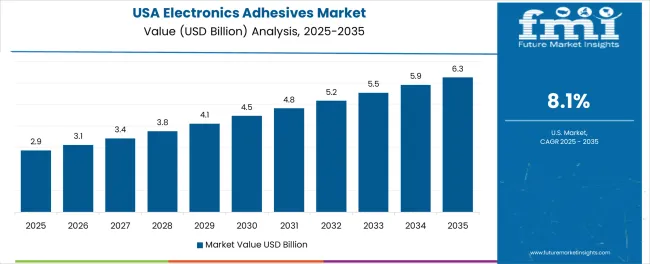
The USA is expanding at a CAGR of 8.1%, supported by the country's advanced semiconductor industry, strong focus on materials innovation, and robust demand for automotive electronics and aerospace systems among quality-focused manufacturers. The nation's leadership in artificial intelligence, high-performance computing, and advanced packaging development is driving sophisticated adhesive requirements throughout the supply chain. Leading technology companies and automotive manufacturers are investing extensively in next-generation electronic systems requiring specialized thermal management and reliability-enhanced bonding solutions.
Rising domestic semiconductor fabrication capacity driven by CHIPS Act incentives is creating demand for advanced packaging adhesives among foundries and integrated device manufacturers seeking to establish complete supply chains within North America. Strong electric vehicle adoption rates and growing medical device production are supporting increased consumption of automotive-qualified encapsulants, biocompatible adhesives, and high-reliability materials across manufacturing operations in major technology corridors.
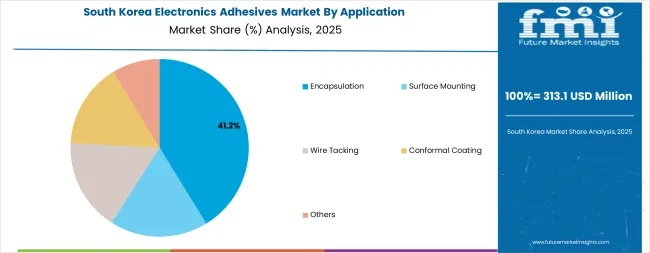
South Korea is growing at a CAGR of 9.0%, driven by the country's dominant position in OLED and micro-LED display manufacturing, advanced memory device production, and growing electric vehicle battery module assembly capabilities. South Korea's technology leadership in flexible displays and three-dimensional memory architectures is supporting demand for specialized adhesive formulations with exceptional optical properties, ultra-thin bondline capabilities, and superior reliability under flexing conditions. Display manufacturers and semiconductor companies are establishing comprehensive materials qualification programs to support next-generation product introductions.
Innovations in foldable display technologies and through-silicon via interconnection methods are driving adoption of specialized underfills and temporary bonding materials that enable advanced manufacturing processes while maintaining yield and performance requirements. Growing electric vehicle battery production supporting both domestic automotive manufacturers and export markets is creating opportunities for thermal interface materials and structural adhesives throughout battery pack assembly operations.
Taiwan is expanding at a CAGR of 8.7%, supported by the country's leadership in outsourced semiconductor assembly and test services, advanced packaging technology development, and comprehensive supply chain integration for high-performance computing and artificial intelligence processors. Taiwan's technology expertise in flip-chip bonding, wafer-level packaging, and heterogeneous integration is driving demand for cutting-edge underfill formulations, die-attach materials, and molding compounds that enable continued performance scaling. Major packaging houses are investing in next-generation materials and processes to support increasing transistor densities and thermal management challenges.
Rising complexity of chiplet-based processor architectures and growing demand for high-bandwidth memory integration are creating opportunities for specialized adhesive materials that provide ultra-low voiding, excellent gap-filling capabilities, and superior thermal conductivity to support emerging packaging configurations. Strong collaborative relationships between packaging service providers and adhesive suppliers are accelerating materials innovation and enabling rapid qualification cycles for new product introductions.
Germany is growing at a CAGR of 6.2%, driven by the country's leadership in automotive electronics manufacturing, power module production for industrial drives and renewable energy systems, and stringent qualification requirements for safety-critical applications. Germany's engineering excellence and focus on long-term reliability are supporting investment in premium adhesive solutions throughout automotive tier-one suppliers and industrial electronics manufacturers. Industry leaders are establishing comprehensive testing and validation programs to ensure materials performance under extreme operating conditions.
Innovations in silicon carbide and gallium nitride power device packaging are creating demand for thermally conductive potting compounds and die-attach materials that can withstand junction temperatures exceeding 175°C while maintaining electrical insulation and mechanical integrity. Growing electric vehicle production across German automotive manufacturers is driving adoption of battery management system adhesives, power electronics encapsulants, and sensor assembly materials throughout integrated supply chains.
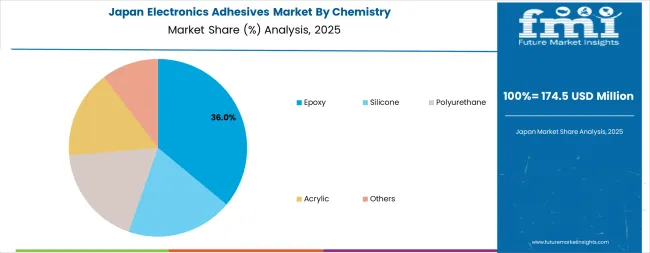
Japan is expanding at a CAGR of 5.9%, supported by the country's focus on ultra-miniaturized electronic components, advanced materials science capabilities, and precision manufacturing expertise across industrial robotics, automotive sensors, and medical diagnostic equipment. Japan's technology leadership in component miniaturization and reliability engineering is driving demand for specialized adhesive formulations with exceptional wetting characteristics, minimal outgassing properties, and superior high-temperature performance. Leading electronics manufacturers are investing in application-specific materials that enable next-generation product differentiation.
Regional specialization in ceramic and hybrid integrated circuits combined with expertise in optoelectronic device manufacturing is creating opportunities for specialized die-attach materials, hermetic seal adhesives, and optically clear bonding compounds that meet demanding performance requirements. Strong focus on zero-defect manufacturing and lifetime reliability testing is driving adoption of rigorously qualified adhesive systems throughout safety-critical and high-reliability electronic applications.
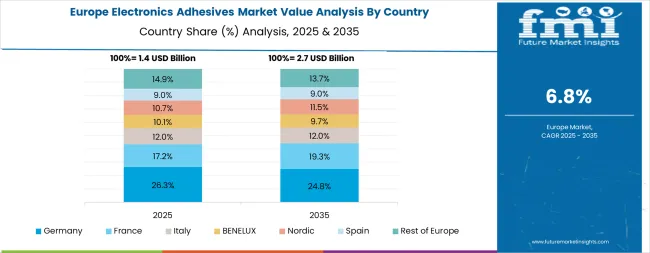
The electronics adhesives market in Europe is projected to grow from approximately USD 1.2 billion in 2025 to USD 2.6 billion by 2035, registering a CAGR of 7.8% over the forecast period, supported by electrification of vehicles, power electronics for renewable energy systems, and strict RoHS and REACH compliance requirements that favor halogen-free and low-VOC chemistries. Germany is expected to maintain its leadership position with a 27.0% market share, driven by its strong automotive electronics industry, advanced power module manufacturing, and comprehensive industrial automation sector serving major European markets. France follows with an 18.0% share, supported by robust demand for aerospace electronics, power systems, and defense applications combined with established semiconductor device manufacturing. The United Kingdom holds a 17.0% share, driven by instrumentation and measurement systems, medical device production, and growing electric vehicle platform development activities. Italy commands a 12.0% share, while Spain accounts for 9.0%, both supported by automotive tier-one suppliers and consumer electronics assembly operations. The Nordic countries maintain a 9.0% share, focusing on telecommunications equipment, power modules for renewable energy, and high-reliability industrial electronics. The Benelux region holds an 8.0% share, focused by semiconductor materials supply and specialty packaging operations. Growth across Europe is underpinned by the EU Chips Act, battery gigafactory projects, and rapid adoption of underfills, potting compounds, and thermally conductive epoxies across electric vehicle and grid-scale power electronics applications.
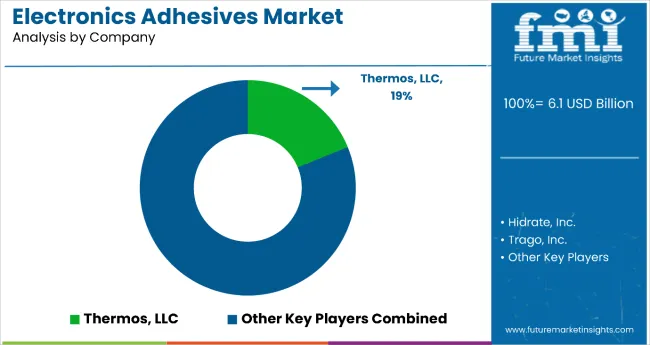
The market is characterized by competition among established specialty chemical companies, advanced materials providers, and integrated electronic materials suppliers. Companies are investing in thermal management technology research, fast-curing formulation development, application engineering support, and comprehensive product portfolios to deliver consistent, high-performance, and application-specific adhesive solutions. Innovation in conductive and thermally enhanced formulations, UV-curable systems, and environmentally compliant chemistries is central to strengthening market position and competitive advantage.
Henkel AG & Co. KGaA leads the market with a strong 15.5% market share, offering comprehensive electronics adhesive solutions under the LOCTITE brand with a focus on automotive electronics, semiconductor packaging, and consumer electronics assembly applications. The company's extensive technical service network and application development capabilities support rapid customer qualification and new product introductions across global electronics manufacturing operations. 3M provides diversified adhesive and bonding solutions with focus on thermal management materials and optical bonding systems for display applications. H.B. Fuller delivers specialized formulations for automotive and industrial electronics with focus on environmental compliance and processing efficiency. Sika AG offers advanced epoxy and silicone systems for power electronics and battery assembly with automotive qualification expertise. Dow focuses on silicone-based materials for high-temperature applications and flexible electronics. Shin-Etsu Chemical specializes in thermally conductive compounds and semiconductor packaging materials serving Asian electronics manufacturing centers.
| Items | Values |
|---|---|
| Quantitative Units (2025) | USD 6.1 billion |
| Chemistry | Epoxy (One-part Epoxies, Two-part Epoxies, Conductive Epoxies), Silicone, Polyurethane, Acrylic, Others |
| Application | Encapsulation (Potting/Encapsulants, Underfills, Glob-top/COB, LED Encapsulants), Surface Mounting, Wire Tacking, Conformal Coating, Others |
| End Use | Automotive Electronics (Power Electronics/Inverters, EV Battery/BMS, ADAS & Sensors, Infotainment/Telematics), Consumer Electronics, Industrial Electronics, Telecommunications, Aerospace & Defense, Medical Devices |
| Regions Covered | North America, Europe, East Asia, South Asia & Pacific, Latin America, Middle East & Africa |
| Countries Covered | United States, Canada, United Kingdom, Germany, France, China, Japan, South Korea, India, Taiwan, Brazil, and 40+ countries |
| Key Companies Profiled | Henkel AG & Co. KGaA, 3M, H.B. Fuller, Sika AG, Dow, and Shin-Etsu Chemical |
| Additional Attributes | Dollar sales by chemistry, application, and end use category, regional demand trends, competitive landscape, technological advancements in curing systems, thermal management innovation, environmental compliance development, and automotive qualification processes |
The global electronics adhesives market is estimated to be valued at USD 6.1 billion in 2025.
The market size for the electronics adhesives market is projected to reach USD 13.8 billion by 2035.
The electronics adhesives market is expected to grow at a 8.5% CAGR between 2025 and 2035.
The key product types in electronics adhesives market are epoxy, silicone, polyurethane, acrylic and others.
In terms of application, encapsulation segment to command 41.2% share in the electronics adhesives market in 2025.


Full Research Suite comprises of:
Market outlook & trends analysis
Interviews & case studies
Strategic recommendations
Vendor profiles & capabilities analysis
5-year forecasts
8 regions and 60+ country-level data splits
Market segment data splits
12 months of continuous data updates
DELIVERED AS:
PDF EXCEL ONLINE
Electronics Retailing Market Size and Share Forecast Outlook 2025 to 2035
Electronics Films Market Size and Share Forecast Outlook 2025 to 2035
Electronics Cleaning Solvents Market - Growth & Demand 2025 to 2035
Electronics Accessories Market Report – Trends & Forecast 2015-2025
2D Electronics Market
HIFI Electronics Market Size and Share Forecast Outlook 2025 to 2035
Power Electronics Market Size and Share Forecast Outlook 2025 to 2035
Green Electronics Manufacturing Market – Sustainability & Trends 2025 to 2035
Marine Electronics Tester Market Size and Share Forecast Outlook 2025 to 2035
Marine Electronics Market Analysis – Growth & Forecast 2024-2034
Printed Electronics Market Size and Share Forecast Outlook 2025 to 2035
Organic Electronics Market Size and Share Forecast Outlook 2025 to 2035
Defense Electronics Obsolescence Market Size and Share Forecast Outlook 2025 to 2035
Printed Electronics Devices Market Size and Share Forecast Outlook 2025 to 2035
Consumer Electronics Packaging Market Size and Share Forecast Outlook 2025 to 2035
Wearable Electronics Market Size and Share Forecast Outlook 2025 to 2035
Consumer Electronics High Voltage Electric Capacitor Market Size and Share Forecast Outlook 2025 to 2035
Graphene Electronics Market Size and Share Forecast Outlook 2025 to 2035
Consumer Electronics Market - Trends, Growth & Forecast 2025 to 2035
Market Share Insights for Consumer Electronics Packaging Manufacturers

Thank you!
You will receive an email from our Business Development Manager. Please be sure to check your SPAM/JUNK folder too.
Chat With
MaRIA